Recycling of worn out brake pads impact on tribology and environment - Nature
←
→
Page content transcription
If your browser does not render page correctly, please read the page content below
www.nature.com/scientificreports

            OPEN           Recycling of worn out brake
                           pads ‒ impact on tribology and
                           environment
                           Yezhe Lyu1 ✉, Jijie Ma1,2, Anna Hedlund Åström1, Jens Wahlström1,3 & Ulf Olofsson1
                           Disc brake systems are widely used on commercial vehicles for braking. The brake pads are usually
                           replaced by new ones before being totally worn out. Current methods to deal with the replaced brake
                           pads include landfill and combustion, resulting in a huge waste of resources and increase of CO2
                           footprint. From a sustainable point of view, this study aims to evaluate the feasibility of recycling
                           replaced brake pads by addressing a protocol recycling procedure. The results show that the recycled
                           brake pads yield similar friction, wear and airborne particle emission to virgin brake pads. A streamlined
                           life cycle assessment is conducted to compare the environmental impacts between producing virgin
                           brake pads and recycling replaced brake pads. Energy consumption and CO2 footprint of the recycled
                           brake pads are 36% and 34% less than virgin brake pads, indicating that recycling could be a promising
                           method of handling replaced brake pads.

                           Disc brake systems are widely used on cars and commercial vehicles for braking. A disc brake system is basically
                           composed of a calliper with one or more pistons, a brake rotor, and two brake pads. The brake rotor is usu-
                           ally made from grey cast iron, which has a high thermal conductivity. The brake pads typically consist of a stiff
                           back plate on which a friction material is bonded (Fig. 1). The friction material can be classified as non-asbestos
                           organic, non-metallic, low-metallic, semi-metallic, or ceramic. In Europe, most passenger cars use low-metallic
                           brake pads, which are complex in constitution and contain several different ingredients as reinforcing fibres,
                           binders, fillers, and frictional additives1. During braking, rotor slides against the friction materials, transforming
                           the kinetic energy of the vehicle into frictional heat2,3. In such a way, the brake pads and brake rotors slowly wear
                           out. During braking, some of the worn materials deposit on roadways and the others become airborne as particu-
                           late matter. It has been found that a large proportion (20% to 50%) of the worn materials during braking become
                           airborne particles in road transport4,5. The micro- and nano-size airborne particles can easily transport for several
                           kilometres in the ambient environment6, inducing short-term7 and long-term8 adverse effects on lung function
                           and weakening pulmonary antimicrobial immune defence9.
                               Brake pads and rotors are usually replaced by new ones before they are totally worn out. One study10 estimated
                           that there is a need of 16 spare pairs of pads and four rotors during the entire lifetime of a car. Since 2010, more
                           than 70 million cars and commercial vehicles are produced every year and it is estimated that one billion cars are
                           running on roads all over the world11. Under such circumstances, replaced brake pads are accumulating rapidly.
                           Since the friction materials on brake pads are non-degradable, disposal of the replaced brake pads is difficult. A
                           common way for dealing with the replaced brake pads is landfill. This method is prone to induce heavy metal
                           pollution of soils12. Another popular way is to combust them to extract the internal energy. Neither of these two
                           methods is advisable due to the waste of resources and increase of CO2 footprint. From a sustainable point of view,
                           recycling replaced brake pads is a promising method due to the conservation of resources and the environment.
                               Replaced brake pad recycling is a new concept and relevant knowledge is still scarce. This paper aims to eval-
                           uate the feasibility of recycling replaced brake pads. This feasibility includes two aspects. One aspect concerns
                           environmental impacts, i.e. the CO2 footprint and energy consumption during the recycling procedure. The other
                           aspect is to evaluate if the coefficient of friction (CoF), wear and airborne particle emission of the recycled brake
                           pads is comparative to the newly manufactured virgin brake pads. Accordingly, this paper firstly tested a com-
                           mercial brake pad friction material with regard to its CoF, wear and airborne particle emission in a pin-on-disc
                           tribometer. Afterwards, the tested friction material is put into a specific recycling procedure. Finally, the CoF,

                           1
                             Department of Machine Design, KTH Royal Institute of Technology, SE-10044, Stockholm, Sweden. 2College of
                           Engineering, Zhejiang Normal University, 321004, Jinhua, China. 3Department of Mechanical Engineering, Lund
                           University, SE-22100, Lund, Sweden. ✉e-mail: yezhe@kth.se

Scientific Reports |   (2020) 10:8369 | https://doi.org/10.1038/s41598-020-65265-w                                                             1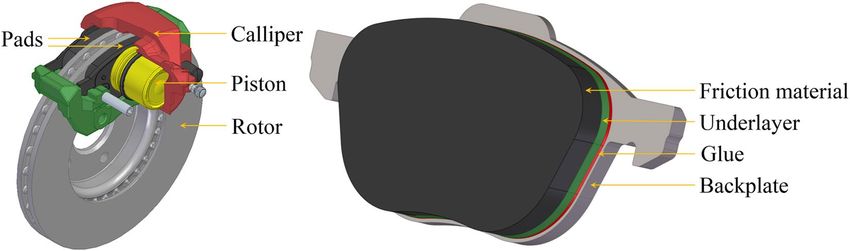
www.nature.com/scientificreports/ www.nature.com/scientificreports
Figure 1. Typical components of a disc brake system and different layers of the brake pad.
Sliding speed
Factors (S) Pressure (P) Material (M)
+ 2 m/s 1.2 MPa Virgin
− 1 m/s 0.3 MPa Recycled
Table 1. Full 23 factorial design for the response variables.
wear and airborne particle emission of recycled friction materials are evaluated with the same test condition as
the virgin friction material. A streamlined life cycle assessment (LCA) of the recycling procedure is conducted to
identify the environmental impacts.
Results
Test plan. The tribological experiment used a pin-on-disc tribometer to test pin samples extracted from vir-
gin and recycled brake pad friction materials against disc samples cut from commercial grey cast iron brake
rotors. Two sliding speeds and two contact pressures at the pin-disc contact are tested in the experiment. The slid-
ing speeds and contact pressures correspond to typical values of urban traffic conditions1,13. This test plan forms a
full 23 factorial design, yielding eight facts (2 levels × 3 factors) as shown in Table 1. Each fact has three replicate
runs. The response variables of the experiment include CoF, wear loss, and particle generation rate.
Friction. The ambient temperature and relative humidity in the tribology test were not controlled but meas-
ured before and after each test. The ambient temperature varied between 24 °C and 27 °C, and relative humidity
between 23% and 42%. Figure 2 shows the representative curves of the measured CoF at varied sliding speed and
contact pressure levels. The factor levels in Fig. 2 keep consistency to the design in Table 1, i.e. from left to right
are S, P, M. It can be noted that all tests yield a running-in period before reaching the steady state, in which the
friction keeps stable to the end of the test.
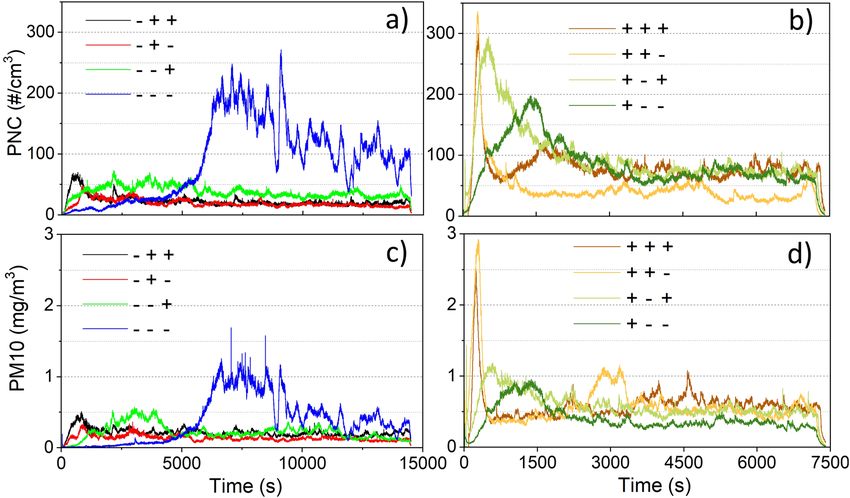
Particle concentration. Representative curves of the measured particle number concentration (PNC) by
TSI Optical Particle Sizer model 3330 (OPS) and PM10 (particulate matter with an aerodynamic diameter smaller
than 10 μm) measured by DEKATI Electrical Low-Pressure Impactor (ELPI+) versus time are presented in Fig. 3.
It can be noted that most of the tests show a running-in period before reaching the steady state similar to the
friction curves in Fig. 2. The running-in period is the process that the contacting surfaces get engaged with each
other by removing the initial surface texture on the superficial surfaces. After the running-in, the steady state is
reached where the contacting surfaces have conformal contact, so that the friction and airborne particle emission
curves become stable. One exception is seen on the test on a recycled sample at 1 m/s and 0.3 MPa (blue curves in
Fig. 3a,c), where the running-in period seems to postpone and last to the end of the test.
Environmental impacts. The environmental impacts of both the virgin and recycled brake pads are
assessed in terms of CO2 footprint and energy consumption for the entire life cycle consisting of several stages, i.e.
material, manufacture, transport, use and disposal. The manufacture stage is streamlined, in which some com-
mon machining procedures for the virgin and recycled pads are identical. Landfill is selected as the method for
disposal of the replaced virgin and recycled brake pads. The calculated data is shown in Table 2.
Discussion
In order to evaluate the feasibility of recycling worn-out brake pads, the first criterion to be fulfilled is that the
recycled brake pad materials should possess similar brake performance (i.e. CoF, wear and particle generation
rate) as the virgin brake pad materials. The 23 factorial design for the tribological experiment has three factors,
and each factor has two levels. In order to evaluate how the change in the factor influences the response variables,
the “effect” of the factor is calculated. The “effect” of a factor is the change in the response variables as the factor
moves from the “−” level to the “+” level. Sometimes, the factors do not behave independently and are therefore
said to “interact”14. Due to that three replicate runs were conducted for each test condition; the estimated effects
and standard errors can be obtained as shown in Table 3. By comparing the estimated effects with their standard
Scientific Reports | (2020) 10:8369 | https://doi.org/10.1038/s41598-020-65265-w 2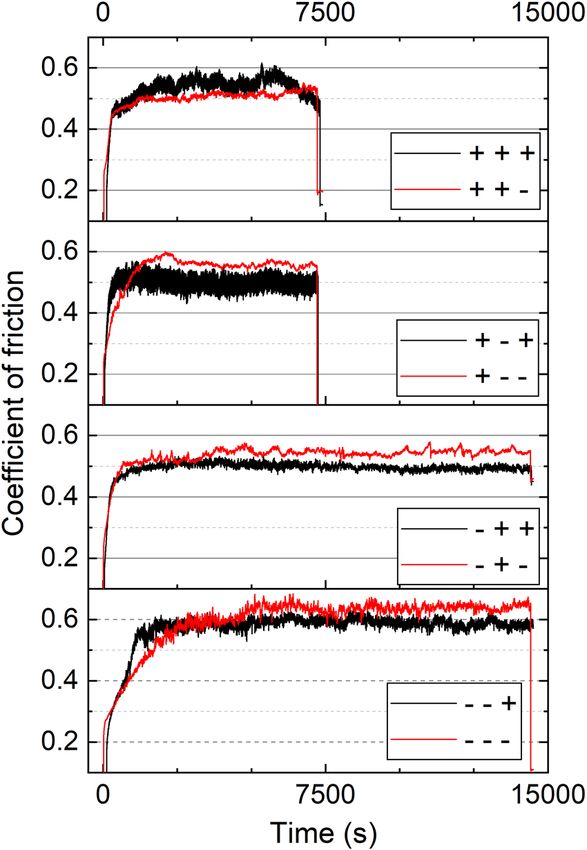
www.nature.com/scientificreports/                                                              www.nature.com/scientificreports

                           Figure 2. Time history of the measured CoF at eight factorial designed facts according to Table 1.

                           Figure 3. Time history of the measured PNC (a,b) and PM10 (c,d) at eight factorial designed facts according to
                           Table 1.

                           errors, some items that require interpretation are highlighted in italics with brackets. Other effects, however,
                           remain unknown since they could be generated by the noise. It should be noted that the interaction effects should
                           be equally interpreted as the main effects.
                               The factors speed (S) and pressure (P) have the greatest effects on the CoF, and their interaction effect has a
                           similar influence. The factor material (M) seems not to strongly affect the CoF. However, its effect on the pin wear
                           is notable and runs second, just after the factor pressure (P). The factor speed (S) dominates the change in disc
                           wear and shows a strong interaction with factor pressure (P). For the particle number rate, all the main effects and

Scientific Reports |   (2020) 10:8369 | https://doi.org/10.1038/s41598-020-65265-w                                                           3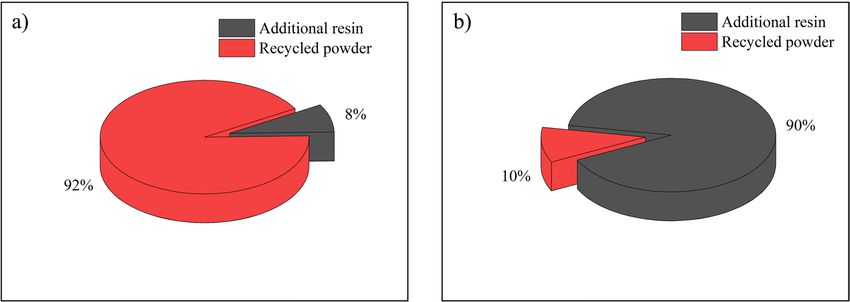
www.nature.com/scientificreports/                                                                                  www.nature.com/scientificreports

                                                                     Manufacture
                            Stage                      Material      (streamlined)         Transport      Use      Disposal       Total
                                            Recycled   149           0.23                  2.93           691      2.63           845.79
                            CO2 (g)
                                            Virgin     598           0.23                  2.93           691      2.63           1294.79
                                            Recycled   2.62          0.003                 0.04           9.60     0.04           12.30
                            Energy (MJ)
                                            Virgin     9.70          0.003                 0.04           9.60     0.04           19.38

                           Table 2. Environmental impacts, i.e. CO2 footprint and energy consumption of virgin and recycled brake pads
                           for the entire life cycle.

                                                                                                                                          Particle
                                                                                                       Pin wear       Disc wear           number rate   Particle mass rate
                                                                             CoF                       (mg)           (mg)                (104#/m)      (μg/m)
                            Effect                       Factors             Estimate ± standard error
                            Average                                          0.55 ± 0.01               90 ± 9         53 ± 6              14 ± 4        0.64 ± 0.13
                                                         Material (M)        −0.02 ± 0.02              (42 ± 18)      16 ± 12             −12 ± 8       −0.34 ± 0.26
                            Main effects                 Speed (S)           (−0.05 ± 0.02)            −21 ± 18       (40 ± 12)           −12 ± 8       −0.12 ± 0.26
                                                         Pressure (P)        (−0.06 ± 0.02)            (67 ± 18)      −13 ± 12            −17 ± 8       −0.23 ± 0.26
                                                         M×S                 0.01 ± 0.02               −11 ± 18       5 ± 12              15 ± 8        (0.64 ± 0.26)
                            Two-factor interactions      M×P                 0.001 ± 0.02              25 ± 18        18 ± 12             14 ± 8        (0.62 ± 0.26)
                                                         S×P                 (0.04 ± 0.02)             −5 ± 18        (31 ± 12)           15 ± 8        (0.72 ± 0.26)
                            Three-factor interaction     M×S×P               0.001 ± 0.02              −11 ± 18       2 ± 12              −14 ± 8       −0.31 ± 0.26

                           Table 3. Calculated effects and standard errors for the 23 factorial design.

                           Figure 4. Mass percentage (a) and energy consumption share (b) of the recycled brake pad material.

                           interaction effects are likely to contribute equally and it is difficult to distinguish the dominant ones. The three
                           two-factor interactions have stronger effects on particle mass rate than the individual main effects.
                               The result of most practical interest is that the factor material (M) is only found to affect the pin wear, and its
                           effects on other response variables are not noticeable. It should also be noted that the main effect of factor material
                           (M) on pin wear is positive, indicating that the recycled pin sample (− level in the design) has lower wear loss
                           than the virgin pin sample (+ level in the design). In other words, the recycling procedure did not degrade the
                           performance of the brake pad material regarding CoF, wear and particle generation rate.
                               The other required criterion is that the environmental impacts (i.e. energy consumption and CO2 footprint) of
                           recycling the worn-out brake pads should not be higher than producing a new one. From Table 2, the energy con-
                           sumption and CO2 footprint of the recycled brake pads are 36% and 34% less than the virgin brake pads, respec-
                           tively. It should be noted that the only difference between the recycled and virgin brake pads falls in the material
                           stage. In other stages, the recycled and virgin brake pads yield identical environmental impacts. Accordingly, an
                           elaborate investigation into the material stage is conducted to analyse the causes of the reduced energy consump-
                           tion and CO2 footprint.
                               The embodied energy of the recycled powder in this study comes from the recycling procedures step 1 and
                           2 (Table 5). Other steps, as common procedures for both recycled and virgin pins, are not included. Figure 4
                           demonstrates the mass and energy share of the additional resin and recycled powder in the recycled brake pad
                           materials. Recycled material accounts for 92% of the total weight but consumes only 10% of the energy in the
                           material phase. It is expected to have a lower energy share by taking this protocol procedure into mass production.
                               To get a better view of the potential decrease in energy consumption and CO2 footprint from the systems per-
                           spective, the figures can be connected to the EU car fleet. The numbers of passenger cars changes per year, but an

Scientific Reports |   (2020) 10:8369 | https://doi.org/10.1038/s41598-020-65265-w                                                                                       4
www.nature.com/scientificreports/ www.nature.com/scientificreports
Figure 5. Schematic of the test equipment.
average between 2012 and 2016 is calculated at 246 million cars per year15. Usually a car has four disc brakes, i.e.
eight brake pads in total. Assuming the following scenario for recycling:
• Life length of car 240,000 km
• All pads changed four times
• At least 25% of the pads are recycled
This results in 1,968 million pads for material recycling, saving 13.9 billion MJ of energy or 6.2 million kg CO2
when comparing virgin produced pads with recycled pads, see Table 2. The energy figure can be related to energy
consumption for heating and hot water in around 300,000 one- and two dwelling buildings in the year 2017 in
Sweden16. The emission of CO2 can be compared to the average emissions, 118.5 g/km from new passenger cars
in the EU in 201717, resulting in a transport length comparable to 1,300 times around the Earth. To be able to
reuse the recycled brake pads into new pads, the material constitution of the friction layer needs to be known.
Therefore, the traceability is of great importance and a specific infrastructure for treatment with collecting, sort-
ing etc. must be developed. Another more direct solution is to use this recycled friction material as an underlayer
material for production of new pads.
Methods
Experimental set-up. The experiment is performed in a pin-on-disc tribometer placed in a one-way ven-
tilated chamber18. Figure 5 shows the schematic of the test set-up. The fan pumps in the ambient air from the
room air opening and pushes it through a nano-size particle filter (particle collection efficiency of 99.95%).
Plastic tubes are totally sealed. In such a way, theoretically clean air without background airborne particles can be
achieved in the closed box chamber. The inlet air velocity is measured with a TSI air velocity transducer Model
8455 so that the air flow rate can be calculated with the known area of the air inlet. During testing, the vertically
mounted pin sample slides with a horizontally rotating disc. The dead weight applies the normal force at the pin-
disc contact. An HBM Z6FC3/20 kg load cell is set on the side of the pin holder and measures the tangential force
at the contact. CoF between the pin-disc contact can be calculated by dividing the measured tangential force by
the normal force. Airborne particles generated from the sliding pin-disc contact is measured by a TSI Optical
Particle Sizer (OPS) model 3330 and a DEKATI Electrical Low-Pressure Impactor (ELPI+) set at the air outlet
sampling point. The OPS measures particle number concentration and size distribution in the size range from 0.3
μm to 10 μm. The ELPI+ measures particle mass concentration and size distribution in the size range from 6 nm
to 10 μm. The sampling frequency is 1 Hz for all instruments. The mass loss of samples is measured by weighing
them before and after the test to the nearest 0.1 mg using a Sartorius ME614S balance.
Materials. Commercial brake pad friction material and brake rotor material used on a typical medium sized
car in the EU are tested in this study. This disc brake system consists of a sliding caliper, two low-metallic pads and
a ventilated grey cast iron rotor. The chemical compositions (obtained with X-ray Fluorescence Spectrometer)
of the friction material on the brake pad and grey cast iron rotor are shown in Table 4. Pin samples (10 mm in
diameter for the testing surface) are cut from unused virgin brake pads and disc samples (60 mm in diameter and
6 mm thick) from unused grey cast iron brake rotors.
Tribology experiment. Two sliding speeds (2 m/s and 1 m/s) between the pin and disc are tested. These two
speeds correspond to typical city traffic conditions1, where the corresponding mean vehicle speeds are 20 km/h
and 10 km/h, respectively. Each test yields a same sliding distance of 14.1 km. Two contact pressures (1.2 MPa and
0.3 MPa) are tested, which correspond to hard braking and decelerating to correct speed conditions. Each contact
combination (sliding speed + contact pressure) is repeated three times.
Scientific Reports | (2020) 10:8369 | https://doi.org/10.1038/s41598-020-65265-w 5www.nature.com/scientificreports/ www.nature.com/scientificreports
Element C Si Mn S Fe Cu Zn Sn Ca Cr Mg Al F
Pad 39.8 3.13 N/A 2.37 16.7 9.12 5.57 4.08 0.52 2.53 6.71 7.31 0.43
Disc 3.80 1.80 0.65 0.06 balance N/A N/A N/A N/A N/A N/A N/A N/A
Table 4. Chemical compositions (wt.%) of the brake pad friction material and cast-iron brake rotor.
Duration
Step Action Equipment Parameter (min)
1 Crushing Ball milling machine 50 W 10
2 Screening Manual sieve in 1800 μm N/A N/A
Adding 8 wt.%
3 Manual N/A N/A
phenolic resin
4 Mixing Turbula Shaker-Mixer 180 W 15
5 Hot pressing Hot presser 150 °C/15 MPa 7
6 Curing Industrial oven 200 °C 600
Table 5. Recycling procedure of the tested virgin pins.
Recycling procedure. The tested virgin pin samples are recycled following the process shown in Table 5. It
should be noted that in the screening step, some crushed powders larger than 1800 μm are screened out so that 8
wt.% phenolic resin is added in step 3 to maintain the same amount of recycled pin samples.
Life cycle assessment. The environmental impact of brake pads mainly comes from the following stages:
material stage, manufacture stage, transport, use stage, and disposal19. This study takes energy consumption and
CO2 footprint as the main indices to assess the environmental impact. The energy consumption of the five stages
in lifecycle is calculated as below. The CO2 footprint is not addressed in detail due to its high correspondence
to the energy consumption. The equations and parameters for both energy consumption and CO2 footprint are
provided as a supplementary.
Material phase energy consumption refers to the embodied energy of the raw materials, which is related to
the recycling percentage due to the fact that several raw materials involve recycling contents. Embodied energy of
raw materials is the sum of virgin ingredients and the recycled ones. Due to the mass loss in manufacturing, the
weight of raw materials is greater than the total output of the recycled brake pads. Thus, it is necessary to correct
the mass loss according to the removed percentage. Depending how the manufacturing waste is treated, through
energy recovery or material recycling, the credit will be different. The energy consumption in manufacture stage
includes the processing of each raw material and the following machining of the semi-finished product as a whole.
The mass correcting factor in the material phase is calculated according to the processing technique here and
the cut off percentage. For raw material processes, the manufacture energy is the sum of all processes for each
ingredient. Similarly, the manufacture energy for semi-finished product is the sum of the energy consumption in
each process.
Both raw materials and the final product involve transport. In this study, transport energy consumption of raw
materials is included in the material phase, leaving only the transport of final product to be calculated. Transport
energy is in proportion with product mass and travel distance. The energy consumption of brake pads in the use
stage depends on the vehicle type they are used on, and the life cycle travel distance together with the vehicle.
Disposal mainly relates to the preparation work for landfill, which simply requires the collection of waste pads.
Received: 8 October 2019; Accepted: 29 April 2020;
Published: xx xx xxxx
References
1. Wahlström, J., Lyu, Y., Matjeka, V. & Söderberg, A. A pin-on-disc tribometer study of disc brake contact pairs with respect to wear
and airborne particle emissions. Wear 384, 124–130 (2017).
2. Belhocine, A., Abu Bakar, A. R. & Abdullah, O. I. Structural and Contact Analysis of Disc Brake Assembly During Single Stop
Braking Event. Transactions of the Indian Institute of Metals 68, 403–410, https://doi.org/10.1007/s12666-014-0468-6 (2015).
3. Belhocine, A. FE prediction of thermal performance and stresses in an automotive disc brake system. The International Journal of
Advanced Manufacturing Technology 89, 3563–3578, https://doi.org/10.1007/s00170-016-9357-y (2017).
4. Garg, B. D. et al. Brake wear particulate matter emissions. Environ Sci Technol 34, 4463–4469 (2000).
5. Bukowiecki, N. et al. PM10 emission factors for non-exhaust particles generated by road traffic in an urban street canyon and along
a freeway in Switzerland. Atmospheric Environment 44, 2330–2340 (2010).
6. Olofsson, U. A study of airborne wear particles generated from the train traffic—Block braking simulation in a pin-on-disc machine.
Wear 271, 86–91, https://doi.org/10.1016/j.wear.2010.10.016 (2011).
7. Brunekreef, B. & Holgate, S. T. Air pollution and health. The lancet 360, 1233–1242 (2002).
8. Beelen, R. et al. Long-term effects of traffic-related air pollution on mortality in a Dutch cohort (NLCS-AIR study). Environmental
health perspectives 116, 196–202 (2007).
9. Lyu, Y., Bergseth, E., Tu, M. & Olofsson, U. Effect of humidity on the tribological behaviour and airborne particle emissions of
railway brake block materials. Tribol Int 118, 360–367 (2018).
10. Gradin, K. T. & Åström, A. H. Evaluation of an ECO Audit tool – through an LCA of a novel car disc brake. In NordDesign 2018
(Linköping, Sweden).
Scientific Reports | (2020) 10:8369 | https://doi.org/10.1038/s41598-020-65265-w 6www.nature.com/scientificreports/ www.nature.com/scientificreports
11. International Organization of Motor Vehicle Manufacturers. 2010 Production Statistics, http://www.oica.net/category/production-
statistics/2010-statistics/ (2010).
12. Wei, B. & Yang, L. A review of heavy metal contaminations in urban soils, urban road dusts and agricultural soils from China.
Microchemical Journal 94, 99–107, https://doi.org/10.1016/j.microc.2009.09.014 (2010).
13. Lyu, Y., Wahlström, J., Tu, M. & Olofsson, U. A friction, wear and emission tribometer study of non-asbestos organic pins sliding
against alsic mmc discs. Tribology in Industry 40, 274–282, https://doi.org/10.24874/ti.2018.40.02.11 (2018).
14. Box, G. E., Hunter, J. S. & Hunter, W. G. In Wiley Series in Probability and Statistics (Wiley Hoboken, NJ, 2005).
15. Eurostat. Passenger cars in the EU. https://appsso.eurostat.ec.europa.eu/nui/submitViewTableAction.do.
16. Swedish Energy Agency. Energistatistik för småhus, flerbostadshus och lokaler - samlingspublikation, Stockholm, Sweden, 2017.
http://www.energimyndigheten.se/statistik/bostader-och-lokaler/?currentTab=1#mainheading.
17. Eurostat. Average carbon dioxide emissions per km from new passenger cars. https://ec.europa.eu/eurostat/databrowser/view/
t2020_rk330/default/table?lang=en.
18. Olofsson, U., Olander, L. & Jansson, A. A study of airborne wear particles generated from a sliding contact. Journal of tribology 131,
044503 (2009).
19. Ashby, M. F., Shercliff, H. & Cebon, D. Materials: engineering, science, processing and design. (Butterworth-Heinemann, 2018).
Acknowledgements
The authors acknowledge the financial support from EIT Raw Materials project “ECOPADS” under Grant
Agreement No. 17182. This research also receives funding from European Union’s Horizon 2020 project
“LOWBRASYS” under Grant Agreement No. 636592. Open access funding provided by Royal Institute of
Technology.
Author contributions
Y.L., J.M., A.H.Å., J.W. and U.O. conceived the research idea. Y.L. performed the tribological experiments. A.H.Å.
and J.M. conducted the LCA analysis. All authors discussed the results and contributed to the writing of the
manuscript.
Competing interests
The authors declare no competing interests.
Additional information
Supplementary information is available for this paper at https://doi.org/10.1038/s41598-020-65265-w.
Correspondence and requests for materials should be addressed to Y.L.
Reprints and permissions information is available at www.nature.com/reprints.
Publisher’s note Springer Nature remains neutral with regard to jurisdictional claims in published maps and
institutional affiliations.
Open Access This article is licensed under a Creative Commons Attribution 4.0 International
License, which permits use, sharing, adaptation, distribution and reproduction in any medium or
format, as long as you give appropriate credit to the original author(s) and the source, provide a link to the Cre-
ative Commons license, and indicate if changes were made. The images or other third party material in this
article are included in the article’s Creative Commons license, unless indicated otherwise in a credit line to the
material. If material is not included in the article’s Creative Commons license and your intended use is not per-
mitted by statutory regulation or exceeds the permitted use, you will need to obtain permission directly from the
copyright holder. To view a copy of this license, visit http://creativecommons.org/licenses/by/4.0/.
© The Author(s) 2020
Scientific Reports | (2020) 10:8369 | https://doi.org/10.1038/s41598-020-65265-w 7You can also read