Reducing Phosphorus Fertilizer Input in High Phosphorus Soils for Sustainable Agriculture in the Mekong Delta, Vietnam - MDPI
←
→
Page content transcription
If your browser does not render page correctly, please read the page content below
agriculture
Article
Reducing Phosphorus Fertilizer Input in High
Phosphorus Soils for Sustainable Agriculture in the
Mekong Delta, Vietnam
Pham Thi Phuong Thuy 1, *, Nguyen My Hoa 2 and Warren A. Dick 3
 1    School of Agriculture and Aquaculture, Tra Vinh University, Tra Vinh Province, 126, Nguyen Thien Thanh,
      Tra Vinh City 87000, Tra Vinh Province, Vietnam
 2    College of Agriculture, Cantho University, Campus II, 3/2 Street, Ninh Kieu District, Can Tho 94000,
      Vietnam; nmhoa@ctu.edu.vn
 3    School of Environment and Natural Resources, The Ohio State University, Wooster, OH 44691-4096, USA;
      dick.5@osu.edu
 *    Correspondence: thuypt12000@tvu.edu.vn; Tel.: +84-2943-855-246 (ext. 290)

 Received: 20 February 2020; Accepted: 13 March 2020; Published: 23 March 2020

 Abstract: High rates of phosphorus (P) currently being applied to soils for the production of vegetables
 in the Mekong Delta, Vietnam, has led to concern regarding negative effects on the economy and the
 environment. This research presents a comprehensive study on the determination of P supplying
 capacity in this region of Vietnam to examine the possibility of reducing P fertilizer input. In total,
 120 soil samples were collected to evaluate total P and Bray 1 available P in the soils. Phosphorus
 maximum sorption, degree of P saturation, P release, and the effect of P fertilizer on corn (Zea mays L.)
 yield in greenhouses and fields were also determined. Total P concentrations in 57% of the soil
 samples evaluated yielded high P concentrations (>560 mg P/kg), while 74% of the samples had
 high Bray 1 available P concentrations (>20 mg P/kg soil). Maximum P sorption ranged from 149
 to 555 mg P/kg soil, respectively, and had negative correlation with available P (r = −0.63*). The
 percentages of P saturation ranged from 0.63% to 5.5% and correlated with available P (r = 0.98**).
 Maximum P release ranged from 1.2 to 62 mg P/kg soil, respectively, and correlated with available P
 (r = 0.96**). Corn grown in soils with available P concentrations >15 mg P/kg did not respond to
 P fertilizer in greenhouse or field experiments. We conclude that many farmers in this region can
 reduce P fertilizer input, thus increasing their profits and reducing negative environmental impacts
 associated with excess soil P for sustainable agriculture.

 Keywords: total P; Bray 1 available P; P sorption; P saturation; P release; P fertilizer input; corn yield

1. Introduction
     Much has been written about nitrogen (N), the primary nutrient driving world crop production [1].
However, another element, phosphorus (P), is no less important for supporting crop yields [2], with
greater implications for the environment in terms of eutrophication [2,3]. Phosphorus fertilizer use
in Vietnam more than doubled from 2011 to 2015 [4]. The highest rates of P fertilizer application are
generally associated with high value crops, such as vegetables, and are applied by most of the farmers
in the vegetable planting areas in the Mekong Delta of Vietnam (MD). This fragile area of Southeast
Asia supplies a high percentage of food to Vietnam and is a source of food exports to surrounding
countries. The water drained from the Mekong Delta also influences the environmental quality and
the quality of life for millions of people, which has led to questions related to (1) whether additional
P fertilizer inputs for the enhancement or maintenance of vegetable production are needed, and (2)

Agriculture 2020, 10, 87; doi:10.3390/agriculture10030087                     www.mdpi.com/journal/agriculture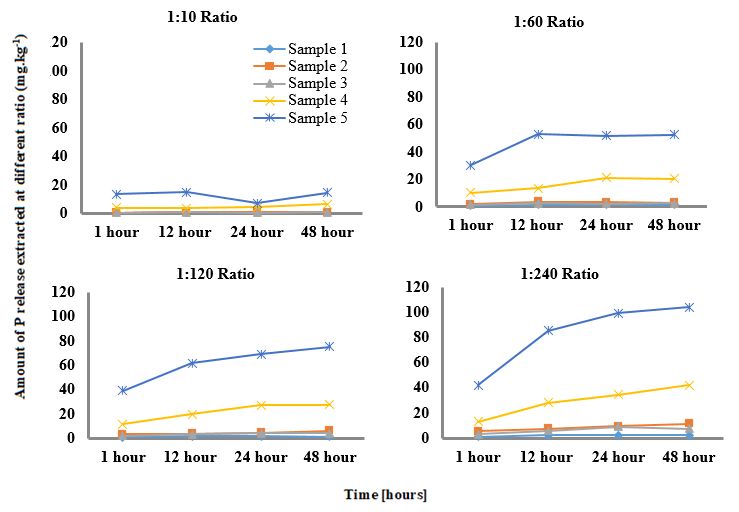
Agriculture 2020, 10, 87 2 of 11
if continuous high P application will increase P leaching into the environment, causing negative
environmental impacts.
Ketterings et al. [5] reported that in New York, USA, 47% of the soil samples tested had values
equal to or higher than the critical agronomic soil test phosphorus value for field crops (4.5 mg kg−1
soils for Morgan extractable P). According to Wortmann et al. [6], no yield increase of sorghum observed
in soils with available Bray 1 P concentrations exceeded 15 mg P kg−1 . Additionally, no response was
reported by Cahill et al. of corn (Zea mays L.) or cotton (Gossypium spp.) to P fertilizer in soils with
available P concentrations of 60–120 mg P dm3–1 or more [7]. Cong et al. [8] reported on P enrichment
in Podzols soil in southeastern Vietnam. In the vegetable growing areas in Tien Giang province in the
MD, where PAgriculture
fertilizer was applied at high rates, available Bray 1 P concentrations in soils
2020, 10, x FOR PEER REVIEW 2 of 11
ranged from
−1
129 to 234 mg P kg [9]. These values are much higher than the 15 mg kg available P level, where −1
no further yield Ketterings
responseetto al. [5] reported that in New York, USA, 47% of the soil samples tested had values
P fertilizer occurred, as reported by Wortmann et al. [10].
equal to or higher than the critical agronomic soil test phosphorus value for field crops (4.5 mg kg–1
The level of P leaching into
soils for Morgan extractable theP).environment depends
According to Wortmann et on P fertilizer
al. [6], and other
no yield increase P inputs, as well
of sorghum
as the adsorption–release
observed in soils with characteristic
available Brayof 1 Psoil, which affects
concentrations exceededavailable
15 mg P kgP . levels.
–1
In soils
Additionally, no with high
response was reported by Cahill et al. of corn (Zea mays L.) or cotton (Gossypium spp.) to P fertilizer
available P, the P release may also be high. Hence, the P 3–1 supplying capacity is high and can provide
in soils with available P concentrations of 60–120 mg P dm or more [7]. Cong et al. [8] reported on
enough P forP plants.
enrichment However,
in Podzols soil if the amount Vietnam.
in southeastern of P release is surplus
In the vegetable to crop
growing areasdemands,
in Tien Giangit may cause
P to move into the inenvironment,
province resulting
the MD, where P fertilizer was in negative
applied environmental
at high rates, available Bray 1impacts [7]. Knowledge
P concentrations in of
soils ranged from 129 to 234 mg P kg–1 [9]. These values are much higher than the 15 mg kg–1 available
the relationships between P fertilizer application regimes, total P, available P, and the level of soil P
P level, where no further yield response to P fertilizer occurred, as reported by Wortmann et al. [10].
saturation is, therefore,
The level needed
of P leachingto into
improve P management
the environment depends oninP soil [11].
fertilizer andThis
otherinformation
P inputs, as wellis missing for
the vegetableasgrowing regions of characteristic
the adsorption–release the Mekong of Delta, Vietnam,
soil, which whichPshould
affects available levels. Inbe studied
soils with highto examine the
available P, the P release may also be high. Hence, the P supplying capacity is high and can provide
possibility of reducing P fertilizer inputs in these regions.
enough P for plants. However, if the amount of P release is surplus to crop demands, it may cause P
Therefore, objectives
to move into the of the studyresulting
environment, were to in evaluate phosphorus
negative environmental content,
impacts phosphorus
[7]. Knowledge of thesorption and
release capacity, and to between
relationships determine the response
P fertilizer applicationof the corn
regimes, totalplant to P fertilizer
P, available in soils
P, and the level ofPhigh and low
of soil
saturation is, therefore, needed to improve P management in soil [11]. This information is missing for
soil P contents in order to have an appropriate recommendation for farmers in the area.
the vegetable growing regions of the Mekong Delta, Vietnam, which should be studied to examine
the possibility of reducing P fertilizer inputs in these regions.
2. Materials andTherefore,
Methods objectives of the study were to evaluate phosphorus content, phosphorus sorption
and release capacity, and to determine the response of the corn plant to P fertilizer in soils of high
A total and
of one hundred
low soil P contentsand twenty
in order to have(120) soil samples
an appropriate were collected
recommendation for farmers from four (4)
in the area. provinces
in the major vegetable planting areas in the MD, Vietnam. These samples were from Thot Not (30
soil samples)2. in
Materials and Methods
Can Tho province, Cho Moi (30 soil samples) in An Giang province, Binh Tan (30
soil samples) in A total Long
Vinh of one hundred
province, and twenty
and Chau(120) soil samples
Thanh were
(30 soilcollected
samples)from four
in Tra(4) provinces in
Vinh province. These
the major vegetable planting areas in the MD, Vietnam. These samples were from Thot Not (30 soil
studied soilssamples)
belongintoCan different soil Cho
Tho province, reference
Moi (30 groups, namely
soil samples) fluvisols,
in An Giang gleysols,
province, Binh Tan and arenosols [12].
(30 soil
Total P was determined
samples) in Vinh byLong
digesting
province,the
andsoil
Chauwith
Thanhconcentrated
(30 soil samples)sulfuric acidprovince.
in Tra Vinh (H2 SOThese
4 ) and perchloric
acid (HClO4 ), and available P was measured by the Bray 1 method (0.05 M HCl + 0.03 M NH4 F) [13].
studied soils belong to different soil reference groups, namely fluvisols, gleysols, and arenosols [12].
Total P was determined by digesting the soil with concentrated sulfuric acid (H2SO4) and perchloric
Figure 1 shows
acidthe corn
(HClO field and research location of the study.
4), and available P was measured by the Bray 1 method (0.05 M HCl + 0.03 M NH4F) [13].
Figure 1 shows the corn field and research location of the study.
Figure 1. Research location in the Mekong Delta, Vietnam [14].Agriculture 2020, 10, 87 3 of 11
Can [15] reported the rating category for total P as being 170–260 mg P kg−1 soil for low,
270–350 mg P kg−1 soil medium; 350–560 mg P kg−1 soil medium-high, and > 560 mg P kg−1 high
content. The rating category for Bray 1 available P content was according to the report of [13], classified
as (3–7 mg P kg−1 soil) for low, (7–20 mg P kg−1 soil) medium, and (> 20 mg P kg−1 soil) high content.
Phosphorus sorption was determined according to the method described by Houba et al. [16], using
nine (9) soil samples selected from the four (4) provinces, which had available P contents ranging
from low to high values (6.8–120 mg P kg−1 ). The amount of P added to soils ranged from 120 to
2400 mg P kg−1 . The ratio of soil-to-solution in these tests was 1:20. The amount of phosphorus
sorbed by the soil was determined by the Olsen method, using 0.5 N NaHCO3 (pH 8.5) as the
extracting solution. Maximum P sorption in soil was determined based on the Langmuir equation for
the relationship between phosphorus sorption and phosphorus concentration at equilibrium in soil
solution, given as
C 1 1
= C+ (1)
q b kxb
where C represents the concentration of the solution after equilibrium (mg P L−1 ), q is the amount of P
sorbed (mg P kg−1 soil), b is the maximum phosphorus sorbed, and k is a constant. The slope of the
line when plotting C/q (y-axis) versus C (x-axis) is equal to 1/b and the y-intercept value is equal to 1/
(k × b).
The degree of P saturation was examined as an index for evaluating the possibility of P release
causing negative impacts to the environment. The degree of P saturation was calculated according to
the method described by Schoumans et al. [17]:
DPS = (Pox/PSC) × 100 (2)
where DPS is the degree of P saturation (%), Pox is the P extracted by ammonium oxalate (mg P kg−1 ),
and PSC (maximum phosphorus sorption capacity of the soil, mg P kg−1 ) is the maximum P sorption
determined based on Langmuir equation.
Phosphorus release was determined following the method described by Sui et al. [18] for the nine
(9) soil samples used for the P sorption study. The amount of P release extracted at ratios of 1:10; 1:60;
1:120; and 1:240 soil/water was measured at different shaking extraction times (that is, after 1, 12, 24, or
48 h, respectively). Maximum P release (mg P kg−1 soil) was calculated as the difference between the
highest P release value and the P release value at 1 h for the 1:240 ratio.
A greenhouse study was carried out at Can Tho University from January to September 2011.
Two consecutive crops of baby corn (Zea mays L.) with the trade name “Amaizing” were grown in
forty (40) soil samples selected from the four (4) provinces and conducted in a randomized complete
block design (RCBD). The two factors considered were (1) 10 different soils in each province (40 soil
samples in 4 provinces), which had available P Bray 1 content ranging from low to high values; and (2)
2 rates of P fertilizer application (0 and 90 kg P2 O5 ha−1 ). Treatments were replicated thrice to give a
total experimental unit of 240 pots, at one plant per pot with 7 kilogram soil, which were frequently
irrigated with water. The 40 different soil samples had Bray 1 available P values ranging from 5.8 to 77
mg kg−1 soil for Can Tho province, 6.8 to 87 mg kg−1 soil for An Giang province, 13.1 to 120 mg kg−1
soil for Vinh Long province, and 13 to 224 mg kg−1 soil for Tra Vinh province. N and K fertilizers were
applied at a rate equivalent to 160 kg N ha−1 and 90 kg K2 O ha−1 according to the recommendation of
the Ministry of Agriculture and Rural Development, Vietnam [19]. The soils used in experiments were
the fluvisol and gleysol groups, which had pH values ranging from 4.9 to 6.2, belonging to the silty
clay textural class, the parent material of which is alluvial sediment; and the arenosols group, which
had pH values ranging from 6.2 to 7.0 and belongs to the sandy loam textural class, the parent material
of which is a mixture of alluvial and marine sediments. Baby corn was planted as the test crop for the
two cropping seasons and yield was determined by measuring the total dry weight of the corn ears.Agriculture 2020, 10, 87 4 of 11
Corn response was calculated by the yield difference between the 90 kg P2 O5 /ha treatments and the 0
kg P2 O5 /ha treatments for each crop.
Field experiments were also carried out in an village, Cho Moi district, An Giang province, from
January to September 2011, with two consecutive crops grown at two sites (sites 1 and 2), having
high and medium available P contents of 21 and 15 mg P kg−1 , respectively. At the onset of planting
the second crop, one more site (Site 3) with low available P content of 6.8 mg P kg−1 was selected
for examining corn response to P fertilizer in low available P soil. Hybrid sweet corn of F1 M × 10
variety was used in these experiments. The experiments were carried out using a randomized complete
block design (RCBD), with three P fertilizer rates (0, 45, and 90 kg P2 O5 ha−1 ) and four replications
produced from 12 experimental plots in each of the sites. The sizes of the experimental plots were
33–47 m2 . Nitrogen and potassium fertilizer were fixed at doses of 160 kg N ha−1 and 90 kg K2 O ha−1 ,
respectively, according to the recommendation of the Ministry of Agriculture and Rural Development,
Vietnam [19]. Corn yield was determined by measuring the total fresh fruit weight of a 6 m2 /plot.
Fresh fruits included grain, pericarp, and endosperm.
3. Statistical Analysis
Data were statistically analyzed for ANOVA (Minitab 13) using the general linear model function
and treatment means were differentiated using Tukey’s test. Simple linear Pearson’s regression and
correlation were also calculated. The level of significance used for the tests was at least 5%. The
Minitab software version 16 was used for all statistical analysis.
4. Result and Discussion
4.1. Total and Available Phosphorus Concentrations
Table 1 shows the total phosphorus contents in the evaluated soils. Soils in the high category
(total P > 560 mg P kg−1 ) accounted for 57% of the total studied samples. Debusk et al. [20] reported
that there was total P in 48% of the area in 1990 and an increase of 73% in 2001 due to P run-off from the
agricultural soils in the Everglades in the United States, and total P > 500 mg P kg−1 was considered as
rich. Table 1 shows that Bray 1 available P concentrations ranged from 3.6 to 224 mg kg−1 , with 74% of
the soil samples classified as high (that is, concentrations were 20.4 mg P kg−1 or higher). The reason
may be the high rates of P applied to soils for the production of vegetables in the Mekong Delta of
Vietnam. Along with this study by Hoa et al. [9], the survey results of 120 farmers in 4 provinces of
Can Tho, An Giang, Vinh Long, and Tra Vinh showed that farmers applied 109 to 194 kg P2 O5 ha−1 on
leaf vegetables, baby corn, hybrid sticky corn, and tomato.
Table 1. Total P and Bray 1 available P concentrations and ratings of 120 soils from 4 provinces in major
vegetable planting areas in Vietnam.
Range of Soil P Rating Category Samples in Rating Category (%)
Total P (mg kg−1 soil)
568–1048 High 57
393–524 Medium-High 36
306–349 Medium 6.2
131 Low 1.0
Bray 1 available P (mg kg−1 soil)
20.4–224 High 75
7.3–19.5 Medium 20
3.6–6.8 Low 5.0Agriculture 2020, 10, 87 5 of 11
4.2. Maximum Phosphorus Sorption
Table 2 shows that the correlation between P sorption content and equilibrium P in soil solution,
which followed a simple Langmuir equation, had a high determination coefficient (R2 of 0.72 to
0.99). Therefore, this equation could be used to calculate the qm value. Maximum P adsorption
concentrations (qm) were high (384–588 mgP kg−1 ) in soils with low and medium available P content
and lower (149–454 mg kg−1 ) in soils with high available P. It seems that the soil samples with initially
high available P contents had mostly saturated P fixation sites, with less P sorbed. These results are in
line with the report of Can [21], indicating that P fixation occurred rapidly at low concentrations and
depended on soil characteristics. The predominant reactions are precipitation at high P concentration
in solution and adsorption at low P concentration [22,23].
Wang et al. [24] reported on a higher sorption in calcareous soils with qm = 691–1664 mg P kg−1 ,
while Villapando et al. [25] found similar results to our study for spodosols (qm = 224–560 mg P kg−1 ).
Our results also showed a negative correlation between maximum P sorption and available P, with
correlation coefficient r = –0.63* (p < 0.05); therefore, the more available P in soils, the less P from
fertilization was sorbed, resulting in high P content leaching to the environment. Hence, it is important
to note that when more P fertilizer is added to soils already containing high amounts of available
P, P sorption in soil decreases and the risk of P run-off to environment becomes high in these soils.
Therefore, P fertilizer rates in these major vegetable growing areas should be adjusted to prevent the
risk of P run-off to the environment, especially in high available P soils.
Table 2. Langmuir equation and its determination coefficient (R2 ), maximum P sorption, degree of P
saturation (DPS), maximum P release, and correlation coefficient (r) between these parameters in the
studied soils from 4 provinces in Vietnam. Note: ns, not significant.
Available P Maximum P Maximum P
Available P Langmuir Equation DPS
Content R2 Sorption Release
Category C/q = C/qm + (1/k) qm (%)
(mg kg−1 ) (mg kg−1 ) (mg kg−1 )
Low 6.8 C/q = 0.0018C + 0.0038 0.98 555 0.63 1.2
13 C/q = 0.0026C + 0.0071 0.96 384 1.1 4.3
Medium
13 C/q = 0.0017C + 0.0083 0.73 588 0.97 6
21 C/q = 0.0022C + 0.0045 0.72 454 2 6.2
38 C/q = 0.0050C + 0.0263 0.98 200 2.4 6.7
47 C/q = 0.0029C + 0.0145 0.99 344 3.1 30
High
87 C/q = 0.0023C + 0.0133 0.97 424 5.3 33
92 C/q = 0.0067C + 0.0112 0.97 149 4.7 37
120 C/q = 0.0037C + 0.0039 0.99 270 5.5 62
The r values of maximum P sorption, DPS, and maximum P release with
−0.63* 0.98** 0.96**
available P, respectively
The r values of DPS and maximum P release with maximum P sorption. −0.61* −0.52ns
The r value of maximum P release with DPS. 0.91*
Where q is the amount of P adsorbed (mg kg−1 soil), qm is the maximum amount of P adsorbed (mg kg−1 soil), C is
the concentration of the solution after equilibrium (mg kg−1 soil). k is a constant, ns, no difference; * significant
difference at 5%; and ** significant difference at 1%.
4.3. Degree of P Saturation
In soils with low and medium available P, the degree of P saturation (DPS) ranged from 0.63%
to 1.1%. Table 2 shows that the DPS values were higher in soils with high available P, ranging from
2% to 5.5%. The DPS in these soils from Vietnam were lower than the critical level of DPS (25%) for
evaluating P contamination in ground water established by van der Zee et al. [26]. They reported that a
DPS > 25% indicates a surplus of P in soils, for which P fertilization is not advised. However, in another
study, Schoumans et al. [17] evaluated P leaching risk by comparing the actual DPS of the soils and the
critical DPS of the soil type. They observed that the critical phosphorus saturation degree varies from
5% to 78%, and about 43% of the agricultural land in the Netherlands exceeded the critical DPS valueAgriculture 2020, 10, 87 6 of 11
for the soil type. They concluded that a large area of agricultural land in the Netherlands contributes
to the P pollution of surface water or is expected to contribute to the P pollution of surface water in the
near future. According to Schoumans et al. [27], the degree of phosphate saturation is defined as DPS
= 100 × Pact /PSC, where DPS is the degree of P saturation (%), Pact is the actual amount of sorbed P in
soil (extractable by oxalate; kg ha−1 , and PSC is the maximum phosphate sorption capacity of the soil
(kg ha−1 ). They also reported that a critical DPS of 25% had been established by van der Zee et al. [26].
Zhou et al. [28] reported that when P sorption increases due to high P application, P release also
increases, and hence the risk of P contamination in water increases. Zhou et al. [28] observed DPS
values of 0.02–0.27% in submerged soils, 4–20% in vegetable soils, and 4–10% in fruit garden soils.
The DPS values of our studied soils were in the low value range reported by Zhou et al. [28], and
were in the low value range for the DPS critical values reported by Schoumans et al. [27]. Since P
sorption–precipitation in different soil groups has a particular behavior and as DPS may be calculated
by different methods, the above comparisons only provide information regarding the value ranges of
DPS in different soil groups.
In our study, the available P concentrations in these same soils were observed to increase by 7.2
and 56 mg P kg−1 after five applications of 90 kg P2 O5 ha−1 in the greenhouse study. Therefore, the
risk of P run-off to the environment is expected to increase if P fertilizer is continuously applied at
this high rate. Sharpley et al. [1] also reported that excess P can cause P run-off or leaching to water
resources, raising concerns about the agricultural contribution to eutrophication of inland waters and
marine environments.
4.4. Phosphorus Release and Correlation
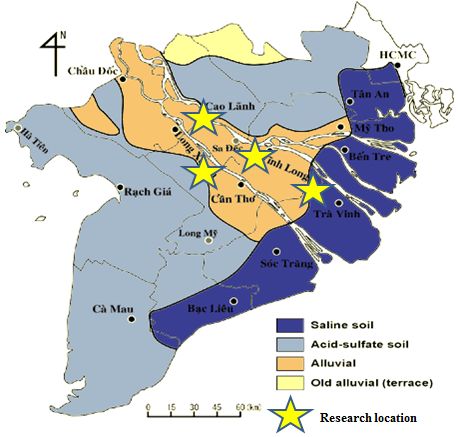
Phosphorus released from soil reached a maximum content at an extraction ratio of 1:240 for
soil/water (Figure 2). There were some soil types with high available P content that also released high
amounts of P at the extraction ratios of 1:60 and 1:120, however the differences were not statistically
significant (p < 0.05) compared to the 1:240 extraction ratio; therefore, P release values at 1 h for the
1:240 ratio were selected for the calculation of maximum P release.
Maximum P released ranged from 1.2 to 6.0 mg P kg−1 in soils with low and medium available
P contents, and from 6.2–62 mg P kg−1 in soils with high available P content (Table 2). The linear
correlation analysis between P release and available P concentrations showed a high correlation
coefficient of r = 0.96**. A positive correlation also existed between maximum P release and degree
of P saturation (r = 0.91**), meaning when soil is saturated with P, most of the site for P sorption is
occupied and more P is released. Hence, there was a tendency for an increase in maximum P release
with an increase in P availability, along with increased risk of P run-off to the environment in high
available P soils. Although soil P testing alone will not answer all questions about P loss, as the
potential P loss depends on run-off potential and management practices at the site, these relationships,
however, can provide scientific bases for establishing preliminary soil tests for P criteria to identify the
P leaching potential. Testing can be combined with site hydrology and P management practices for a
more comprehensive P loss risk assessment [24].4.4. Phosphorus Release and Correlation
Phosphorus released from soil reached a maximum content at an extraction ratio of 1:240 for
soil/water (Figure 2). There were some soil types with high available P content that also released high
amounts of P at the extraction ratios of 1:60 and 1:120, however the differences were not statistically
significant (p 2020,
Agriculture < 0.05) compared to the 1:240 extraction ratio; therefore, P release values at 1 h for the7 of 11
10, 87
1:240 ratio were selected for the calculation of maximum P release.
Figure 2. Phosphorus release over time at different extraction rates in surveyed soils. Note: Sample 1,
sample 2, sample 3, sample 4, sample 5, and sample 6 have available P concentrations (mg k−1 soil Bray
1 P) of 13.1, 15.0, 54.1, 92.4, 105, and 120 mg k−1 , respectively.
4.5. Corn Responses to P Fertilizer
4.5.1. Greenhouse Experiment
Figure 3 shows the corn response to P fertilizer from two (2) consecutive crops in the greenhouse
experiment on soils from Thot Not (Can Tho province), Cho Moi (An Giang province), Binh Tan (Vinh
Long province), and Chau Thanh (Tra Vinh province). Results showed that there were no statistically
significant differences in corn yield between 90 kg P2 O5 ha−1 treatments and the zero P treatment (that
is, the control) for all four studied sites. Although there were many more positive yield responses
than no or negative yield responses, a general trend for lower yield response in high available P soils
was observed. Because application of P fertilizer in soils of medium and high P available content did
not result in a statistically significant increase in corn yield, reduction of P fertilizer use in these soils
should be considered, especially where farmers have continually applied high rates of P fertilizer.Agriculture 2020, 10, 87 8 of 11
Thot Not, Can Tho Cho Moi, An Giang
First crop
Second crop
3.0
3.0
2.0 2.0
Yield of Difference, PPlus Minus Pzero (mg/plant).
1.0 1.0
0.0 0.0
0 20 40 60 80 100 120 140 0 20 40 60 80 100
-1.0 -1.0
A B
Binh Tan, Vinh Long Chau Thanh, Tra Vinh
3.0 3.0
2.0 2.0
1.0 1.0
0.0 0.0
0 20 40 60 80 100 0 20 40 60 80 100 120 140 160 180 200 220 240
-1.0 -1.0
C D
Figure 3. Baby corn yield differences (greenhouse experiment) grown in soils with different levels of
initial Bray 1 available P, either unfertilized or fertilized at 90 kg P2 O5 ha−1 . Sample of subfigure (A)
have Initial available P concentrations (mg k−1 soil Bray 1 P) of 13, 15, 29, 37, 54, 62, 82, 105 and 120 mg
kg−1 , respectively. Sample of subfigure (B) have Initial available P concentrations (mg k−1 soil Bray 1 P)
of 6, 8, 7.3, 16, 21, 32, 36, 47, 51, 57 and 87 mg kg−1 , respectively. Sample of subfigure (C) have Initial
available P concentrations (mg k–1 soil Bray 1 P) of 5.7, 8.4, 11, 15, 20, 33, 35, 145, 56 and 77 mg kg−1 ,
respectively. Sample of subfigure (D) have Initial available P concentrations (mg k−1 soil Bray 1 P) of
13, 17, 26, 38, 49, 53, 140, 127, 202 and 224 mg kg−1 , respectively.
4.5.2. Field Experiment
Results in Figure 4 show that there was no statistically significant difference in corn yield among
zero P fertilizer treatments (7.6 t ha−1 ), 45 kg P2 O5 ha−1 treatments (8.4 t ha−1 ) and 90 kg P2 O5 ha−1
treatments (8.7 t ha−1 ) at site 1 (available P in soil was 20.5 mg P kg−1 ), and among zero P fertilizer
treatment (5.9 t ha−1 ), 45 kg P2 O5 ha−1 treatments (5.2 t ha−1 ), and 90 kg P2 O5 ha−1 treatments (5.5 t ha−1 )
at site 2 (available P in soil was 15.1 mg P kg−1 ) for the first growing season. In the second crop, similar
results were obtained when no yield response was found at sites 1 and 2. Wortmann et al. [10] reported
no increase in yield of sorghum in high phosphorus soil (>15 mg P kg−1 Bray 1), and a crop growth
response to P fertilizer but no yield response observed in soils with medium to low available P contents
(80%)
of grain yield increase with starter P fertilizer for no-till corn in soils with Bray 1 available P ≤ 15 mg
kg−1 , and that yield increase was lower in higher P soils.at site 2 (available P in soil was 15.1 mg P kg–1) for the first growing season. In the second crop, similar
results were obtained when no yield response was found at sites 1 and 2. Wortmann et al. [10]
reported no increase in yield of sorghum in high phosphorus soil ( > 15 mg P kg–1 Bray 1), and a crop
growth response to P fertilizer but no yield response observed in soils with medium to low available
P contents (< 15 mg P kg–1). For corn plant, Wortmann et al. [10] observed that there is a high
Agriculture 2020, 10, 87 9 of 11
probability (> 80%) of grain yield increase with starter P fertilizer for no-till corn in soils with Bray 1
available P ≤ 15 mg kg-1, and that yield increase was lower in higher P soils.
10.0 Sweet corn of first crop Sweet corn of second crop
8.4 8.7 0
7.6 45 10.0 8.5 8.8 8.8 7.6 7.7 8,1b
8,7a
8.0 8,0b
90 6.9
Grain yield (t.ha-1)
5.9 5.5 8.0
Grain yield (t.ha-1)
6.0 5.2
6.0
4.0
4.0
2.0 2.0
0.0 0.0
Site 1 Site 2 Site 1 Site 2 Site 3
Figure 4.
Figure Corn yield
4. Corn yield at
at treatments
treatments of of 0.45
0.45 and
and 90
90 kg
kg P22O
O55in
inthree
three(3)
(3) studied
studied sites
sites at
at Cho
Cho Moi
Moi (An
(An
Giang province).
Giang province).Sites
Sites1,1,2,2,and
and 3 had
3 had initial
initial available
available P concentrations
P concentrations (mg/kg
(mg/kg soil)soil) of 15,
of 21, 21, and
15, and
6.8
6.8 mg P kg −1 respectively.
mg P kg respectively.
−1
In our study, when soils with poor available P contents (6.8 mg P kg−1 ) were treated with 90 kg
P2 O5 ha−1 , corn yield increased (8.7 t ha−1 ) in comparison to the zero P fertilizer treatment of 8.01 t ha−1 .
Low yield was obtained from soil treated with 45 kg P2 O5 ha−1 (8.0 t ha−1 ) and this yield was not
statistically different from the zero P fertilizer treatments. Thus, it seems if soils from this region
of Vietnam are deficient in P, at least a 90 kg P2 O5 ha−1 treatment is needed to increase crop yield,
however with medium to high Bray 1 available P contents (from 15 to > 20 mg P kg−1 ), P fertilization
is not advised. This result is in line with other reports [29–32].
5. Conclusions
Regarding fluvisols, gleysols, and arenosols in major vegetable growing areas of the Mekong
Delta, Vietnam, where most of the farmers applied P fertilizer at high rates, 57% of the studied samples
> 560 mg P kg−1 were considered rich in P. Available P in 74% of the soil samples was > 20 mg P kg−1 ,
which were classified as rich in available P.
Maximum P sorption ranged from 149 to 555 mg P kg−1 soil and was negatively correlated to
available P (–0.63*). The degree of P saturation remained low, ranging from 0.63% to 5.5%, which was
correlated with available P (r =0.98**), while maximum P release ranged from 1.2 to 62 mg P kg−1 soil
and was also correlated with available P (r = 0.96**). In high available P soil, the degree of P saturation
increased with decreasing P sorption and an increase in P release; hence, the risk of P leaching to
the environment will increase if P fertilizer is applied continuously at a high rate, which should be
considered for sustainable development.
In addition, corn yield did not significantly increase (p < 0.05) in soils where Bray 1 available P
concentrations were > 15 mg P kg−1 . Therefore, it is advised not to apply P at reduced rates in these
soils. In soils with low Bray 1 P (Agriculture 2020, 10, 87 10 of 11
Acknowledgments: The authors wish to express their profound gratitude to Soil Science Department, College of
Agriculture, Can Tho University, and Department of Agriculture and Rural Development of An Giang province
for support rendered in the course of this research.
Conflicts of Interest: The authors declare that they have no conflict of interest.
References
1. Sharpley, A.N.; Daniel, T.C.; Edwards, D.R. Phosphorus movement in the landscape. J. Prod. Agric. 1993, 6,
492–500. [CrossRef]
2. Sims, T.J.; Sharpley, A.N. Phosphorus: Agriculture and the Environment; Amer: Madison, WI, USA, 2005; Agron.
Monograph No. 49.
3. Delgado, A.; Scalenghe, R. Aspects of phosphorus transfer in Europe. J. Plant Nutr. Soil Sci. 2008, 171,
552–575. [CrossRef]
4. Argus Media. Phosphates Analysis: Vietnam DAP Import Duty Situation and Likely Market Impact.
Available online: https://argusmedia.com/-/media/Files/white-papers/phosphates-analysis-vietnam-dap.
ashx (accessed on 20 September 2019).
5. Ketterings, Q.M.; Kahbka, J.E.; Reid, W.R. Trends in phosphorus fertility in New York agricultural land. J.
Soil Water Conserve 2005, 60, 10–20. [CrossRef]
6. Wortmann, C.S.; Xerida, S.A.; Mamo, M. No-till row crop response to starter fertilizer in eastern Nebraska: II.
Rainfed grain sorghum. Agron. J. 2006, 98, 187–193. [CrossRef]
7. Cahill, S.; Johnson, A.; Osmond, D.; Hardy, D. Response of corn and cotton to starter phosphorus on soil
testing very high in phosphorus. Agron. J. 2008, 100, 537–542. [CrossRef]
8. Cong, P.T.; Roel, M.; Sat, C.D.; Chon, N.Q.; Binh, N.D. Final Report 2000–2005 to Enrich Phosphorus of Soil in
Southeast and Tay Nguyen; Ho Chi Minh Publishers: Ho Chi Minh, Vietnam, 2005; pp. 26–31.
9. Hoa, N.M.; Minh, D.M. Surveying the physical-chemical properties and biological land intensive vegetable
growing areas Than Cuu Nghia commune, Chau Thanh district, Tien Giang province. J. Soil Sci. Vietnam
2006, 27, 155–158.
10. Wortmann, C.S.; Xerinda, S.A.; Mamo, M.; Shapiro, C.A. No-Till Row Crop Response to Starter Fertilizer in
Eastern Nebraska: I. Irrigated and Rainfed Corn. Agron. J. 2006, 98, 156–162. [CrossRef]
11. Allen, B.L.; Mallarino, A.P. Relationships between extractable soil phosphorus and phosphorus saturation
after long-term fertilizer or manure application. Soil Sci. Soc. Am. J. 2006, 70, 454–463. [CrossRef]
12. Food and Agriculture Organization of the United Nations. World Reference Base for Soil Resources 2014.
International Soil Classification System for Naming Soils and Creating Legends for Soil Maps; Food and Agriculture
Organization of the United Nations Viale delle Terme di Caracalla: Rome, Italy, 2015; ISBN 978-92-5-108370-3.
13. Page, A.L.; Miller, R.H.; Keeney, D.R. Part 2—Chemical and microbiological properties. In Method of
Soil Analysis; American Society of Agronomy, Soil Science Society of America: Madison, WI, USA, 1982;
pp. 403–430.
14. Thuy, P.T.P. Phosphorus Supplying Capacity on Some Major Vegetable Growing Areas in the Mekong Delta.
Ph.D. Thesis, Can Tho University, Can Tho, Vietnam, 2015; pp. 38–39.
15. Can, L.V. Agricultural Curriculum; Agricultural Publisher: Hanoi, Vietnam, 1978; pp. 14–25.
16. Houba, V.J.G.; Lee, V.D.; Novozamsky, J.J. Soil and Plant Analysis; Department of Soil science and Plant
nutrition, Wageningen Agricultural University: Wageningen, The Netherlands, 1995.
17. Schoumans, O.F.; Mol-Dijkstra, J.P.; Roest, C.W.J. Agricultural and Enviromental Methodologies to Describe
Nonpoint Source Phosphorus Pollution; Alterra, Wageningen University and Research Centre: Wageningen,
The Netherlands, 2002; Volume 47, pp. 207–211.
18. Sui, Y.; Thompson, M.L. Phosphorus sorption, desorption, and buffering capacity in a biosolids—Amended
mollisol. Published in Soil Science. Soc. Am. J. 2000, 64, 164–169. [CrossRef]
19. Ministry of Agriculture and Rural Development Vietnam. National Technical Regulation on Testing for
Value of Cultivation and Use of Maize Varieties. 2011. Available online: http://vbpl.vn/FileData/TW/Lists/
vbpq/Attachments/26746/VanBanGoc_48_2011_TT-BNNPTNT.pdf (accessed on 20 August 2011).
20. Debusk, W.F.; Newman, S.; Reddy, K.R. Spatial-temporal patterns of soil phosphorus enrichment in Everglades
water conservation area 2A. J. Environ. Qual. 2001, 30, 1438–1446. [CrossRef] [PubMed]
21. Can, L.V. Using Phosphate Fertilizers South Vietnam; Agricultural Publisher: Hanoi, Vietnam, 1985; pp. 14–36.Agriculture 2020, 10, 87 11 of 11
22. Castro, B.; Torren, T.J. Phosphate sorption by calcareous Vertisols and Inceptisols as evaluated from extended
P-sorption curves. Eur. J. Soil Sci. 1998, 49, 661–667. [CrossRef]
23. Saavedra, C.; Delgado, A. Phosphorus fractions and release patterns in typical Mediterranean soils. Soil Sci.
Soc. Am. J. 2005, 69, 607–615. [CrossRef]
24. Wang, Y.T.; Zhang, T.Q.; O’Halloran, I.P.; Tan, C.S.; Hu, Q.C.; Reid, D.K. Soil Tests as Risk Indicators for
Leaching of Dissolved Phosphorus from Agricultural Soils in Ontario. Soil Sci. Soc. Am. J. 2012, 76, 220–229.
[CrossRef]
25. Villapando, R.R.; Graetz, D.A. Phosphous sorption and sorption properties of the Spodic Horizon from
selected Florida Spodosols. Soil Sci. Soc. Am. J. 2001, 65, 331–339. [CrossRef]
26. Van der Zee, S.E.A.T.M.; Van Riemsdijk, W.H.; de flaan, F.A.M. Protocol fosfaatverzdigde gronden. Deel I en
II (Phosphate saturated soil protocol. Part I and II (In Dutch); Department of Soil Science and Plant Nutrition,
Agricultural University: Wageningen, The Netherlands, 1990.
27. Schoumans, O.F.; Chardon, W.J. Phosphate saturation degree and accumulation of phosphate in various soil
types in The Netherlands. Geoderma 2015, 237, 325–335. [CrossRef]
28. Zhou, M.; Li, Y. Phosphorus-sorption characteristic of Calcareous Soils and Limestone from the Southern
Everglades and Adjacent Farmlands. Soil Science Society. Published in Soil Sci. Soc. Am. J. 2001, 65,
1404–1412. [CrossRef]
29. Matar, A.E.; Garabed, S.; Riahi, S.; Mazid, A. A comparison of four soil test procedures for determination of
available phosphorus in calcareous soils of the Mediterranean region. Commun. Soil Sci. Plant Anal. 1988, 19,
127–140. [CrossRef]
30. Ryan, J.; Matar, A. Fertilizer use efficiency under rainfed agriculture. In Proceedings of the Fourth Regional Soil
Test Calibration Workshop, Agadir, Morocco, 5–11 May 1991; International Center for Agricultural Research in
the Dry Areas: Aleppo, Syria, 1991.
31. Ryan, J. Accomplishments and future challenges in dryland soil fertility research in the Mediterranean
area. In Proceedings of the International Soil Fertility Workshop, 19–23 November 1997; International Center for
Agricultural Research in the Dry Areas: Aleppo, Syria, 1997.
32. Ryan, J.; Matar, A. Soil Test Calibration in West Asia and North Africa. In Proceedings of the Third Regional Soil
Test Calibration Workshop, Amman, Jordan, 2–9 September 1990; International Center for Agricultural Research
in the Dry Areas: Aleppo, Syria, 1990.
© 2020 by the authors. Licensee MDPI, Basel, Switzerland. This article is an open access
article distributed under the terms and conditions of the Creative Commons Attribution
(CC BY) license (http://creativecommons.org/licenses/by/4.0/).You can also read