Region of Peel Community Data Summary - Century Gardens & South Fletcher's Study Areas, City of Brampton - eSCRIBE
←
→
Page content transcription
If your browser does not render page correctly, please read the page content below
Appendix II
 Community Data Summary Report

Region of Peel
Community Data
Summary
Century Gardens & South Fletcher’s Study Areas,
City of Brampton

 February 2020

                                 11.1-10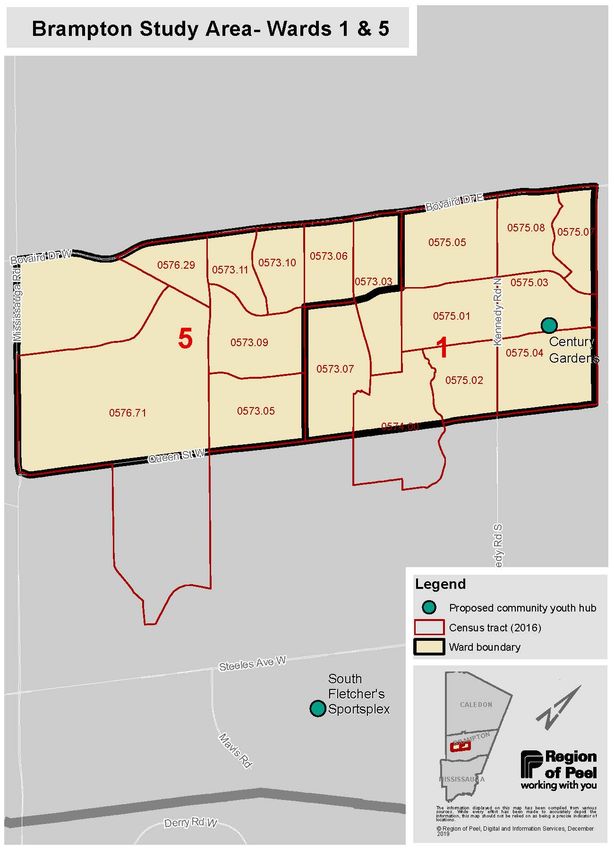
Appendix II
     Community Data Summary Report

Table of Contents

Summary ............................................................................................................................... 3-4

Community Data Summary Themes .................................................................................. 5-7

Introduction...............................................................................................................................8
      City of Brampton
      Community Hubs

Neighbourhood Information Tool Well-being Index Scores ........................................... 9-12

Study Area Based Community Data
      1. Socio-Demographic Information ......................................................................... 13-18
      2. Economic Opportunity ........................................................................................ 19-21
      3. Community Belonging and Resident Engagement ................................................... 22
      4. Safety ....................................................................................................................... 23
      5. Health ................................................................................................................. 24-28
      6. Physical Environment ......................................................................................... 29-30

Community Consultation Input ...........................................................................................................31-33

Conclusion ............................................................................................................................. 34

Appendices:
Appendix I: Methodology/Data Limitations and Literature Sources .................................. 35-36
Appendix II: Organizations and Groups Serving Study Areas ........................................... 37-45
Appendix III: Stakeholder Survey Questions ..................................................................... 46-47
Appendix IV: Glossary of Terms .............................................................................................. 48

                                                                11.1-11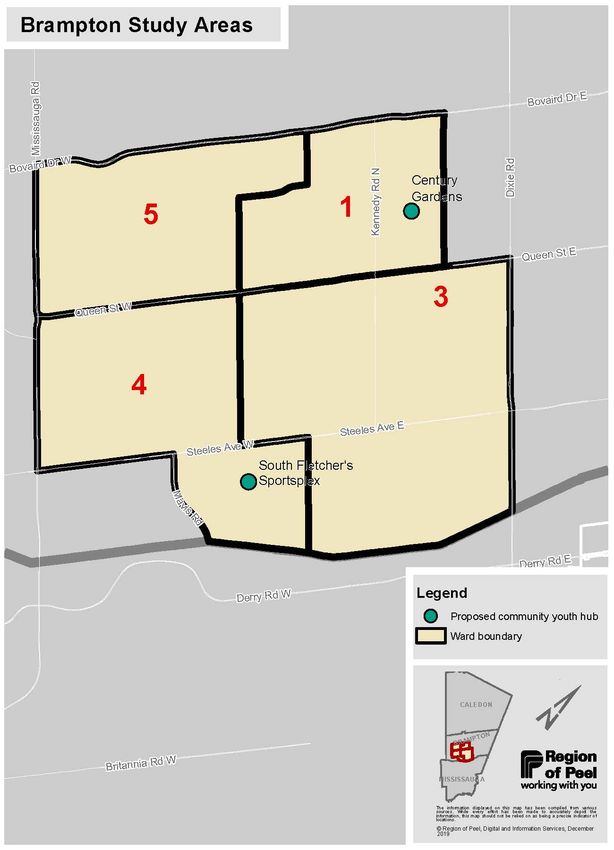
Appendix II
    Community Data Summary Report

Summary
On November 14, 2019, the City of Brampton presented an overview of the Brampton
Community Youth Hubs Feasibility Study to Peel Regional Council. Ultimately the proposed
Hubs will be used as youth-centric spaces designed to ensure a one-stop-shop for youth (ages
14-29 years). The hubs would enable youth to access health care services, social services,
education, employment and career services and youth leadership opportunities. As a result of
the presentation, Regional Council directed staff to complete a needs study, similar in format to
the one conducted for the Malton Community Hub.

The Region of Peel’s Community Hub Planning Framework identifies the value of
understanding the evidence-informed needs of a community as a standard for sustainable hub
development. The purpose of this report is to provide information and a needs analysis of
communities within the City of Brampton and the areas surrounding the two proposed
community youth hub locations. Staff consulted with the City of Brampton and identified the
Wards and Census Tracts to determine the geographical scope of the analysis; this report
refers to the respective catchment areas as study areas. The two study areas are the Century
Gardens Study Area that includes Ward 1, which is the location of the vacant Lawn Bowling
Clubhouse, and adjacent Ward 5. The second is the South Fletcher’s Study Area that includes
Ward 4, the location of the South Fletcher’s Sportsplex, and adjacent Ward 3.

                                                     11.1-12
Region of Peel Community Data Summary | Century Gardens & South Fletcher’s Study Areas, City of Brampton   3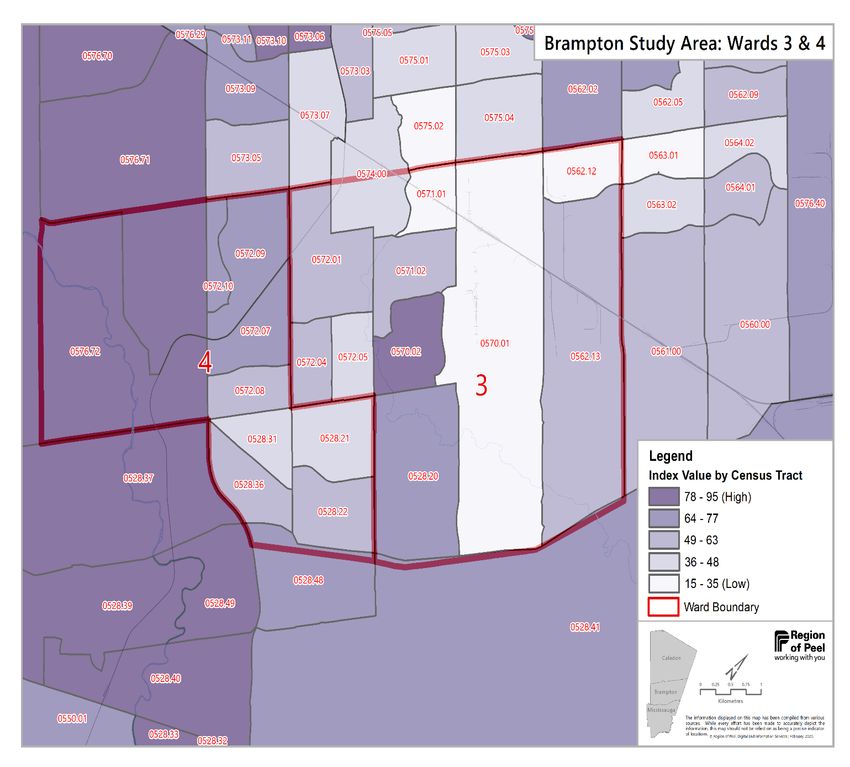
Appendix II
    Community Data Summary Report

A mixed-method approach was used in the study areas with qualitative data collected from
youth, agencies and other community members to highlight local priorities. Quantitative data
and literature were collected from multiple sources including:

     •   Peel Public Health
     •   City of Brampton
     •   Peel District School Board
     •   Statistics Canada Census Tract
     •   Stakeholder Survey
     •   Community Validation meeting

The Neighbourhood Information Tool, with six domains and twenty-one indicators, was the
main data source and laid the foundation for the review and analysis. Youth data from across
Brampton is also included in the analysis as youth outside the study areas may also access
the proposed community hubs.

In undertaking this needs analysis, Region of Peel staff committed to:

    •    Identify and review the best available quantitative and qualitative data and existing
         information to provide an overview of the City of Brampton evidence-informed needs
         and a comprehensive picture of both study areas
    •    Identify key themes that could inform planning by the Region of Peel, City of Brampton
         and community stakeholders

                                                     11.1-13
Region of Peel Community Data Summary | Century Gardens & South Fletcher’s Study Areas, City of Brampton   4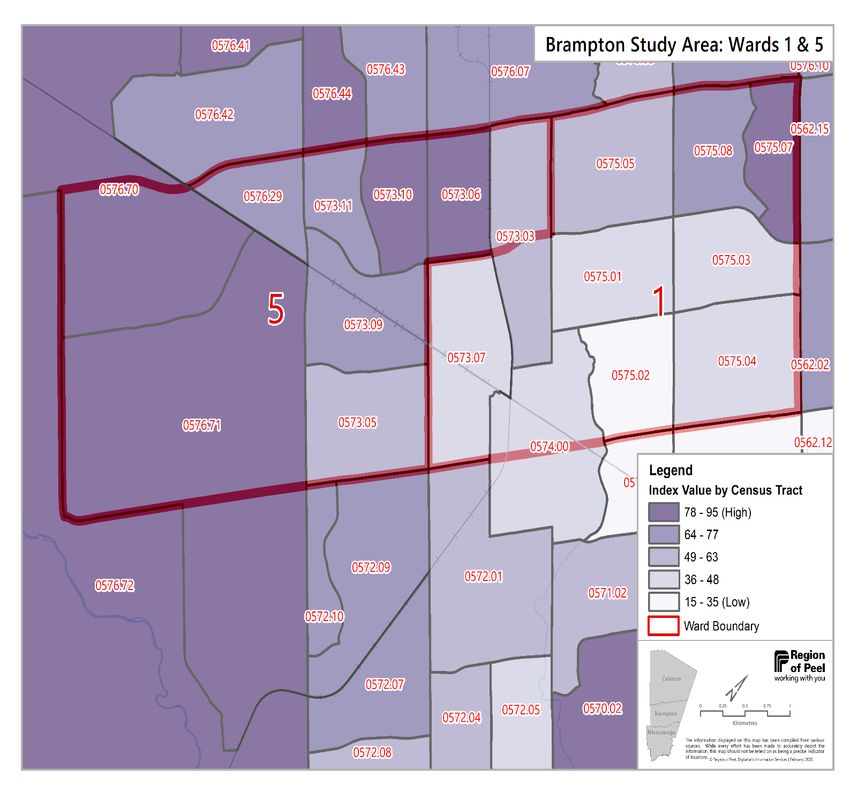
Appendix II
    Community Data Summary Report

Community Data Summary Report Themes
South Fletcher’s and Century Gardens Study Areas
Across the quantitative and qualitative data, consistent areas of youth needs were identified
specific to economic opportunity, safety, health, resident engagement and community
belonging. To achieve a greater understanding of the specific program and service needs,
community consultations (stakeholder survey, community data validation meeting) were
completed, and findings are noted in the following table.

                                                                                    Community
     Themes                                 Data
                                                                                 Consultation Input

 Employment               • High percentage of youth                       • Identified need for greater
 Opportunity                unemployment (Century                            access to education and
                            Gardens 20.4%, South                             training programs including
                            Fletcher’s 20.2%), similar to the                mentorship and
                            City of Brampton (20.3%) and                     apprenticeships
                            Peel Region (19.7%)

                          • Slightly higher unemployment rate • Increased local
                            (Century Gardens 6.6%, South        employment opportunities
                            Fletcher’s 6.9%) than the City of   that pay a living wage
                            Brampton (6.3%) and Peel
                            Region (6.2%)

                          • Sizable percentage of households • Identified affordable
                            experiencing high household        housing and access to
                            shelter costs (Century Gardens     foodbanks as high
                            33.5%, South Fletcher’s 35.4%),    priorities
                            similar to the City of Brampton
                            (33.6%) and in the range of Peel
                            Region (31.8%)

                          • Large number of individuals      • Identified need for
                            experiencing low-income (Century   considerations during the
                            Gardens 11.8%, South Fletcher’s    redevelopment of areas
                            15.2%) compared to the City of     such as Shoppers World
                            Brampton (11.3%) and Peel          and Hurontario LRT,
                            Region (12.8%)                     related to youth
                                                               employment, transit and
                                                               housing

                                                     11.1-14
Region of Peel Community Data Summary | Century Gardens & South Fletcher’s Study Areas, City of Brampton   5
Appendix II
Community Data Summary Report
Community
Themes Data
Consultation Input
Safety • Of the 5,283 crime activities • Perception of increased
across the City of Brampton, crime (e.g. human sex
Century Gardens had 1,002 or trafficking, gang-related
18.9% and South Fletcher’s had activities and youth drug
1,330 or 25.2% use) across all socio-
demographics and income
levels
• Increased supports for
international students who
are often isolated
• Need for supportive and safe
spaces that provide a non-
judgmental approach
Health • South Fletcher’s study area • Youth are often unable to
has health and well-being afford recreation programs
concerns related to obesity
(64.6%), physical inactivity • Need for more mental health
(63.1%), healthy eating supports to deal with stress,
(63.6%), smoking (22.1%) and depression, anxiety, family
alcohol consumption (17.8%) issues and substance abuse
• The Early Development Index • Common acknowledgement
identified the Physical Health of how technology can
and Well-being domain the contribute to social isolation
area of most vulnerability.
(Century Gardens 16.4%,
South Fletcher’s 18.8%)
• Both study areas have
considerable socioeconomic
vulnerability of students in local
public schools. Note:
additional information appears
later in the report under the
“Socioeconomic Vulnerability
Index”.
11.1-15
Region of Peel Community Data Summary | Century Gardens & South Fletcher’s Study Areas, City of Brampton 6Appendix II
Community Data Summary Report
Community
Themes Data
Consultation Input
Resident • Residents (12+ years) reported • Increased desire for youth to
Engagement their sense of belonging to their have a voice and be heard
and community, as follows: Century
Community Gardens 31%, South Fletcher’s • Need for a dedicated space
Belonging 34%, compared to the City of that supports tailored
Brampton (31.9%) and Peel interventions and strategies
Region (32.6%). for all youth with varying
needs and interests
• Recreation program usage in the
South Fletcher’s study area is • Brampton youth are travelling
less (Ward 3 – 17.41%, Ward 4- outside of Brampton for
18.65%) than Century Gardens entertainment and community
(Ward 1 – 17.55%, Ward 5- participation
19.86%) and the City of Brampton
(19.76%). • Community stakeholders
expressed value in a “system
navigator” role to assist youth
and youth serving agencies
in connecting with social and
health supports
The Community Data Summary confirms that within both study areas, youth are experiencing
multiple challenges with insufficient access to supports. Given the high demand for youth
social and health services across Brampton, it is anticipated that youth outside of the study
areas would also access community hub services.
Planning Considerations
As resident needs, engagement and participation are not limited to the defined study area
boundaries used within the Community Data Summary, community stakeholders expressed
the importance of intentional engagement and inclusion of equity-seeking groups such as
LGBTQ and racialized (visible minority) communities in future planning.
11.1-16
Region of Peel Community Data Summary | Century Gardens & South Fletcher’s Study Areas, City of Brampton 7Appendix II
Community Data Summary Report
Introduction
City of Brampton
The City of Brampton is home to a very diverse and rapidly growing population. It is the ninth
largest municipality in Canada with a population of 593,640 (2016 Census). From 2011 to
2016, Brampton’s population increased by 13.3%; a substantial increase greater than the rate
of Ontario at 4.6%, and the rate of Toronto at 6.2%. The City also has the youngest average
population of 36.5 years compared to 38.3 years for Peel Region.
In addition to this, over 52% of City of Brampton residents are immigrants and over 73% of the
City of Brampton’s population identify as visible minorities (2016 Census). The City’s
demographics have influenced planning through the City of Brampton’s 2040 Vision strategic
plan, Youth Engagement Strategy and designation as a Youth Friendly Community. These are
both important factors that make up Brampton’s unique social fabric which is important to
acknowledge during the planning process.
In 2017, the City of Brampton endorsed its Parks and Recreation Master Plan including
proposed community youth hubs. In addition, the City has undertaken several initiatives to
engage youth; including the 2016 Youth Engagement Survey. Respondents underscored the
need for public safety and accessible space for youth to “hang out” as well as access
programs and services related to health care, social services, education and employment. The
Youth Engagement Strategy endorsed by the City in 2019 aims to create practical avenues for
young people to participate in their community and improve access to the City of Brampton’s
youth programs, opportunities and initiatives.
As outlined in the City of Brampton’s Community Youth Hub Feasibility Study, several factors
were used to determine the locations for their proposed community youth hubs:
• Use of existing underutilized City-owned assets
• Neighbourhood Information Tool Well-Being Index Score
• Neighbourhoods with a higher percentage of Low-Income households
• Transit accessibility
• Adjacency to existing City assets
Region of Peel, Community Hubs Planning Framework
The Region of Peel’s Community Hub Planning Framework outlines the Region’s role in
supporting the development of integrated hubs in Peel, by collaborating with community
agencies to achieve a standard for sustainable development and identifying innovative service
models aligned with Regional service plans. The Framework is based on the following
standards:
• Understanding the evidence-informed needs of the community
• Developing strong partnerships with shared vision, priorities and outcomes
• Strong business planning that includes established governance, financial models
and a mixture of services
• Integrated service delivery that builds upon the resources and expertise of the
partners
11.1-17
Region of Peel Community Data Summary | Century Gardens & South Fletcher’s Study Areas, City of Brampton 8Appendix II
Community Data Summary Report
Neighbourhood Information Tool: Well-being Index Scores
Peel's Neighbourhood Information Tool (NIT) is an important starting point for understanding
Peel’s neighbourhoods. The NIT was designed to assist with evidence-informed decisions
about the types of support, resources and investments needed in neighbourhoods. It is
important to note, that the NIT does not capture all of the nuances and issues in
neighbourhoods. This type of qualitative information should be gathered in consultation with
community stakeholders and residents. The NIT is a snapshot in time; currently the majority of
indicators reflect the 2016 Statistic Canada Census data.
The Neighbourhood Information Tool assesses census tracts across six domains and twenty-
one indicators, which are combined to create a well-being index score. Index scores represent
the measure of "well-being" for each neighbourhood (census tract) 1. Lower well-being index
scores are a high-level indication of areas that may require more targeted supports to improve
neighbourhood conditions.
1
Neighbourhood Information Tool calculates well-being index score using census tracts, which is referred to as
neighbourhoods in this section of the report.
11.1-18
Region of Peel Community Data Summary | Century Gardens & South Fletcher’s Study Areas, City of Brampton 9Appendix II
Community Data Summary Report
City of Brampton
Neighbourhood Well-being Index Scores
To identify neighbourhoods of greatest need, all 98 census tracts within the City of Brampton
were reviewed. Based on the NIT, five neighbourhoods have a low well-being index score (15
to 22) and twelve neighbourhoods have a low/moderate well-being index score (37 to 48).
The City of Brampton well-being index score map displays a concentration of low and
low/moderate neighbourhoods, two of which are within the South Fletcher’s and Century
Gardens study areas. Of note, Wards 7 and 8 also have a concentration of low well-being.
Low and low/moderate well-being is displayed by the lightest shading on the map.
City of Brampton
Neighbourhood Information Tool Well-being Score Map
Note: Dark Shading = a high well-being index score
Light Shading = a low well-being index score
High Well-being
Low Well-being
11.1-19
Region of Peel Community Data Summary | Century Gardens & South Fletcher’s Study Areas, City of Brampton 10Appendix II
Community Data Summary Report
Century Gardens Well-being Index Scores:
The Century Gardens study area is based on the boundaries of Ward 1 and 5, which includes
nineteen census tracts in total. Of these, six neighbourhoods have low to low/moderate well-
being.
Ward 1 and 5:
Neighbourhood Information Tool Well-being Index Score Map
Note: Dark Shading = a high well-being index score
Light Shading = a low well-being index score
Century
Gardens
High Well-being
Low Well-being
11.1-20
Region of Peel Community Data Summary | Century Gardens & South Fletcher’s Study Areas, City of Brampton 11Appendix II
Community Data Summary Report
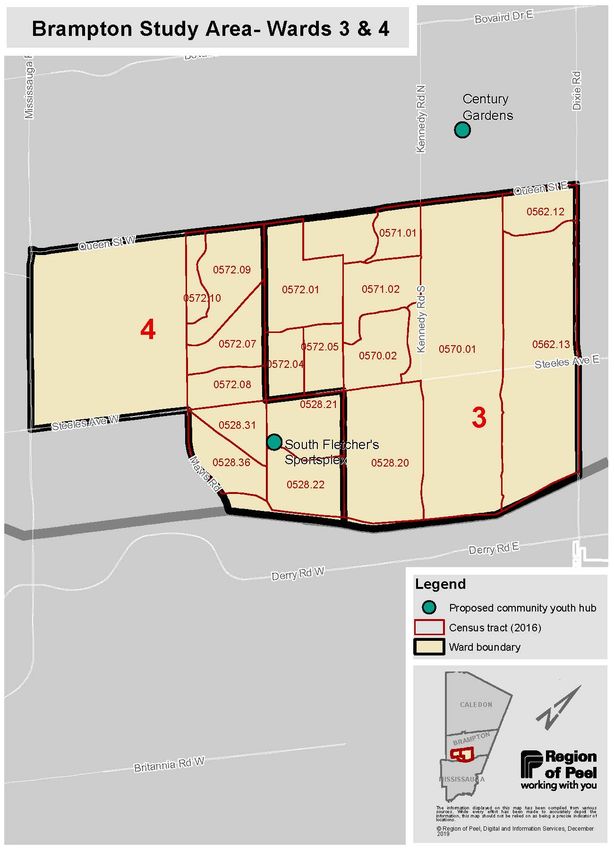
South Fletcher’s Well-being Index Scores:
The South Fletcher’s study area is based on the boundaries of Ward 3 and 4, which includes
twenty-one census tracts in total, of which seven neighbourhoods have low to low/moderate
well-being.
Ward 3 and 4:
Neighbourhood Information Tool Well-being Index Score Map
Note: Dark Shading = a high well-being index score
Light Shading = a low well-being index score
South
Fletcher’s
Sportsplex High Well-being
Low Well-being
11.1-21
Region of Peel Community Data Summary | Century Gardens & South Fletcher’s Study Areas, City of Brampton 12Appendix II
Community Data Summary Report
Study Area Based Community Data
1. Socio-Demographic Information
Socio-Demographic information includes population information such as age, immigration, and
ethnicity gathered through Statistics Canada.
City of Brampton:
QUICK FACTS…. The City of Brampton is one of the fastest-growing populations
within the Greater Toronto Area. The child/youth population (0 to
19 years) accounts for 27.6% and youth (20 to 29 years)
While most of the represents 13.9% of Brampton’s total population. This is higher
surrounding than Peel in both age groups (0-19 years, 25.3% and 20 to 29
municipalities have seen years, 13.8%).
a decrease in the growth
of the child/youth The chart below highlights some of the key population data. In
population, Brampton addition to the high child/youth population, it should be noted that
has experienced Brampton also contains a high immigrant population (52.3%) and
consistent growth. visible minority population (73.3%) in comparison to the Peel
Region’s immigration population (51.5%) and visible minority
_________________ population (62.3 %).
Population
“A character that sets
Brampton positively City of Peel
apart from other Brampton Region
municipalities in the Total Population 593,640 1,381,740
region, is its rich range of
multiculturalism and Children (0 to 14 years) 120,240 20.3% 18.3%
lifestyles”. Youth (15 to 19 years) 42,820 7.2% 7.0%
From City of Brampton 2040
Vision Youth (20 to 24 years) 42,800 7.2% 7.3%
Youth (25 to 29 years) 40,200 6.8% 6.6%
Adult (30 to 64 years) 281,305 47.4% 48.0%
Seniors (65 years and over) 66,270 11.2% 12.8%
Top 5 non-official Immigrants 308,785 52.3% 51.5%
languages spoken most Recent Immigrants
39,910 6.8% 6.9%
often at home in the City (5 years or less)
of Brampton are Punjabi, Visible Minorities 433,230 73.3% 62.3%
Urdu, Gujarati, Tamil
Lone-parent Families 28,565 17.4% 17%
and Hindi.
Mobility Status* 13.25% 12.1%
Source: Statistics Canada Census Data 2016
*NOTE: Mobility Status: Proportion of population who have moved residences within the past year.
11.1-22
Region of Peel Community Data Summary | Century Gardens & South Fletcher’s Study Areas, City of Brampton 13Appendix II
Community Data Summary Report
Brampton Study Areas Socio-Demographic Information:
Century Gardens Study Area Socio-Demographic Information
The Century Gardens study area was defined in consultation with City of Brampton staff, it
includes Wards 1 and 5 for the purpose of data and information collected within this report.
The proposed community youth hub location is the vacated Lawn Bowling Clubhouse located
at 340 Vodden Street East, Brampton in Ward 1.
*NOTE: census tract data geography is different than wards, census tracts can cross ward boundaries.
All census tracts that are part of a ward have been included in the report.
11.1-23
Region of Peel Community Data Summary | Century Gardens & South Fletcher’s Study Areas, City of Brampton 14Appendix II
Community Data Summary Report
Century Gardens Study Area Socio-Demographic Information
Total Population: 107,675
Child-Youth Population: Similar to the City of Brampton (27.6%), the percentage of
child/youth (0 to 19 years) is 27.1% or 29,240. The child-youth population is higher in Peel
Region (25.5%). Older youth (age 20 to 29 years) represents 13.4% of the population.
Senior Population: The population of seniors (65 years plus) that reside within this study area
is 11,550 (10.7%), in the range of the City of Brampton’s senior population (11.2%) and lower
than the Peel Region percentage (12.8%).
Lone-parent Families: The proportion of lone-parent families within this study area is 20.4%
or 6,145. This exceeds the City of Brampton percentage (17.4%) and Peel Region (17%).
Visible Minority: The visible minority population within the study area is 70,265 or 65.3%.
This is lower that the City of Brampton population (73.3%) and in the range of Peel Region
(62.3%).
Immigration Status: There are 52,565 (48.8%) immigrants in this study area which is slightly
lower than the City of Brampton (52.3%) and Peel Region (51.5%). Of the study area’s total
immigrant population, 6,370 are recent immigrants who have been in Canada for less than five
years.
Mobility Status: The proportion of the population that have moved residences within the past
year is 13.7% in this study area, this is similar to the City of Brampton (13.2%), however
greater than Peel Region (12.1%).
11.1-24
Region of Peel Community Data Summary | Century Gardens & South Fletcher’s Study Areas, City of Brampton 15Appendix II
Community Data Summary Report
Brampton Study Areas Socio-Demographic Information:
South Fletcher’s Study Area Socio-Demographic Information
The South Fletcher’s study area was defined in consultation with City of Brampton staff, it
includes Wards 3 and 4 for the purpose of data and information collection within this report.
The proposed community youth hub location is the first floor of the South Fletchers Sportsplex
located at 500 Ray Lawson Boulevard, Brampton, within Ward 4.
*NOTE: census tract data geography is different than wards, census tracts can cross ward boundaries.
All census tracts that are part of a ward have been included in the report.
11.1-25
Region of Peel Community Data Summary | Century Gardens & South Fletcher’s Study Areas, City of Brampton 16Appendix II
Community Data Summary Report
South Fletcher’s Study Area Socio-Demographic Information
Total Population: 107,120
Child-Youth Population: This study area also has a high percentage of youth (0 to 19 years)
at 25.1% or 26,890, slightly lower than the City of Brampton (27.6%) and Peel Region (25.5%).
Older youth (age 20-29 years) represents 15.5% of the population.
Senior Population: Within this study area 13,980 (13.1%) seniors (65 years plus) reside,
greater than the City of Brampton senior population (11.2%) and Peel Region (12.8%).
Lone-parent Families: The proportion of lone-parent families within this study area is 19.3%
or 5,720, higher than the City of Brampton population percentage (17.4%) and Peel Region
(17%).
Visible Minority: The visible minority population within the study area is 75,395 or 70.4%. This
is lower than the City of Brampton population (73.3%) however higher than Peel Region
62.3%.
Immigration Status: There are 56,580 (52.8%) immigrants in this study area, higher than both
the City of Brampton (52.3%) and Peel Region (51.5%). Recent immigrants (less than five
years) totals 8,930.
Mobility Status: The proportion of the population that have moved residences within the past
year is 14.7%, which is greater than the City of Brampton (13.2%) and Peel Region (12.1%).
11.1-26
Region of Peel Community Data Summary | Century Gardens & South Fletcher’s Study Areas, City of Brampton 17Appendix II
Community Data Summary Report
Immigration Population Information:
Places of Birth by Study Area
The top place of birth across both study areas is India, however the representation within the
South Fletcher’s study area is greater. This is similar to the City of Brampton and Peel Region.
Jamaica is the second most common place of birth in both study areas which is similar to the
City of Brampton, however Pakistan is the second most common place of birth in Peel Region.
TOP PLACES OF BIRTH Top 5 non-
official
CENTURY GARDENS STUDY AREA languages
Jamaica,
5,280
spoken most
often at home in
Portugal,
3,020 Century
Gardens are
Other,
Punjabi, Urdu,
21,855 Portuguese,
Spanish and
India, Gujarati.
15,155
Philippines,
Pakistan,
3,130
4,130
TOP PLACES OF BIRTH
SOUTH FLETCHER'S STUDY AREA
Jamaica,
3,780
Portugal,
2,140
Top 5 non- Other,
official 21,180
languages
spoken most India,
23,170
often at home in
South Fletcher’s
Source:
are Punjabi, Statistics
Urdu, Hindi, Canada
Gujarati and Philippines, Census Data
Pakistan, 2016
Tamil. 2,700
3,615
11.1-27
Region of Peel Community Data Summary | Century Gardens & South Fletcher’s Study Areas, City of Brampton 18Appendix II
Community Data Summary Report
2. Economic Opportunity
Economic opportunities include data indicators for income, shelter costs, employment, and
education that contribute to the economic opportunities of an individual and community.
Prevalence of Low-Income Status by Study Area:
QUICK FACTS…. Residents who have low income or no income are some of the
most vulnerable populations; they have difficulty meeting basic
needs, which can affect their health and well-being. In the City of
Brampton, 11.3% or 66,945 individuals have a low-income status
For youth up to age 19 based on the after-tax low-income measure (LIM-AT)*. In Peel
years, 66% can find Region, the percentage is higher at 12.8%.
employment within the
City of Brampton;
however, older youth
(20-29 years) reported Prevalence of Low-Income Status
the need to travel outside
of the City for Total Number of
employment (40%). Study Population Persons In Percentage
City of Brampton, Youth Area low income
Engagement Survey
Century
107,675 12,680 11.8%
Gardens
South
107,120 16,330 15.2%
Fletcher’s
_________________
City of
590,960* 66,945 11.3%
Brampton
Peel 1,372,640* 175,980 12.8%
Important issues facing Source: Statistics Canada, Census of Canada 2016
Brampton Youth include NOTE: Low-income status is based on the after-tax low-income measure (LIM-AT)
affordable housing, food, *Low income data is derived from 25% sample Census data and therefore population
entertainment, totals here may differ from those found in other sources.
transportation and
recreation programs.
City of Brampton, Youth
Engagement Survey & South Fletcher’s study area has a greater percentage (15.2%) of
Region of Peel, Community individuals experiencing low-income compared to the Century
Consultation
Gardens (11.8%) study area. However, both study areas have a
higher percentage of individuals in low-income than the City of
Brampton (11.3%) overall and South Fletcher’s is higher than
Peel (12.8%).
11.1-28
Region of Peel Community Data Summary | Century Gardens & South Fletcher’s Study Areas, City of Brampton 19Appendix II
Community Data Summary Report
Household Income Spent on Shelter:
According to the Canada Mortgage and Housing Corporation (CMHC), housing costs are
considered affordable if they are less than 30% of a household’s pre-tax income. Both study
areas have a sizable percentage of households spending greater than 30% of their income on
shelter costs. Peel Region and the City of Brampton are similar.
Household Shelter Costs
Total
Household Spending
Owner and
Study Area (30% or more of Percentage
Tenant
income on shelter)
Households
Century Gardens
33,070 11,090 33.5%
Study Area
South Fletcher’s
33,950 12,025 35.4%
Study Area
City of Brampton 167,930 56,455 33.6%
Peel Region 429,575 136,655 31.8%
Source: Statistics Canada Census Data 2016
NOTE: Household shelter cost data is derived from 25% sample Census data and therefore totals may differ from
those found in other sources.
Unemployment Rates:
The unemployment rate measures unemployment and is expressed as a percentage of the
total labour force, which is the proportion of the population 25 years and over in the labour
force who reported that they were unemployed in the reference period. Both study areas have
a slightly higher unemployment rate than Peel Region and the City of Brampton.
Labour Force Participation & Unemployment
Total Labour Total Unemployment
Study Area
Force Unemployed Rate
Century Gardens
50,775 3,350 6.6%
Study Area
South Fletcher’s
48,370 3,335 6.9%
Study Area
City of Brampton 272,940 17,090 6.3%
Peel Region 644,480 40,200 6.2%
Source: Statistics Canada Census Data 2016
11.1-29
Region of Peel Community Data Summary | Century Gardens & South Fletcher’s Study Areas, City of Brampton 20Appendix II
Community Data Summary Report
Youth Labour Force Participation:
The number of unemployed youth ages 15 to 24 years in the City of Brampton and Peel
Region is about 20%, with both study areas having approximately the same rate.
Youth (15-24 years) Labour Force Participation
Total Labour Total Unemployment
Study Area
Force Unemployed Rate
Century Gardens
8,090 1,650 20.4%
Study Area
South Fletcher’s
8,970 1,815 20.2%
Study Area
City of Brampton 46,680 9,465 20.3%
Peel 108,620 21,425 19.7%
Source: Statistics Canada Census Data 2016
Post-Secondary Education (15 years and older):
Post-secondary education refers to those whose highest level of educational attainment is an
apprenticeship, trades certificate, diploma college, or other non-university certificate or
diploma; university certificate or diploma below bachelor level; or a university degree at any
level.
Post-Secondary Education*
Total
Total Population
Population with Percentage
Study Area with Study Percentage
Post-
Outside Canada
Secondary
Century Gardens 42,410 49.4% 15,805 18.4%
South Fletchers 45,330 51.8% 18,940 21.6%
City of Brampton 234,355 49.8% 93,630 19.9%
Peel 612,040 54.7% 239,295 21.4%
Source: Statistics Canada, Census of Canada 2016
*NOTE: 15 years and over
11.1-30
Region of Peel Community Data Summary | Century Gardens & South Fletcher’s Study Areas, City of Brampton 21Appendix II
Community Data Summary Report
3. Community Belonging and Resident Engagement
Resident engagement and community belonging refers to information about how connected
people feel to their neighbourhood.
Sense of Belonging
QUICK FACTS…. The extent to which residents feel connected in their
neighbourhood contributes to the overall well-being of an
The City of Brampton individual. According to Statistics Canada, a sense of belonging is
asked 911 youth, what highly correlated to physical and mental health, even when age,
makes them least proud socio-economic status and other factors are considered.
of Brampton, and the two
main themes that The Canadian Community Health Survey (2017) indicate that 31%
emerged were: boredom of Century Gardens residents (12+ years) self-reported a low
and a lack of sense of belonging to their community. Similarly, South Fletcher’s
entertainment followed by residents also reported a low sense of belonging to their
safety. community (34%), which is higher than the City of Brampton
City of Brampton, Youth
Engagement Survey (31.9%) and Peel Region (32.6%).
_________________ Resident Engagement
Recreation Program Usage:
There is an increase in The City of Brampton offers a variety of recreation programming,
international Students in the following chart demonstrates the proportion of population in a
both study areas registered or a member of one or more recreation programs.
attending local
educational institutions.
Youth-serving agencies
Recreation Program Usage*
expressed concern that Proportion of
these students are Study Area Ward Population Accessing
vulnerable and at greater Programs
risk of becoming victims of
1 17.55%
human trafficking, Century Gardens
experiencing social 5 19.86%
isolation and mental 3 17.41%
South Fletcher’s
illness. 4 18.65%
Region of Peel, Community
Consultation City of Brampton 19.76%
Source: City of Brampton Community Services: Recreation Division (2017)
Recreation Program Subsidies: The City of Brampton’s ActiveAssist program is a fee
subsidy program designed to help low-income families and individuals participate in recreation
programs. The program continues to grow annually; in 2019, 12,571 individuals were enrolled
in the program.
Library Usage*: Over 20% of the population across both study areas access the Library,
similar to City of Brampton (21.9%). The greatest usage is in Ward 3, within the Century
Gardens study area (23.9%) which has the Four Corners Library Branch.
*NOTE: Recreation and Library comparative data is not available for Peel Region, as programs vary across municipalities.
11.1-31
Region of Peel Community Data Summary | Century Gardens & South Fletcher’s Study Areas, City of Brampton 22Appendix II
Community Data Summary Report
4. Safety
Safety refers to criminal activity within the study areas. Resident perceptions of safety in their
community is also an important indicator of community well-being and vitality.
QUICK FACTS….
Crime Activity (2019) *
Percentage
Per
In 2019, the City of Study Total of
Population Capita
Brampton established the Area Crimes Brampton
(per 100)
Brampton Community Crimes
Safety Advisory Century
Committee, which includes 107,675 1,002 18.9% .93
Gardens
strong representation from
residents, businesses and South
107,120 1,330 25.2% 1.2
organizations. The Region Fletchers
of Peel also participates on City of
this Committee. 593,640** 5,283 100 % .89
Brampton
Peel
1,381,740** 11,944 n/a .86
Region
Source: Peel Regional Police: Crime Data 2019
_________________
*NOTE: Includes the following crimes: auto theft, break-in, homicide, mischief, robbery
and theft from a vehicle. The statistics provided are a brief summary of the criminal
activity within the communities listed. Some extrapolation has been conducted to
Concerns about increased generalize the crime trends in those neighborhoods. These statistics do not reflect the
detailed nature of some of the concerns, for official statistics please refer to the official
drug use by youth across statistics released in the Peel Regional Police Annual Statistical report.
all demographics and **NOTE: Chart using Statistics Canada 2016 Census, 100 % population data and 2019
income. crime data.
Region of Peel, Community
Consultation
Of the total number of reported crimes in the City of Brampton,
1,330 or 25.2% of those reported crimes occurred within the
South Fletcher’s study area. Century Gardens has a lower rate of
18.9% or 1,002. Through a per capita perspective, South
Fletcher’s had 1.2 crimes for every 100 people, Century Gardens
is .93 crimes for every 100 people. South Fletcher’s per capita
crime rate is greater than the City of Brampton (.89) and Peel
Region (.86)
11.1-32
Region of Peel Community Data Summary | Century Gardens & South Fletcher’s Study Areas, City of Brampton 23Appendix II
Community Data Summary Report
5. Health
Health data includes information related to how healthy people feel, children's readiness for
school and general health and well-being.
The problem of illness and unnecessary loss of life arises in large
QUICK FACTS…. part because of conditions in which people are born, grow, work and
age. 2 Good health is an important factor of overall well-being and
Century Gardens Study quality of life.
Area (Data Zone B2):
The leading causes of General Health and Well-Being:
death among those 20 The 2009-2014 General Health and Well-being table below, shows
years and older are: that in comparison to Peel Region, adult residents in the
ischemic heart disease, neighbourhood consisting of South Fletcher’s study area (*Data
dementia and
Zone B3/Wards 3 and 4) have significantly higher physical inactivity
Alzheimer’s disease
and injuries or during leisure time, higher general fertility rate and higher infant
poisonings. mortality rate. The pre-term live births rate in the neighbourhood
Peel Public Health consisting of Century Gardens study area (Data Zone B2/Wards 1
__________________ and 5) is 1.5 times higher (12.4%) when compared to Peel (8.2%).
Similarly, adult obesity, physical inactivity and smoking rates are
South Fletcher’s Study significantly higher than that of Peel Region.
Area (Data Zone B3): *Estimates for specific Peel Wards were not available therefore estimates by Data Zone were provided
The leading causes of instead. The geographic boundaries of Data Zone B2 most closely align with the boundaries of Peel
death among those 20 Wards 1 and 5 and Data Zone B3 most closely aligns with Wards 3 and 4. More information about the
Peel Data Zones is available on the Health Status Data Website.
years and older are:
ischemic heart disease, General Health and Well-Being Summary
lung cancer and stroke.
Peel Public Health 2009-2014 Combined
70
60
% of Population
50
40
30
20
10
0
Overweight or Physical Consume fruits Current Exceed low risk
Obese (age Inactive (age and vegetables Smoker (age drinking
18+) 12+) less thatn 5 19+) guidelines
times per day (age 19+*)
(age 18+)
South Fletchers (Data Zone B3) Century Gardens (Data Zone B2)
City of Brampton Peel Region
* Use estimate with caution
Current smoker is defined as a person who currently smokes daily or occasionally, has smoked at least 100 cigarettes in their lifetime and
some in the past 30 days. Low risk drinking includes females who have nine or less drinks in the past week, males who have 14 or less
drinks in the past week and no more than two drinks on each day of the week for both males and females.
Source: Canadian Community Health Survey File, 2009/2010, 2011/2012, 2013/2014, Statistics Canada, Ontario Ministry of Health and Long-
Term Care.
2
Peel Health Data Zone Profiles [Internet]. Mississauga (ON): Peel Public Health, Population Health Assessment; [updated 2016 Jun 22; cited
2020 Feb 10]. Available from: http://www.peelregion.ca/health/statusdata/Datazone/
11.1-33
Region of Peel Community Data Summary | Century Gardens & South Fletcher’s Study Areas, City of Brampton 24Appendix II
Community Data Summary Report
Self-rated Health
An additional health indicator is self-rated health, which is the proportion of population (aged
12+ years) that rate their health as fair or poor. Within the Century Gardens study area,
14.5% reported fair or poor health, South Fletcher’s study area is lower at 12.3%. Both study
areas have a greater proportion of self-rated fair or poor health than the City of Brampton
(9.9%) and Peel Region (11.1%).
Healthy Child Development:
One of the ways to show healthy child development is through the Early Development
Instrument (EDI), which assesses the child’s readiness to learn and meet school demands
such as holding a pencil, listening to the teacher and remembering to follow rules. The
instrument focuses on several areas of school readiness: physical health and well-being; social
competence; emotional maturity; language and cognitive development; and communication
skills and general knowledge.
Century Gardens Study Area:
The physical health and well-being domain is the area of most vulnerability for the Century
Gardens study area. This domain scored 16.4%, slightly lower than the City of Brampton
(16.9%) and Peel Region (16.5%).
Healthy Child Development Early Development Instrument Assessment
Vulnerability of EDI Domains
30%
Percentage of Children
25%
20%
15%
10%
5%
0%
Physical Health Social Emotional Language & Communication
& Well-being Competence Maturity Cognitive Skills & General
Development Knowledge
Century Gardens Study Area City of Brampton Peel Region
Century Gardens City of
EDI Domains Peel Region
Study Area Brampton
Physical Health & Well-being 16.4% 16.9% 16.5%
Social Competence 11.3% 10.3% 10.3%
Emotional Maturity 12.0% 10.4% 10.6%
Language & Cognitive Development 9.6% 10.2% 9.5%
Communication Skills & General Knowledge 9.7% 10.6% 11.1%
Source: Health Services, Region of Peel 2014 – 2015
Early Development Instrument Assessment - 2018
*NOTE: Vulnerability describes the children who score below the 10th percentile cut-off of the Ontario baseline population.
Vulnerability data indicates a percentage of children who are struggling in comparison to the Ontario Baseline data.
11.1-34
Region of Peel Community Data Summary | Century Gardens & South Fletcher’s Study Areas, City of Brampton 25Appendix II
Community Data Summary Report
Healthy Child Development:
South Fletcher’s Study Area
The South Fletcher’s study area had a greater vulnerability in the Physical Health and Well-
being domain (18.8%), higher than the City of Brampton (16.9%) and Peel Region (16.5%).
Healthy Child Development Early Development Instrument Assessment
Vulnerability of EDI Domains
30%
Percentage of Children
25%
20%
15%
10%
5%
0%
Physical Health Social Emotional Language & Communication
& Well-being Competence Maturity Cognitive Skills &
Development General
Knowledge
South Fletcher's Study Area City of Brampton Peel Region
South Fletcher’s
EDI Domains City of Brampton Peel Region
Study Area
Physical Health & Well-being 18.8% 16.9% 16.5%
Social Competence 10.6% 10.3% 10.3%
Emotional Maturity 10.4% 10.4% 10.6%
Language & Cognitive
11.1% 10.2% 9.5%
Development
Communication Skills &
10.9% 10.6% 11.1%
General Knowledge
Source: Health Services, Region of Peel 2014 – 2015
Early Development Instrument Assessment - 2018
*NOTE: Vulnerability describes the children who score below the 10th percentile cut-off of the Ontario baseline population.
Vulnerability data indicates a percentage of children who are struggling in comparison to the Ontario Baseline data.
11.1-35
Region of Peel Community Data Summary | Century Gardens & South Fletcher’s Study Areas, City of Brampton 26Appendix II
Community Data Summary Report
Socioeconomic Vulnerability Index:
The chart below relies on the Peel District School Board’s 2017 Socioeconomic Vulnerability
Index (SVI), which replaces the Social Risk Index. The new index uses a six-step process,
through which five variables were chosen (Median household Income, Percent Living in
Poverty, Percent Homeowners, Percent without a High School Diploma, Percent with
University Degree); to identify the most important neighbourhood-level factors affecting student
success and academic achievement for Peel District School Board (note: index data only
available from the Peel District School Board). Schools are categorized based on their scores
into 6 clusters, with cluster 1 representing low vulnerability and cluster 6 very high vulnerability.
The most recent report was published in 2019 based on 2017 data. Both proposed hub
locations have a total of seven Public elementary schools within a 3 km walking distance. All
schools within both study areas are classified as having either a ‘somewhat high’ to ‘high’
socioeconomic vulnerability score, except for a secondary school in the South Fletcher’s study
area. The Century Gardens study area has two Public secondary schools within 3 kms that
score ‘moderate’ and ‘high’ socioeconomic vulnerability. The South Fletcher’s study area has
one Public secondary school within proximity that has a ‘high’ socioeconomic vulnerability.
Century Gardens South Fletcher's
Number of Number of
Schools SIV Cluster Schools SIV Cluster
(within 3 kms) (within 3 kms)
Elementary 5 5 – High 4 5 - High
Schools 2 4 - Somewhat High 3 4 - Somewhat High
Secondary 1 5 – High 1 3 – Moderate
Schools 1 3 – Moderate
Source: Peel District School Board’s 2017 Socioeconomic Vulnerability Index (2017)
These scores indicate that there is a considerable quantity of youth within proximity to the two
proposed youth hubs that are experiencing poverty and lower than average household
educational attainment rates. This specific demographic is traditionally marginalized and often
face barriers to accessing services.
11.1-36
Region of Peel Community Data Summary | Century Gardens & South Fletcher’s Study Areas, City of Brampton 27Appendix II
Community Data Summary Report
Dental Health:
The Region of Peel Public Health collects children’s oral health data through dental screenings
in all publicly-funded elementary schools.
Century Gardens Study Area
Screening data collected in the 2018-2019 school year in the Century Gardens study area
showed that 66.6% of children in these schools had a dental need which is comparable to the
dental need of all children screened in the same year in the City of Brampton (64.9%) and Peel
Region (65.5%). Identified dental needs include urgent conditions such as infection and tooth
decay that can cause pain, non-urgent conditions such as early tooth decay and preventive
dental needs such as cleanings, topical fluoride applications and dental sealants. As for
children with urgent dental needs in this area, 9.2% of children were identified. This is similar
to the City of Brampton (9.9%) and Peel Region (10.1%) for all children screened. The
preventive dental needs for children in the Century Gardens study area are 51.4%, which is
similar to the proportion for all children screened in the City of Brampton (49.6%) and Peel
Region (50.4%). Additionally, the non-urgent dental needs of children in the study area are
(6%), comparable to those for all children screened in the City of Brampton (5.4%) and Peel
Region (6%).
South Fletcher’s Study Area
Screening data collected in the 2018-2019 school year in the South Fletcher’s study area
showed that 70.8% of children in these schools had a dental need. This is slightly higher than
the proportion of children screened in the same year in the City of Brampton (64.9%) and Peel
Region (65.5%). Identified dental needs include urgent conditions such as infection and tooth
decay that can cause pain, non-urgent conditions such as early tooth decay and preventive
dental needs such as cleanings, topical fluoride applications and dental sealants. In the South
Fletcher’s study area, a higher proportion (12.3%) of children were identified with urgent dental
needs compared to the City of Brampton (9.9%) and Peel Region (10.1%). Additionally, 52.3%
of children were identified with preventive dental need which is higher than all children
screened in the City of Brampton (49.6%) and Peel Region (50.4%). Additionally, the non-
urgent dental needs of children in the study area are (6.1%), comparable to those for all
children screened in the City of Brampton (5.4%) and Peel Region (6%).
Oral Health
Urgent
Dental Non-urgent Preventive
Dental
Study Area Need Dental Needs Dental Needs
Needs
(%) (%) (%)
(%)
Century Gardens 66.6% 9.2% 6.0% 51.4%
South Fletcher’s 70.8% 12.3% 6.1% 52.3%
City of Brampton 64.9% 9.9% 5.4% 49.6%
Peel Region 65.5% 10.1% 6.0% 50.4%
Source: Ontario Oral Health Information Support System (OHISS), 2019, Ministry of Health.
NOTE: The data collected through dental screenings are not representative of the overall population of the regions stated. The
Region of Peel-Public Health collects children’s oral health data through dental screenings in all publicly funded elementary
and secondary schools. Peel Public Health provides dental screenings in all publicly funded elementary schools and reports
on the following dental needs outcomes: Urgent dental needs, Non-urgent dental needs, Preventive dental.
11.1-37
Region of Peel Community Data Summary | Century Gardens & South Fletcher’s Study Areas, City of Brampton 28Appendix II
Community Data Summary Report
6. Physical Environment
This domain includes data on dwellings, infrastructure such as retailers, natural resources,
proximity to neighbours, and how easily residents are able to access fresh food.
Century Gardens Study Area:
QUICK FACTS…. Century Gardens study area has several physical assets such as
the Downtown Transit Terminal, Century Gardens Recreation
Centre, Chris Gibson Recreation Centre, Algoma University and
several parks. These assets contribute to the data indicator related
to proximity to meeting spaces. Overall, there is good proximity to
Programs need to be in community meetings spaces however, Ward 1 has greater
an accessible safe space proximity to meeting spaces (54%), (Ward 5 – 5.7%). Both areas
and free; where youth are lower than Peel Region (55.5%) however higher than the City
are not judged. of Brampton (49.9%).
Region of Peel, Community
Consultation
Proximity to food retailers (fresh food retailers within a ten-minute
walk) also varies across the two wards (Ward 1 – 47%, Ward 5 –
30%), compared to the City of Brampton (43.2%) and Peel Region
__________________ (49.5%) This indicator does not consider the affordability of fresh
food. It is important that factors such as food insecurity in relation
to the low-income population be considered.
South Fletcher’s Study Area:
Older youth (18-25- South Fletcher’s study area has a variety of physical assets such
years) want a dedicated as the Gateway Transit Terminal, South Fletcher’s Sportsplex and
youth space, not one Library, Sheridan College, Peel Regional Police Division (22),
shared with seniors. Joint several parks and the Fletcher’s Creek Trail System, shopping
occupied public spaces centres as well as many faith organizations. As a result, the data
often deter youth from indicator related to proximity to community meeting spaces (Ward
accessing. 3 – 77%, Ward 4 – 56%) and the indicator related to proximity to
Region of Peel, Community
Consultation
food retailers (Ward 3 – 62%, Ward 4 – 52%) are both positive and
higher than the City of Brampton and Peel Region percentages in
the chart below.
City of
Peel Region
Brampton
Proximity to Food Retailers 43.2% 49.5%
Proximity to Community
49.9% 55.5%
Meeting Places
Source: Combination of Association of Public Health Epidemiologists of Ontario and City
of Toronto methods. 2017
Similar to Century Gardens, considerations around food insecurity
and low-income are also important.
11.1-38
Region of Peel Community Data Summary | Century Gardens & South Fletcher’s Study Areas, City of Brampton 29Appendix II
Community Data Summary Report
Types of Occupied Dwellings
A combination of dwellings can be found in both study areas, the majority are single detached.
South Fletcher’s has a greater number of apartments and Century Gardens has a greater
number of semi-detached dwellings.
Occupied Dwellings
200,000
180,000
160,000
140,000
120,000
100,000
80,000
60,000
40,000
20,000
-
Single Semi
Row houses Apartments
detached detached
Peel 196,175 51,040 56,145 126,440
Brampton 87,570 23,035 20,670 36,715
Century Gardens 14,160 6,725 4,650 7,550
South Fletchers 14,070 1,275 3,775 14,840
Source: Statistics Canada, Census of Canada 2016
11.1-39
Region of Peel Community Data Summary | Century Gardens & South Fletcher’s Study Areas, City of Brampton 30Appendix II
Community Data Summary Report
Community Consultation Input
Stakeholder Survey:
As part of the needs analysis, Regional staff engaged youth and youth-serving stakeholders
within the two study areas to participate in a survey to inform this report. A total of 53
stakeholders were invited to participate in a telephone or on-line survey of which 62%
responded. The survey consisted of five questions as outlined in Appendix III.
The survey respondents identified the following top ten concerns for youth in the community:
Survey Question: What needs are youth most concerned about in
the community?
Employment/Career Opportunities 82%
Youth Spaces 70%
Culturally Appropriate Programs 70%
Education/Schools 64%
Safe Spaces (free of discrimination) 58%
Housing 58%
Recreation Services 58%
Safety 52%
Entertainment 48%
Food Security 48%
In addition, surveyed respondents identified additional concerns related to access to
newcomer settlement services (36%), healthcare services (30%), accessibility for individuals
with disabilities (27%), childcare (21%) and mental health (15%).
11.1-40
Region of Peel Community Data Summary | Century Gardens & South Fletcher’s Study Areas, City of Brampton 31Appendix II
Community Data Summary Report
Stakeholder Survey:
Survey respondents identified the following top five barriers youth face to access programs
and services:
Survey Question: What are the barriers that youth face when trying to
access programs and services in the identified
areas in Brampton?
Transportation 73%
Cost 64%
Lack of programs/services 61%
Waitlist for services 52%
Hours 52%
In addition, barriers related to discrimination and age limits (both 39%) were also identified.
11.1-41
Region of Peel Community Data Summary | Century Gardens & South Fletcher’s Study Areas, City of Brampton 32Appendix II
Community Data Summary Report
Community Validation Meeting:
Youth and youth-serving stakeholders were invited to a community validation meeting on
January 14, 2020. A total of 22 individuals were provided with an overview of the preliminary
data findings contained in this report and asked to validate the information and identify
additional community assets to inform this report. Stakeholders were asked the following
questions:
1. Does the data reflect what you know about the community?
2. Have there been any major changes over the last four years?
3. Is any information missing?
Through an asset mapping activity, stakeholders identified many community assets in both
study areas including a large number of faith organizations, schools, accessible transit and
other City services.
Stakeholders expressed concerns about increased drug use and substance abuse and social
isolation of youth, especially international students. Many felt youth would benefit from a youth
dedicated physical space that provides supports for a variety of needs including employment,
training, recreation, mental health counselling, general life skills and access to information.
Implementing a service system navigator model in the proposed community youth hubs could
provide greater support for youth experiencing multiple barriers and youth-serving agencies
providing referrals.
The community validation meeting reinforced initial findings and validated the report themes as
outlined in the section titled Community Data Summary Themes.
11.1-42
Region of Peel Community Data Summary | Century Gardens & South Fletcher’s Study Areas, City of Brampton 33Appendix II
Community Data Summary Report
Conclusion
In light of the diversity and needs demonstrated in the two study areas, hubs represent a
service model that can address the growing needs of these communities in an integrated and
efficient manner.
The Community Data Summary confirms that within both study areas, youth are experiencing
multiple challenges with insufficient access to supports. It is noted in the report that seniors (65
years plus) are a population that is growing across the City of Brampton. Aside from the two
identified study areas, neighbourhoods within Ward 7 and 8 are experiencing low well-being.
In summary, the analysis of data, literature and community consultations, identified the
emerging themes:
1. Economic
2. Safety
3. Health
4. Resident Engagement and Community Belonging
As resident needs, engagement and participation are not limited to the defined study area
boundaries used within the Community Data Summary, it is important that future planning
include additional consultation and engagement of diverse community groups and
stakeholders. Given the high demand for social and health services across the study areas
and municipality, it is anticipated that youth outside of the study areas will also access and
benefit from the community hubs.
11.1-43
Region of Peel Community Data Summary | Century Gardens & South Fletcher’s Study Areas, City of Brampton 34You can also read