Regional Residential Report Shire of Bass Coast - Planning
←
→
Page content transcription
If your browser does not render page correctly, please read the page content below

Regional Residential Report Shire of Bass Coast
ACKNOWLEDGEMENTS
This Urban Development Program was undertaken by Spatial Economics Pty Ltd, and
commissioned by the Department of Transport, Planning and Local Infrastructure (DTPLI).
The Urban Development Program (Bass Coast) would not have been possible if it were
not for the invaluable contribution made by staff from the Shire of Bass Coast and the
Department of Transport, Planning and Local Infrastructure’s Gippsland Regional Office.

Published by the Urban Development Program
Department of Transport, Planning and Local Infrastructure
1 Spring Street Melbourne Victoria 3000
Telephone (03) 9223 1783

April 2013
Unless indicated otherwise, this work is made available under the terms of the Creative
Commons Attribution 3.0 Australia licence. To view a copy of this licence, visit http://
creativecommons.org/licenses/by/3.0/au
Urban Development Program, State of Victoria through the Department of Transport, Planning
and Local Infrastructure 2013
Authorised by Matthew Guy, 1 Spring Street Melbourne Victoria 3000.
This publication may be of assistance to you but the State of Victoria and its employees do
not guarantee that the publication is without flaw of any kind or is wholly appropriate for your
particular purposes and therefore disclaims all liability for an error, loss or other consequence
which may arise from you relying on any information in this publication.

Accessibility
If you would like to receive this publication in an accessible format, please telephone
(03) 9223 1783 or email urbandevelopment.program@dpcd.vic.gov.au. This
publication is also available in Word format on http://www.dpcd.vic.gov.au/planning/
plansandpolicies/urban-development-program
CONTENTS

EXECUTIVE SUMMARY                                                             1

1.0 INTRODUCTION                                                              4
1.1   PURPOSE AND CONTEXT                                                     4
1.2   PROGRAM CONTEXT                                                         4
1.3   2012 URBAN DEVELOPMENT PROGRAM REPORTS                                  5

2.0 APPROACH & METHODOLOGY                                                    6

3.0 OVERVIEW                                                                 10

4.0 RECENT ACTIVITY                                                          11
4.1   RESIDENTIAL BUILDING APPROVALS                                         11
4.2   RESIDENTIAL LOT CONSTRUCTION                                           12

5.0 RESIDENTIAL LAND SUPPLY                                                  16
5.1   MINOR INFILL SUPPLY                                                    17
5.2   BROADHECTARE & MAJOR INFILL SUPPLY                                     19
5.3   FUTURE RESIDENTIAL LAND SUPPLY                                         20
5.4   RURAL RESIDENTIAL ALLOTMENTS                                           20

6.0 PROJECTED DEMAND                                                         23

7.0 YEARS OF SUPPLY – RESIDENTIAL LAND                                       25

8.0 RESIDENTIAL TABLES                                                       27
LOCATION OF SUBURBS AND STATISTICAL LOCAL AREAS –                            34
BASS COAST
GLOSSARY OF TERMS                                                            35

URBAN DEVELOPMENT PROGRAM REGIONAL RESIDENTIAL REPORT 2012 - SHIRE OF BASS COAST
                                     [ i ]
LIST OF TABLES
Table 1: Residential Lot Potential By Supply Type, March 2012
Table 2: Anticipated Lot Construction Activity – Broadhectare/Major Infill, 2012
Table 3: Estimated Years Of Residential Broadhectare And Major Infill Land Supply,
2012
Table 4: Minor Infill Lot Construction Activity, July 2006 To March 2012
Table 5: Parent Lot Size Of Minor Infill Lot Construction, July 2006 To March 2012
Table 6: Broadhectare/Major Lot Construction Activity, July 2006 To March 2012
Table 7: Low Density Residential Lot Construction Activity, July 2006 To March 2012
Table 8: Rural Living Lot Construction Activity, July 2006 To March 2012
Table 9: Minor Infill (Vacant Lots) Supply By Lot Size Cohort, Dec 2009
Table 10: Broadhectare/Major Infill Lot Potential And Anticipated Development Timing
(Lots), 2012
Table 11: Broadhectare/Major Infill Stocks – No Timing Or Yield, 2012
Table 12: Future Rural Residential Stock (Hectares), 2012
Table 13: Occupied And Vacant Rural Residential Lots By Zone Type, 2009
Table 14(A): Estimated And Projected Population, 2010 To 2031
Table 14(B): Estimated And Projected Number Of Dwellings, 2010 To 2031
Table 14(C): Projected Average Annual Change In The Number Of Persons And
Dwellings, 2011 To 2031
Table 14(D): Projected Average Annual Percentage Change In The Number Of Persons
And Dwellings, 2011 To 2031
LIST OF GRAPHS
Graph 1: Number Of Residential Building Approvals By Type, July 2006 To March 2012
Graph 2: Number Of Residential Lots Constructed By Supply Type, July 2006 To
March 2012
Graph 3: Average Annual Number Of Residential Lots Constructed By Suburb, July
2006 To March 2012
Graph 4: Parent Lot Size Of Minor Infill Lot Subdivision, July 2006 To March 2012
Graph 5: Minor Infill Supply – Number Of Vacant Zoned Residential Allotments,
By Lot Size Cohort, 2009
Graph 6: Stock Of Vacant And Occupied ‘Rural Residential’ Allotments, 2009
Graph 7: Historic And Projected Demand For Residential Dwellings, 2006 To 2026
URBAN DEVELOPMENT PROGRAM REGIONAL RESIDENTIAL REPORT 2012 - SHIRE OF BASS COAST
[ ii ]EXECUTIVE SUMMARY
The Urban Development Program for Regional Victoria provides an analysis of supply and
demand for residential and industrial land across parts of regional Victoria. The initial
municipalities covered were Ballarat, Greater Bendigo, Latrobe and Wodonga. The next
round of completed land supply assessments include the municipal areas of Wangaratta,
Greater Shepparton, Warrnambool, Horsham and Mildura, as well as the G21 consortium
of councils. This ‘round’ of land supply assessments includes the following municipalities:
Bass Coast, Baw Baw, Macedon Ranges, Mitchell, Moorabool, Mount Alexander, Moyne and
South Gippsland.
This component provides information on residential supply and demand for the Shire of
Bass Coast.
The following residential land supply assessment was undertaken by Spatial Economics Pty
Ltd and commissioned by the Department of Transport, Planning and Local Infrastructure
in conjunction with the Shire of Bass Coast.
It draws on important information and feedback obtained through a number of comprehensive
consultations with key council officers, and Department of Transport, Planning and Local
Infrastructure regional officers undertaken through the course of the project.
RECENT ACTIVITY
As measured from July 2006 to March 2012 residential building approval activity within
the municipal area of Bass Coast has averaged 537 per annum. As measured at the March
Quarter 2012 there was 443 residential dwelling approvals.
The majority of building approvals (92%) since July 2006 have been separate houses, 5%
semi-detached dwellings and 3% units/apartments. The majority (61% or 325 per annum)
of building approval activity since July 2006 has been located within the Statistical Local
Area (SLA) of Bass Coast – Balance, the location of Wonthaggi, Inverloch, Corinella and
Cape Paterson.
From July 2006 to March 2012 there was an average annual residential lot construction of
476. The majority (47%) were broadhectare/major infill lots, closely followed by minor infill
lot construction at 45% and 8% rural residential.
The majority (29%) of residential lot construction activity was located within the suburb of
Cowes, followed by Inverloch (24%) and Wonthaggi/North Wonthaggi (15%).
Lot construction and residential building approval activity as measured from July 2006 to
March 2012 broadly aligns in terms of the identified volume at 476 and 537 respectively
per annum.
URBAN DEVELOPMENT PROGRAM REGIONAL RESIDENTIAL REPORT 2012 - SHIRE OF BASS COAST
[ 1 ]PROJECTED DEMAND
Projected dwelling requirements sourced from Victoria in Future 2012 indicate that from
2011 to 2026 there will be a total dwelling requirement of 11,289 (753 average per annum).
An alternative demand projection has been developed that is based on recent (2006 to 2012)
building approval activity – a measure of expressed demand, in conjunction with growth
rates identified in the State Governments’ projections. This demand scenario results in an
average annual dwelling requirement of 557 dwellings per annum.
This growth scenario results in a 26% (2,928 dwellings) decrease in total dwelling
requirements from 2011 to 2026.
IDENTIFIED RESIDENTIAL LAND SUPPLY
In total (excluding minor infill) there is a residential lot supply of approximately 10,025. This
is comprised of:
• 5,580 zoned broadhectare/major infill lots (57% of supply);
• 194 vacant rural residential lots (2% of supply); and
• 4,251 designated future residential lots (41% of supply).
As at December 2009, there was 2,509 minor infill lots identified. Of these lots, 2,314 were
sized less than 1,200sqm or 92% of the identified lots.
As at March 2012, there was a residential lot capacity within broadhectare areas of
approximately 5,580 of which 33% (1,822 lots) is located in Wonthaggi/North Wonthaggi/
Wattle Bank, 18% (1,020 lots) in Cowes and 14% (802 lots) in Inverloch.
Within the municipal area of Bass Coast, there is an estimated lot potential within Future
Residential areas of approximately 4,251. In addition to the above ‘future residential’
land stocks there are additional supply areas that have not been assessed in terms of
potential lot yield. This potential residential land supply is located in San Remo and is
approximately 35 hectares in size.
As at December 2009 across the municipality of Bass Coast there was a total lot stock of
rural residential allotments of 659. Of this stock, 194 lots were vacant, a lot vacancy rate
of 29%. A total of 97 hectares of future rural residential land stocks have been identified.
YEARS OF RESIDENTIAL LAND SUPPLY
Two projected demand scenarios are used to assess the years of residential land stocks,
the outcomes are summarised below.
VICTORIA IN FUTURE 2012 DEMAND SCENARIO
In terms of zoned broadhectare and major infill residential land stocks it is estimated based
on the identified supply and projected demand, there are sufficient land stocks to satisfy
15 years of future demand.
Zoned broadhectare and major infill supply by SLA is sufficient to satisfy demand for:
• 15 years: Bass Coast (S) - Phillip Is. SLA; and
• 15 years: Bass Coast (S) Bal SLA.
In terms of future residential land supply stocks, there is sufficient land to satisfy over
10 years of projected demand across the municipal area. Unzoned (future) broadhectare
supply by SLA is sufficient to satisfy demand for:
• 14 years: Bass Coast (S) Bal SLA.
URBAN DEVELOPMENT PROGRAM REGIONAL RESIDENTIAL REPORT 2012 - SHIRE OF BASS COAST
[ 2 ]HISTORIC TREND BASED DEMAND SCENARIO
In terms of zoned broadhectare and major infill residential land stocks it is estimated
based on the identified supply and projected demand, there are sufficient land stocks to
satisfy 15+ years of future demand.
Zoned broadhectare and major infill supply by SLA is sufficient to satisfy demand for:
• 15+ years: Bass Coast (S) - Phillip Is. SLA; and
• 15+ years: Bass Coast (S) Bal SLA.
In terms of future residential land supply stocks, there is sufficient land to satisfy
15+ years of projected demand. Unzoned broadhectare supply by SLA is sufficient to satisfy
demand for:
• 15+ years: Bass Coast (S) Bal SLA.
Conclusions and Current Actions
In summary there is an adequate stock of total residential land to meet Victoria in
Future and trend based consumption rates across the Shire of Bass Coast.
Consumption of residential land, however, should continue to be monitored to
ensure there are sufficient land stocks to meet future demand, and identify any
impediments to the delivery of allotments in the short-term.
Based on Victoria in Future 2012 projections, the Shire of Bass Coast currently has
around 15 years supply of zoned residential land stocks across the municipality.
In terms of ‘future’ or unzoned land stocks, there are sufficient stocks to satisfy an
additional 10 years of additional demand.
Wonthaggi has been identified within the Bass Coast Planning Scheme’s settlement
hierarchy as a regional centre with high spatial growth capacity; and will be
encouraged to accommodate large scale residential growth within the town
boundary, particularly the north east growth area.
The Wonthaggi Strategic Framework Plan establishes a clear direction for the
future physical form of Wonthaggi in that it identifies the preferred location for the
various forms of land uses within the township; and is supported by the Wonthaggi
Dalyston Structure Plan, adopted by Council back in September 2008.
Bass Coast Council has introduced the “Moving Forward” project, which sees the
implementation of the Wonthaggi Dalyston Structure Plan. The project will ensure
that there is an adequate supply of land for residential, industrial and commercial
uses in the area to meet future population growth.
Bass Coast Council is also in the process of finalising a ‘Bass Coast Land Release
Management Plan’. The Land Release Management Plan is intended to provide a
clear direction for managing population growth and the spatial expansion
of settlements.
URBAN DEVELOPMENT PROGRAM REGIONAL RESIDENTIAL REPORT 2012 - SHIRE OF BASS COAST
[ 3 ]1.0 INTRODUCTION
1.1 PURPOSE AND CONTEXT
The Urban Development Program was set up in 2003 to assist in managing the growth
and development of metropolitan Melbourne and the Geelong region, and help ensure
the continued sustainable growth of these areas in order to maintain their high
levels of liveability.
The primary purpose of the Urban Development Program is to improve the management of
urban growth by ensuring that government, councils, public utilities and the development
industry have access to up-to-date and accurate information on residential and industrial
land availability, development trends, new growth fronts, and their implications for planning
and infrastructure investment.
To achieve the primary purpose the Urban Development Program provides accurate,
consistent and updated intelligence on residential and industrial land supply, demand and
consumption. This in turn assists decision-makers in:
• maintaining an adequate supply of residential and industrial land for future housing and
employment purposes;
• providing information to underpin strategic planning in urban centres;
• linking land use with infrastructure and service planning and provision;
• taking early action to address potential land supply shortfalls and infrastructure
constraints; and
• contributing to the containment of public sector costs by the planned, coordinated
provision of infrastructure to service the staged release of land for urban development.
• The information contained and reported within the Urban Development Program
enables early action to be taken in areas where land shortfalls have been identified.
1.2 PROGRAM CONTEXT
During 2009-2010, the Urban Development Program was expanded across key provincial
areas across regional Victoria, and is incrementally being rolled out across the State.
Initially, these included the municipalities of Ballarat, Greater Bendigo, Latrobe and
Wodonga. The next group of land supply assessments for completion include the
municipalities of Wangaratta, Greater Shepparton, Warrnambool, Horsham and Mildura; as
well as the G21 consortium of councils.
This ‘round’ of land supply assessments includes the following municipalities: Bass
Coast, Baw Baw, Macedon Ranges, Mitchell, Moorabool, Mount Alexander, Moyne and
South Gippsland.
The expanded Urban Development Program into regional Victoria will build local and
regional data bases and, importantly, provide a platform for mapping and spatial analysis
in each region. This will in turn allow councils and other key stakeholders in the planning
and development sectors to make more informed decisions in the growth and investment of
these key areas across regional Victoria.
The residential and industrial land supply assessments for Bass Coast Shire were
undertaken by Spatial Economics Pty Ltd, and commissioned by the Department of
Transport, Planning and Local Infrastructure in conjunction with the associated councils.
URBAN DEVELOPMENT PROGRAM REGIONAL RESIDENTIAL REPORT 2012 - SHIRE OF BASS COAST
[ 4 ]1.3 2012 URBAN DEVELOPMENT PROGRAM REPORTS
The 2012 Urban Development Program Reports for Bass Coast, Baw Baw, Macedon
Ranges, Mitchell, Moorabool, Mount Alexander, Moyne and South Gippsland, as well as
additional Regional Reports and the metropolitan Urban Development Program Annual
Report, are available online at www.dpcd.vic.gov.au/urbandevelopmentprogram
Interactive online maps are also available. MapsOnline enables users to search for specific
projects, generate reports and print or download maps and statistical reports. It allows
users to search for specific land supply areas by region or municipality, estate name,
Melway reference, street address or lot number.
To access the Regional Urban Development Program Maps Online visit
www.land.vic.gov.au/udp
For more information about the Urban Development Program, email
the Department of Transport, Planning and Local Infrastructure at
urbandevelopment.program@dpcd.vic.gov.au
URBAN DEVELOPMENT PROGRAM REGIONAL RESIDENTIAL REPORT 2012 - SHIRE OF BASS COAST
[ 5 ]2.0 APPROACH & METHODOLOGY
The following provides a brief outline of the major methodologies and approach in the
assessment of recent residential lot construction, residential land supply, projections
of demand and determining the years of supply of current land stocks. In addition, key
definitions of terms used within the following assessment are detailed in the glossary of
terms at the end of this report.
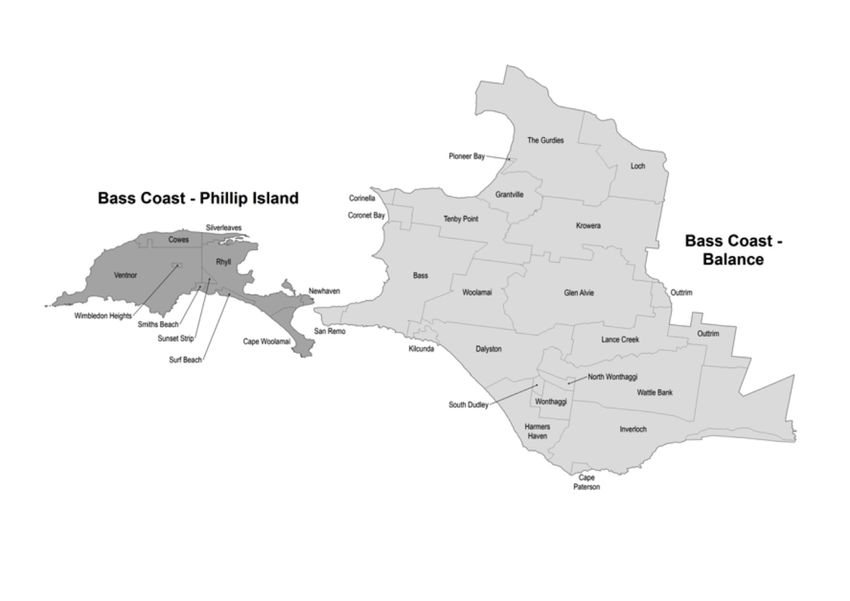
Information is presented at both a Statistical Local Area (SLA) and suburb (Australian
Bureau of Statistics definition) level. A map highlighting the location of these boundaries is
located within the data appendices. The report retains ABS terminology for the geographic
areas, however it is appreciated that the term ‘suburbs’ includes urban and rural areas.
Assessments of land supply are dependant on the availability of aerial imagery. The most
current imagery available for this assessment was taken during the summer of 2009-2010.
Note that for the purposes of this report the regional component of the expanded Urban
Development Program is referred to as the ‘Regional Urban Development Program’.
ESTIMATING FUTURE DWELLING REQUIREMENTS
The Population and Household Projections 2011-2031 for Victoria and Its Regions, released
by the (former) Department of Planning and Community Development and outlined in
Victoria in Future 2012, are used by the Regional Urban Development Program as the basis
for determining projected demand for residential allotments. Demand information is
assessed at both a municipal level and by the component Statistical Local Areas (SLAs).
RESIDENTIAL LAND
In the following land supply assessments residential lot construction and land supply have
been designated by differing supply types, namely:
Minor Infill: Undeveloped land within the existing urban area, zoned for residential
development, and parent lot or existing lot less than 1ha.
Major Infill: Undeveloped land or sites identified for redevelopment within the existing
urban area, zoned for residential development, and parent lot or existing lot greater
than 1ha.
Broadhectare: Undeveloped land generally located on the urban fringe, zoned for
residential development (no previous urban development activity), and the parent lot
greater than 1ha.
Future Residential: Land identified by the relevant municipal authority for future residential
development and current zoning not supportive of ‘normal’ residential development. Land
which has an ‘Urban Growth Zone’ applied, and a precinct structure plan has not yet been
approved, falls into this category.
Rural Residential: Land zoned or identified for future Low Density Residential (LDRZ) or
Rural Living (RLZ).
URBAN DEVELOPMENT PROGRAM REGIONAL RESIDENTIAL REPORT 2012 - SHIRE OF BASS COAST
[ 6 ]RESIDENTIAL LOT CONSTRUCTION
Residential lot construction has been determined via the processes established within the
State Governments Housing Development Data project. It involves the extensive cleaning
of the residential cadastre and the application of this cadastre to the land supply types
identified above.
A constructed lot is defined by the year of construction and the finalisation of
certificate of title.
Construction activity has been assessed on an annual basis as at July of each year from
2005 to 2011.
LOT YIELDS
Lot yields have been established on a parcel by parcel basis for the following land supply
types: major infill, broadhectare and future residential.
In establishing the lot yield for each individual land parcel the following information was
used: incidence and location of native vegetation, zoning, natural features such as creeks,
old mineshafts, escarpments, floodways, localised current/recent market yields, existing
studies such as structure plans, municipal strategic statements etc.
In addition to site specific issues, ‘standard’ land development take-outs are employed,
including local and regional. The amount/proportion of such take-outs are dependent on
the site of the land parcel i.e. a 1ha site will have less take-outs than say a 50ha site. This
approach has been utilised by both the residential and industrial land supply assessments
since 2004 in the metropolitan Urban Development Program.
Further intelligence and verification is sourced from local council planning officers.
A small number of supply sites have been allocated a zero lot yield due to a number of
varying factors, these include but not limited to:
• unlikely to be developed over the next 15 years due to issues such as significant
ownership fragmentation on relatively small parcels of land;
• subdivision restricted until sewerage is provided;
• the site is within an area of low demand and is unlikely to be developed with any
certainty within the foreseeable future; and
• potential/likely lot density could be low.
Sites with a zero lot yield have been identified and are summarised by location and area.
DEVELOPMENT TIMING
Staging for lot construction or development timing has been established for four broad
time periods, namely:
• 1 to 2 years (2012–2013);
• 3 to 5 years (2014–2016);
• 6 to 10 years (2017–2021);
• 11 years or more (2022 and beyond); and
• No timing.
Land identified for development over the next 2 years is available for residential purposes,
and the required permits to subdivide the land generally exist and are being implemented.
Land parcels identified for development in 3 to 5 years are normally zoned, or may
have rezonings finalised or approaching finalisation. They may also have permits to
subdivide the land. Some degree of confidence can be applied to the timing and staging of
these developments.
URBAN DEVELOPMENT PROGRAM REGIONAL RESIDENTIAL REPORT 2012 - SHIRE OF BASS COAST
[ 7 ]Confidence about lot yields and staging declines for developments proposed beyond 5 years
as it is industry practice to regard developments beyond this period with less certainty in
terms of exact staging, timing and yields.
A no timing category has been established for potential residential development sites that
are within low demand areas (generally small outlying settlements). These sites typically
in addition are allocated a zero potential lot yield. They are identified as potential and are
measured by area.
Where land has been identified as ‘Future Residential’ there are no associated timings, as
these cannot be confidently applied until such time the land is zoned to allow residential
development to occur. Similarly, land which is within an Urban Growth Zone, where a
precinct structure plan has not been approved, falls into a similar category. At such time
a precinct structure plan has been prepared and approved, potential timings of residential
development associated to these areas can be applied with a higher degree of confidence.
It should also be noted that timing of lot construction is cyclical, and highly dependent
on underlying demand, economic cycles and industry capacity. This can mean that stated
development intentions will vary from on-the-ground construction activity over time and
by location. However, it is highly accurate in terms of the general direction and amount
of growth.
Development timings have only been established for both Major Infill land supply stocks
and broadhectare land.
Anticipated development timings are primarily sourced from existing planning permits,
historic and current market activity, knowledge of industry capacity, projected demand and
most importantly intelligence from local council staff.
RURAL RESIDENTIAL
Rural Residential allotments have been established via the assessment of the cadastre
and zoning information. All allotments zoned either Rural Living (RLZ) and Low Density
Residential (LDRZ) is included. Custom technology as described above was utilised to
establish the stock of vacant low density allotments, this was subsequently verified via a
manual process in conjunction with aerial imagery. The assessment is undertaken on the
date of the latest aerial imagery.
YEARS OF SUPPLY FOR RESIDENTIAL LAND
A key purpose of the Regional Urban Development Program is to identify if sufficient
residential land is available to meet projected dwelling requirements within the relevant
municipal area. Sufficient stock of residential land is required to maintain an ongoing
supply to the market and to contribute to:
• adequate competition in the land development market to avoid unnecessary upward
pressure on land prices and housing affordability; and
• sufficient lead times for planning and service provision agencies to undertake
appropriate strategic and infrastructure planning activities.
For the purpose of reporting on the years of supply of residential stocks, the Regional
Urban Development Program assesses the existing stock of residential land (major infill,
broadhectare and future residential) relative to projected demand.
In assessing the number of years of broadhectare, major infill and designated future
(unzoned) residential land supply, only a component of the total projected demand is
apportioned to estimate future demand for broadhectare and major infill supply. The
remainder is apportioned for future demand for other forms of residential supply such as
low density and rural living.
URBAN DEVELOPMENT PROGRAM REGIONAL RESIDENTIAL REPORT 2012 - SHIRE OF BASS COAST
[ 8 ]The number of ‘years of supply’ of residential land is undertaken at both a municipal level
(total) and by Statistical Local Area. Years of supply is expressed for both the total zoned
stocks of identified residential land and future residential land stocks.
Two projected demand scenarios are illustrated:
• Dwelling requirements contained within the (former) DPCD’s Population and Household
Projections (Victoria in Future 2012); and
• Recent residential building approval trends (2006 to 2012).
Both sets of projections are discounted by the historic average of total broadhectare and
major infill lot construction relative to total residential lot construction activity. In addition,
the historic trend scenario applies the projected proportional rate of change as identified
within the population projections.
URBAN DEVELOPMENT PROGRAM REGIONAL RESIDENTIAL REPORT 2012 - SHIRE OF BASS COAST
[ 9 ]3.0 OVERVIEW
Bass Coast Shire is located in the West and South Gippsland region of Victoria, 52
kilometres south east of Dandenong and an hour and a half drive from central Melbourne.
Bass Coast Shire covers approximately 800 square kilometres. It is predominantly a coastal
municipality defined by the unique foreshore habitats of Bass Strait, the Bunurong Coast,
Western Port and Anderson Inlet. The coastal areas are complemented by rural hinterland,
river flats, and the Strzelecki Foothills.
The major population centres are Wonthaggi, Cowes, San Remo and Inverloch. Aside from
Wonthaggi the larger centres are coastal communities with large population fluctuations
during holiday and summer periods. Wonthaggi is located inland from the coast. It has
a predominately permanent population, and has traditionally provided a link with the
agricultural and rural communities.
There are a number of other towns and villages in the Shire. These range from small rural
communities and small coastal hamlets, to developing activity centres such as Grantville.
Over recent years, Bass Coast Shire Council has been developing structure plans and
design frameworks for a number of towns and will continue to develop these plans for the
main residential areas across the Shire. The purpose of these plans is to define settlement
boundaries for urban areas, provide strategic direction for managing population growth and
to ensure sustainable land use practices.1
This report covers the trends and shifts in building activity across the municipality of Bass
Coast, and provides an insight into proposed future residential development activity.
The information in this section has been compiled resulting from a number of
comprehensive consultations with key representatives from the Shire of Bass Coast. It is
supported by datasets from the Australian Bureau of Statistics.
1
Shire of Bass Coast Planning Scheme
URBAN DEVELOPMENT PROGRAM REGIONAL RESIDENTIAL REPORT 2012 - SHIRE OF BASS COAST
[ 10 ]4.0 RECENT ACTIVITY
This section of the report details the recent activity of residential lot construction, dwelling
approvals and sales values achieved across the municipal area of Bass Coast. Residential
lot construction activity is detailed from July 2006 to March 2012 and is presented at a
suburb, Statistical Local Area (SLA) and municipal level. Residential lot construction is
further analysed by supply type/location, namely:
• Minor Infill;
• Broadhectare/Major Infill (combined); and
• Rural Residential.
4.1 RESIDENTIAL BUILDING APPROVALS
As measured from July 2006 to March 2012 residential building approval activity within the
municipal area of Bass Coast has averaged 537 per annum, the amount of building approval
activity as measured on an annual basis has been relatively consistent. However, approvals
peaked at 609 in 2010-11 and troughed at 460 in 2008-09. As measured at the March
Quarter 2012 there was 443 residential dwelling approvals.
Graph 1 illustrates the amount of building approval activity by dwelling type on a quarterly
basis for the municipal area of Bass Coast.
The vast majority of building approvals (92%) since July 2006 have been separate houses,
5% semi-detached dwellings and 3% units/apartments.
The majority (61% or 325 per annum) of building approval activity since July 2006 has been
located within the Statistical Local Area (SLA) of Bass Coast – Balance, the location of
Wonthaggi, Inverloch, Corinella and Cape Paterson.
Within the Bass Coast – Phillip Island SLA there was 212 residential dwelling approvals per
annum from July 2006 to March 2012, representing 39% of the municipalities total approval
activity. This SLA includes the major urban centre of Cowes.
URBAN DEVELOPMENT PROGRAM REGIONAL RESIDENTIAL REPORT 2012 - SHIRE OF BASS COAST
[ 11 ]Graph 1: Number of Residential Building Approvals by Type, July 2006 to March 2012
200
180
160
Number of Dwelling Approvals
140
120
100
80
60
40
20
0
Aug-06
Dec-06
Aug-07
Dec-07
Aug-08
Dec-08
Aug-09
Dec-09
Aug-10
Dec-10
Feb-07
Feb-08
Feb-09
Feb-10
Feb-12
Aug-11
Dec-11
Feb-11
Jun-06
Jun-07
Jun-08
Jun-09
Jun-10
Oct-06
Apr-07
Oct-07
Apr-08
Oct-08
Apr-09
Oct-09
Apr-10
Oct-10
Jun-11
Apr-11
Oct-11
Apartments/Units Townhouses Separate Houses Total Dwellings
Source: Australian Bureau of Statistics, Catalogue No.8731.0
4.2 RESIDENTIAL LOT CONSTRUCTION
Analysis has been undertaken to determine on a lot by lot basis the location and amount of
residential lot construction activity from July 2006 to March 2012. Lot construction activity
has been classified into distinct supply types and or supply locations as defined above.
Graph 2 summarises the amount of residential lot construction by supply type for the
municipal area of Bass Coast. From July 2006 to March 2012 there was an average annual
residential lot construction of 476. The majority (47%) were broadhectare/major infill lots,
closely followed by minor infill lot construction at 45% and 8% rural residential.
In comparison to the annual volume of residential building approvals, residential lot
construction varies considerably. Residential lot construction was the lowest in 2007-08 at
231 lots and ‘peaked’ in 2009-10 at 992 lots. As measured to the March Quarter 2012 there
have been 476 residential lots constructed.
The lot construction variance over-time is a typical trend illustrated from the land
development industry and indicates no significant supply or policy issues.
Graph 3 illustrates the average annual volume of all residential lot production by suburb
URBAN DEVELOPMENT PROGRAM REGIONAL RESIDENTIAL REPORT 2012 - SHIRE OF BASS COAST
[ 12 ]The majority (29%) of residential lot construction activity was located within the suburb of
Cowes, followed by Inverloch (24%) and Wonthaggi/North Wonthaggi (15%).
Lot construction and residential building approval activity as measured from July 2006 to
March 2012 broadly aligns in terms of the identified volume at 476 and 537 respectively per
annum. However the difference infers the construction of dwellings on vacant allotments
constructed prior to July 2006.
Graph 2: Number of Residential Lots Constructed by Supply Type, July 2006 to March 2012
600
500
400
Number of Lots
300
200
100
0
2006-07 2007-08 2008-09 2009-10 2010-11 2011-12
Broadhectare Minor Infill Rural Residential
Source: Spatial Economics Pty Ltd and (former) Department of Planning and Community Development 2012
Graph 3: Average Annual Number of Residential Lots Constructed by Suburb, July 2006 to March 2012
180
160
140
120
Number of Lots
100
80
60
40
20
0
lle
ch
o
es
or
n
on
la
ai
)
gi
gi
.
em
to
ic
vi
el
m
tn
rlo
ag
ag
ow
rs
(V
ys
nt
in
la
n
R
te
ve
th
th
Ve
C
ra
or
al
oo
h
Pa
on
n
on
In
D
ac
G
C
Sa
W
W
W
Be
e
e
ap
th
ap
rf
C
or
Su
C
N
Source: Spatial Economics Pty Ltd and (former) Department of Planning and Community Development, 2012
Note: Includes – broadhectare, major infill, minor infill and rural residential lot construction.
URBAN DEVELOPMENT PROGRAM REGIONAL RESIDENTIAL REPORT 2012 - SHIRE OF BASS COAST
[ 13 ]4.2.1 MINOR INFILL LOT CONSTRUCTION
Minor infill lot construction activity as measured from July 2006 to March 2012 across the
municipal area of Bass Coast averaged 212 lots per annum. This represents 45% of all
residential lot construction activity across the municipal area.
Minor infill lot construction activity was concentrated within the established urban areas of
Cowes, Inverloch and Wonthaggi.
As measured annually from July 2006 to March 2012, the amount of minor infill lot
construction activity has varied significantly. In 2006-07 there were approximately 289
minor infill lots constructed, decreasing to 98 in 2007-08.The level of activity significantly
increased to 542 lots in 2009-10 and subsequently decreased to only 69 lots the following
year. As measured to the March Quarter 2012 there have been 99 minor infill lots
constructed.
Of the 1,219 minor infill lots constructed 42% were constructed on ‘parent’ lots sized less
than 1,200sqm, there were no lots constructed on ‘parent lots less than 500sqm. There
were 383 lots constructed (31%) on parent lots sized from 1,200 to 2,000sqm. Graph 4
summarises the volume of minor infill lot construction by ‘parent’ lot size cohorts.
Graph 4: Parent Lot Size of Minor Infill Lot Subdivision, July 2006 to March 2012
450
400
350
300
Number of Lots
250
200
150
100
50
0
Less than 500 to 800 to 1,200 to 2,000 to 5,000 to
500sqm 800sqm 1,200sqm 2,000sqm 5,000sqm 10,000sqm
Source: Spatial Economics Pty Ltd and (former) Department of Planning and Community Development 2012
Note: Parent lot size refers to the size of the allotment prior to subdivision.
4.2.2 BROADHECTARE & MAJOR INFILL LOT CONSTRUCTION
Broadhectare/Major Infill lot construction activity as measured from July 2006 to March
2012 across the municipal area of Bass Coast averaged 225 lots per annum. This
represents 47% of all residential lot construction activity across the municipal area.
Broadhectare lot construction activity was located mainly in the urban areas of Inverloch,
Cowes and Wonthaggi/North Wonthaggi.
URBAN DEVELOPMENT PROGRAM REGIONAL RESIDENTIAL REPORT 2012 - SHIRE OF BASS COAST
[ 14 ]As measured annually from July 2006 to March 2012, the amount of broadhectare
lot construction activity has varied significantly. In 2006-07 there was approximately
202 broadhectare lots constructed, declining to 111 lots in 2007-08. Broadhectare lot
production rapidly increased to 164 in 2008-09, increasing further to 433 in 2009-10. Since
then lot production has declined to 156 in 2010-11.
As measured to the March Quarter 2012 there have been 229 broadhectare/major infill
lots constructed.
4.2.3 RURAL RESIDENTIAL LOT CONSTRUCTION
Rural Residential lot construction activity as measured from July 2006 to March 2012
across the municipal area of Bass Coast has averaged 39 lots per annum. This represents
8% of all residential lot construction activity across the municipal area.
Of this lot construction activity – 94% was zoned Low Density Residential (LDRZ) and 6%
Rural Living (RLZ). The majority of this subdivision activity was located in the suburb of
Cowes and to a lesser degree, Harmers Haven and San Remo.
From July 2006 to March 2012 there was an average annual residential lot
construction of 476. The majority (47%) were broadhectare/major infill lots, closely
followed by minor infill lot construction at 45% and 8% rural residential.
Residential building approval activity over the same period has averaged 537 per
annum. Of these building approvals the vast majority (92%) have been for
separate houses.
Analysis of the amount of building approvals and residential lot construction
indicates a functioning residential land market within Bass Coast. However, the
disparity between residential dwelling approvals and lot constructed should be
monitored to identify any increasing lot production trends and if not, to investigate if
there are any impediments to the delivery of allotments in the short-term.
URBAN DEVELOPMENT PROGRAM REGIONAL RESIDENTIAL REPORT 2012 - SHIRE OF BASS COAST
[ 15 ]5.0 RESIDENTIAL LAND SUPPLY
This section of the report details the stock (measured in lots) of residential land across the
municipality of Bass Coast as at March 2012. Residential lot stock/supply is presented at a suburb,
Statistical Local Area (SLA) and municipal level. Residential land supply is further analysed by
supply type/location, namely:
• Minor Infill;
• Broadhectare & Major Infill;
• Future Residential; and
• Rural Residential.
For both major infill and broadhectare land supply areas, anticipated lot construction timing is
presented. This refers to the likely timing of lot construction, not dwelling construction.
Table 1 details the residential land supply, measured in lots, by supply type across the municipal
area of Bass Coast as at March 2012. In total (excluding minor infill) there is a residential lot
supply of approximately 10,025. This is comprised of:
• 5,580 zoned broadhectare/major infill lots (57% of supply);
• 194 vacant rural residential lots (2% of supply); and
• 4,251 designated future residential lots (41% of supply).
Each of the supply types are further detailed below, including maps of each of the supply type,
including the location of recent residential lot construction activity.
URBAN DEVELOPMENT PROGRAM REGIONAL RESIDENTIAL REPORT 2012 - SHIRE OF BASS COAST
[ 16 ]Table 1: Residential Lot Potential by Supply Type, March 2012
No Estimated Yield
Lots (Area hectares)
Broad Rural Future Broad Future
SLA/Suburb/LGA hectare Residential (unzoned) Total Lots hectare (unzoned)
Bass Coast (S) - Phillip Is. 1,502 27 77 1,606 0 0
Cape Woolamai 64 0 0 64 0 0
Cowes 1,020 8 0 1,028 0 0
Rhyll 48 0 77 125 0 0
Silverleaves 0 4 0 4 0 0
Sunset Strip (Vic.) 0 2 0 2 0 0
Surf Beach (Vic.) 0 4 0 4 0 0
Ventnor (Vic.) 370 9 0 379 0 0
Bass Coast (S) Bal 4,078 167 4,174 8,419 14.9 34.7
Bass 0 1 0 1 0 0
Corinella (Vic.) 60 3 270 333 0 0
Coronet Bay 231 0 0 231 0 0
Dalyston 233 0 0 233 3.7 0
Grantville 400 19 0 419 0 0
Harmers Haven 0 20 0 20 0 0
Inverloch 802 28 920 1,750 0 0
Kilcunda 124 5 0 129 1.1 0
North Wonthaggi 127 12 0 139 0 0
San Remo (Vic.) 406 41 0 447 10.0 34.7
The Gurdies 0 9 0 9 0 0
Wattle Bank 1,582 10 2,354 3,946 0 0
Wonthaggi 113 18 630 761 0 0
Woolamai 0 1 0 1 0 0
Bass Coast (S) 5,580 194 4,251 10,025 14.9 34.7
Source: Spatial Economics Pty Ltd and (former) Department of Planning and Community Development 2012
Note: Rural Residential supply refers to vacant (as at 2009) LDRZ and RLZ zoned allotments.
5.1 MINOR INFILL SUPPLY
A parcel by parcel assessment was undertaken to identify minor infill supply, specifically
zoned vacant allotments sized less than one hectare. The assessment is based on the
latest aerial imagery of December 2009. The identification of vacant allotments sized less
than one hectare does not provide an estimated dwelling yield. Rather it simply identifies
the vacant allotment by lot size and location.
Dwelling yields on such allotments can vary significantly, examples range from:
• 800sqm vacant allotment within a broadhectare estate typically would yield one
dwelling;
• 800sqm vacant allotment within the urban centre, could typically range from one to four
dwellings; and
• 5,000sqm allotment within a township zone (un-sewered) one dwelling versus anything
from five plus dwellings within a larger urban settlement.
URBAN DEVELOPMENT PROGRAM REGIONAL RESIDENTIAL REPORT 2012 - SHIRE OF BASS COAST
[ 17 ]As at December 2009, there was 2,509 minor infill lots identified. Of these lots, 2,314 were
sized less than 1,200sqm or 92% of the identified lots. In addition there were:
• 113 vacant lots sized between 1,200 to 2,000sqm;
• 68 lots sized from 2,000sqm to 5,000sqm; and
• 14 lots sized from 5,000 to 10,000sqm.
Graph 5 summarises the size distribution of identified minor infill supply.
All of these allotments have potential to yield multiple lots post subdivision. As noted
previously 45% of lot construction activity across Bass Coast was minor infill, and of this lot
construction, 42% was from parent lots sized 1,200sqm or less.
The majority of minor infill supply is located in the suburbs of:
• Cowes – 538 lots;
• Inverloch – 435 lots;
• Corinella – 136 lots; and
• Surf Beach – 134 lots.
Graph 5: Minor Infill Supply – Number of Vacant Zoned Residential Allotments, by Lot Size Cohort, 2009
1,800
1,600
1,400
1,200
Number of Lots
1,000
800
600
400
200
0
Less than 500 to 800 to 1,200 to 2,000 to 5,000 to
500sqm 800sqm 1,200sqm 2,000sqm 5,000sqm 10,000sqm
Source: Spatial Economics Pty Ltd and (former) Department of Planning and Community Development 2012
URBAN DEVELOPMENT PROGRAM REGIONAL RESIDENTIAL REPORT 2012 - SHIRE OF BASS COAST
[ 18 ]5.2 BROADHECTARE & MAJOR INFILL SUPPLY
As at March 2012, there was a residential lot capacity within broadhectare areas of
approximately 5,580 of which 33% (1,822 lots) is located in Wonthaggi/North Wonthaggi/
Wattle Bank, 18% (1,020 lots) in Cowes and 14% (802 lots) in Inverloch. Table 2 identifies the
lot yield and estimated development timing of zoned broadhectare lot stock.
Table 2: Anticipated Lot Construction Activity – Broadhectare/Major Infill, 2012
Zoned Lot Potential
Potential Total Lots
1-2 3-5 6-10 11+ No Total Zoned Residential (zoned/
SLA/LGA years years years years Timing2 Stocks (unzoned) un-zoned)
Bass Coast (S) - 421 372 533 0 176 1,502 77 1,579
Phillip Is.
Bass Coast (S) Bal 888 878 1,118 630 564 4,078 4,174 8,252
Bass Coast (S) 1,309 1,250 1,651 630 740 5,580 4,251 9,831
2
The no timing status identifies potential broadhectare land stocks but do not attempt to estimate potential
development timing.
Source: Spatial Economics Pty Ltd and (former) Department of Planning and Community Development 2012
Zoned broadhectare lot potential represents 57% of the total existing residential land
supply across the municipal area of Bass Coast.
Based on existing planning permits, recent construction activity and Council feedback it is
anticipated that over the next five years, on average 602 lots per annum will be constructed
within existing zoned broadhectare areas. Over the 6-10 year period only 1,651 lots in total
are anticipated to be constructed, this is primarily due to the stock of zoned broadhectare
land being largely consumed over the next five years.
However, recent broadhectare lot construction activity across the municipality has averaged
225 per annum, a significant difference in terms of anticipated construction levels.
In addition, there is a broadhectare lot stock of 740 that no development timing has been
attributed. This stock is located in Grantville, Inverloch, Cowes and Kilcunda.
NO YIELD
A total 15 hectares (4 lots) of zoned vacant land over one hectare in size has been identified
that has the potential for broadhectare subdivision. However, these parcels are typically in
low demand areas, zoned Township (TZ) and in many instances un-sewered. Suburbs that
have relatively high levels of this land stock form include:
• San Remo – 10 hectares;
• Dalyston – 4 hectares; and
• Kilcunda – 1 hectare.
This potential residential land supply source has deliberately been excluded from a lot yield
and timing perspective as it is considered unlikely that any significant volume of subdivision
activity will occur within the sites.
5.3 FUTURE RESIDENTIAL LAND SUPPLY
Analysis has been undertaken in conjunction with municipal planning officers to identify
the location and associated lot yield of future residential land stocks. Future residential
land stocks are identified by the Bass Coast Shire Council, and contained within various
municipal planning policy and strategy planning documents.
URBAN DEVELOPMENT PROGRAM REGIONAL RESIDENTIAL REPORT 2012 - SHIRE OF BASS COAST
[ 19 ]Future residential land stocks are not zoned to support immediate ‘normal’ residential
development, and rezoning and structure planning processes are required before normal
residential development proceeds.
Locations which face natural hazards (such as fire, flood and landslide) need to be
assessed as part of the decision making associated with a proposed rezoning change.
Within the municipal area of Bass Coast, there is an estimated lot potential within Future
Residential areas of approximately 4,251. Of this lot potential:
• 2,354 lots are located in Wattle Bank;
• 920 lots are located in Inverloch;
• 630 lots are located in Wonthaggi;
• 270 lots are located in Corinella; and
• 77 lots are located in Rhyll.
In addition to the above ‘future residential’ land stocks there are additional supply areas
that have not been assessed in terms of potential lot yield. This potential residential land
supply is located in San Remo and is approximately 35 hectares in size.
5.4 RURAL RESIDENTIAL ALLOTMENTS
The stock of both occupied and vacant rural residential allotments have been determined
on a lot by lot basis as at December 2009. A Rural Residential allotment is defined as all
allotments that are zoned Low Density Residential (LDRZ) and Rural Living (RLZ). Occupied
is defined as evidence of a ‘habitable’ dwelling and vacant is defined as no evidence of a
habitable dwelling via the interpretation of aerial imagery.
As at December 2009 across the municipality of Bass Coast there was a total lot stock of
rural residential allotments of 659. Of this stock, 194 lots were vacant, a lot vacancy rate
of 29%. Graph Six summarises the stock of both occupied and vacant rural residential
allotments by suburb.
By zone type, as at December 2009 there were 454 Low Density Residential (LDRZ)
allotments, of which 149 were vacant across the municipality, a lot vacancy of 33%. In
comparison, there were a total of 205 Rural Living (RLZ) zoned allotments, of which 45
were vacant – a lot vacancy rate of 22%.
The location of the majority of rural residential lots across the municipality includes:
• Inverloch - total 90 lots (lot vacancy of 31%);
• Wattle Bank - total 71 lots (lot vacancy of 14%);
• North Wonthaggi - total 70 lots (lot vacancy of 17%);
• San Remo - total 66 lots (lot vacancy of 62%);
• Grantville - total 63 lots (lot vacancy of 30%); and
• Wonthaggi - total 56 lots (lot vacancy of 32%).
URBAN DEVELOPMENT PROGRAM REGIONAL RESIDENTIAL REPORT 2012 - SHIRE OF BASS COAST
[ 20 ]Graph 6: Stock of Vacant and Occupied ‘rural residential’ Allotments, 2009
100
90
Vacant Lots Occupied Lots
80
70
Number of Lots
60
50
40
30
20
10
0
o
en
es
Ve s
es
rip
ch
ch
nk
la
lle
ll
ss
da
r
gi
gi
ai
em
no
e
hy
el
ag
ag
m
di
av
ow
rlo
av
vi
ea
Ba
St
Ba
un
nt
in
R
nt
ur
la
R
th
le
th
H
ve
B
C
et
lc
or
tle
ra
oo
G
n
er
on
on
Ki
s
rf
ns
In
C
Sa
G
er
at
W
e
Su
lv
W
W
Su
Th
W
Si
m
th
ar
or
H
N
Source: Spatial Economics Pty Ltd and (former) Department of Planning and Community Development 2012
Future rural residential (LDRZ and or RLZ) unzoned areas have been identified through
Council consultation and are geographically identified in the accompanying maps. In
summary a total of 97 hectares of future rural residential land stocks have been identified,
of which 86 hectares is future LDRZ and 11 hectares is for future RLZ. The location of the
future rural residential land stocks is detailed in Table 12.
URBAN DEVELOPMENT PROGRAM REGIONAL RESIDENTIAL REPORT 2012 - SHIRE OF BASS COAST
[ 21 ]In total (excluding minor infill) there is a residential lot supply of approximately
10,025. This is comprised of:
• 5,580 zoned broadhectare/major infill lots (57% of supply);
• 194 vacant rural residential lots (2% of supply); and
• 4,251 designated future residential lots (41% of supply).
As at December 2009, there was 2,509 minor infill lots identified. Of these lots, 2,314
were sized less than 1,200sqm or 92% of the identified lots.
As at March 2012, there was a residential lot capacity within broadhectare areas
of approximately 5,580 of which 33% (1,822 lots) is located in Wonthaggi/North
Wonthaggi/Wattle Bank, 18% (1,020 lots) in Cowes and 14% (802 lots) in Inverloch.
Based on existing planning permits, recent construction activity and Council
feedback it is anticipated that over the next five years, on average 602 lots per
annum will be constructed within existing zoned broadhectare areas.
However, recent broadhectare lot construction activity across the municipality
has averaged 225 per annum, a significant difference in terms of anticipated
construction levels.
Within the municipal area of Bass Coast, there is an estimated lot potential within
Future Residential areas of approximately 4,251. In addition to the above ‘future
residential’ land stocks there are additional supply areas that have not been
assessed in terms of potential lot yield. This potential residential land supply is
located in San Remo and is approximately 35 hectares in size.
As at December 2009 across the municipality of Bass Coast there was a total lot
stock of rural residential allotments of 659. Of this stock, 194 lots were vacant, a lot
vacancy rate of 29%.
A total of 97 hectares of future rural residential land stocks have been identified.
URBAN DEVELOPMENT PROGRAM REGIONAL RESIDENTIAL REPORT 2012 - SHIRE OF BASS COAST
[ 22 ]6.0 PROJECTED DEMAND
This report incorporates the most recently available demand figures to project dwelling
requirements and future adequacy of residential land. These figures currently use
published population and household projections contained in Victoria in Future 2012
undertaken by the (former) Department of Planning and Community Development as the
basis for projected dwelling requirements
Victoria in Future 2012 is the Victorian Government’s official population and household
projections. Information is provided for state-wide, regional and metropolitan areas as well
as local government areas. Victoria in Future 2012 reflects the latest available trends such
as changes to levels of immigration or economic conditions, or changes to policy affecting
population growth locations and levels, and subsequent demand for housing.
Graph 7 summarises the projected demand for residential dwellings for the municipal
area of Bass Coast. In addition, it highlights historic ‘expressed’ demand for residential
dwellings in the form of residential building approvals and lot construction.
Projected dwelling requirements sourced from Victoria in Future 2012 indicate that from
2011 to 2026 there will be a total dwelling requirement of 11,289 (753 average per annum).
For specific time cohorts average annual dwelling requirements include:
• 2011 to 2016 - 725;
• 2016 to 2021 - 753; and
• 2021 to 2026 - 780.
As measured from 2011 to 2026, the average annual projected demand by SLA within the
municipality of Bass Coast is:
Phillip Island: 256 dwellings per annum (e.g. Cowes, Surf Beach, Ventnor); and
Balance: 496 dwellings per annum (e.g. Inverloch, Wonthaggi, Cape Paterson).
An alternative demand projection has been developed that is based on recent (2006 to 2012)
building approval activity – a measure of expressed demand, in conjunction with growth
rates identified in the State Governments’ projections. In summary, utilising this growth
rate scenario results in average dwelling requirements of:
• 2011 to 2016 - 537;
• 2016 to 2021 - 557; and
• 2021 to 2026 - 578.
This growth scenario results in a 26% (2,928 dwellings) decrease in total dwelling
requirements from 2011 to 2026.
URBAN DEVELOPMENT PROGRAM REGIONAL RESIDENTIAL REPORT 2012 - SHIRE OF BASS COAST
[ 23 ]Graph 7: Historic and Projected Demand for Residential Dwellings, 2006 to 2026
1200
1000
Number of Lots/Dwellings
800
600
400
200
0
7
8
9
0
3
4
5
6
7
8
9
0
1
2
3
4
5
6
1
12
/1
/0
/0
/0
/1
/1
/1
/1
/1
/1
/1
/1
/2
/2
/2
/2
/2
/2
/2
/
10
06
07
08
09
12
13
14
15
16
17
18
19
20
21
22
23
24
25
11
Building Approvals Lot Construction Dwelling Projections
Source: (former) Department of Planning and Community Development Victoria in Future 2012
Australian Bureau of Statistics, Catalogue No.8731.0
Spatial Economics Pty Ltd
Projected dwelling requirements sourced from the State Governments Population
and Household Projections (Victoria in Future 2012) indicate that from 2011 to 2026
there will be a total dwelling requirement of 11,289 (753 average per annum). For
specific time cohorts average annual dwelling requirements include:
• 2011 to 2016 - 725;
• 2016 to 2021 - 753; and
• 2021 to 2026 - 780.
An alternative demand projection has been developed that is based on recent (2006
to 2012) building approval activity – a measure of expressed demand, in conjunction
with growth rates identified in the State Governments’ projections. In summary,
utilising this growth rate scenario results in average dwelling requirements of:
• 2011 to 2016 - 537;
• 2016 to 2021 - 557; and
• 2021 to 2026 - 578.
This growth scenario results in a 26% (2,928 dwellings) decrease in total dwelling
requirements from 2011 to 2026.
URBAN DEVELOPMENT PROGRAM REGIONAL RESIDENTIAL REPORT 2012 - SHIRE OF BASS COAST
[ 24 ]7.0 YEARS OF SUPPLY – RESIDENTIAL LAND
Analysis has been undertaken to estimate the years of residential land supply by Statistical
Local Area. In estimating the years of residential land supply only major infill, zoned
broadhectare and future residential land supply types are considered. In assessing the
estimated years of supply, the demand component for the above supply types are estimated
via the assessment of historic consumption.
The Population and Household Projections 2011-2031 for Victoria, outlined in Victoria
in Future 2012, are used by the Regional Urban Development Program as the basis
for determining projected demand for residential allotments. Demand information is
assessed at both a municipal level and by the component Statistical Local Areas (SLAs). An
alternative demand scenario is presented based on historic building approval activity.
Based on historic (July 2006 to March 2012) lot construction activity it is estimated
that within the Bass Coast (S) - Phillip Is. SLA 35% of dwelling requirements was for
broadhectare/major infill allotments and 55% within the Bass Coast (S) Bal SLA.
Table 3 summarises the estimated years of supply by demand scenario for major infill and
broadhectare stocks combined.
YEARS OF SUPPLY – VICTORIA IN FUTURE 2012 DEMAND SCENARIO
In terms of zoned broadhectare and major infill residential land stocks it is estimated based
on the identified supply and projected demand, there are sufficient land stocks to satisfy
15 years of future demand.
Zoned broadhectare and major infill supply by SLA is sufficient to satisfy demand for:
• 15 years: Bass Coast (S) - Phillip Is. SLA; and
• 15 years: Bass Coast (S) Bal SLA.
In terms of future residential land supply stocks, there is sufficient land to satisfy 10 years
of projected demand across the municipal area. Unzoned broadhectare supply by SLA is
sufficient to satisfy demand for:
• 14 years: Bass Coast (S) Bal SLA.
YEARS OF SUPPLY – HISTORIC TREND BASED DEMAND SCENARIO
In terms of zoned broadhectare and major infill residential land stocks it is estimated based
on the identified supply and projected demand, there are sufficient land stocks to satisfy
15+ years of future demand.
Zoned broadhectare and major infill supply by SLA is sufficient to satisfy demand for:
• 15+ years: Bass Coast (S) - Phillip Is. SLA; and
• 15+ years: Bass Coast (S) Bal SLA.
In terms of future residential land supply stocks, there is sufficient land to satisfy 15+ years
of projected demand. Unzoned broadhectare supply by SLA is sufficient to satisfy
demand for:
• 15+ years: Bass Coast (S) Bal SLA.
URBAN DEVELOPMENT PROGRAM REGIONAL RESIDENTIAL REPORT 2012 - SHIRE OF BASS COAST
[ 25 ]You can also read