Relationship Between Major Depression Symptom Severity and Sleep Collected Using a Wristband Wearable Device: Multicenter Longitudinal ...
←
→
Page content transcription
If your browser does not render page correctly, please read the page content below
JMIR MHEALTH AND UHEALTH                                                                                                                        Zhang et al

     Original Paper

     Relationship Between Major Depression Symptom Severity and
     Sleep Collected Using a Wristband Wearable Device: Multicenter
     Longitudinal Observational Study

     Yuezhou Zhang1, MSc; Amos A Folarin1,2,3, PhD; Shaoxiong Sun1, PhD; Nicholas Cummins1, PhD; Rebecca
     Bendayan1,3, PhD; Yatharth Ranjan1, MSc; Zulqarnain Rashid1, PhD; Pauline Conde1, BSc; Callum Stewart1, MSc;
     Petroula Laiou1, PhD; Faith Matcham4, PhD; Katie M White4, BSc; Femke Lamers5, PhD; Sara Siddi6,7,8, PhD; Sara
     Simblett9, PhD, DClinPsy; Inez Myin-Germeys10, PhD; Aki Rintala10,11, MSc; Til Wykes3,9, PhD; Josep Maria Haro6,7,8,
     MD; Brenda WJH Penninx5, PhD; Vaibhav A Narayan12, PhD; Matthew Hotopf3,4, PhD; Richard JB Dobson1,2,3, PhD;
     RADAR-CNS Consortium13
     1
      Department of Biostatistics & Health Informatics, Institute of Psychiatry, Psychology and Neuroscience, King's College London, London, United
     Kingdom
     2
      Institute of Health Informatics, University College London, London, United Kingdom
     3
      South London and Maudsley National Health Services Foundation Trust, London, United Kingdom
     4
      Department of Psychological Medicine, Institute of Psychiatry, Psychology and Neuroscience, King's College London, London, United Kingdom
     5
      Department of Psychiatry, Amsterdam Public Health Research Institute and Amsterdam Neuroscience, Amsterdam University Medical Centre, Vrije
     Universiteit and GGZ inGeest, Amsterdam, Netherlands
     6
      Teaching Research and Innovation Unit, Parc Sanitari Sant Joan de Déu, Fundació Sant Joan de Déu, Barcelona, Spain
     7
      Centro de Investigación Biomédica en Red de Salud Mental, Madrid, Spain
     8
      Faculty of Medicine and Health Sciences, Universitat de Barcelona, Barcelona, Spain
     9
      Department of Psychology, Institute of Psychiatry, Psychology and Neuroscience, King's College London, London, United Kingdom
     10
          Center for Contextual Psychiatry, Department of Neurosciences, Katholieke Universiteit Leuven, Leuven, Belgium
     11
          Faculty of Social Services and Health Care, LAB University of Applied Sciences, Lahti, Finland
     12
          Janssen Research and Development LLC, Titusville, NJ, United States
     13
          see Acknowledgments

     Corresponding Author:
     Richard JB Dobson, PhD
     Department of Biostatistics & Health Informatics
     Institute of Psychiatry, Psychology and Neuroscience
     King's College London
     SGDP Centre, IoPPN, Box PO 80
     De Crespigny Park, Denmark Hill
     London
     United Kingdom
     Phone: 44 20 7848 0473
     Email: richard.j.dobson@kcl.ac.uk

     Abstract
     Background: Sleep problems tend to vary according to the course of the disorder in individuals with mental health problems.
     Research in mental health has associated sleep pathologies with depression. However, the gold standard for sleep assessment,
     polysomnography (PSG), is not suitable for long-term, continuous monitoring of daily sleep, and methods such as sleep diaries
     rely on subjective recall, which is qualitative and inaccurate. Wearable devices, on the other hand, provide a low-cost and
     convenient means to monitor sleep in home settings.
     Objective: The main aim of this study was to devise and extract sleep features from data collected using a wearable device and
     analyze their associations with depressive symptom severity and sleep quality as measured by the self-assessed Patient Health
     Questionnaire 8-item (PHQ-8).

     https://mhealth.jmir.org/2021/4/e24604                                                                JMIR Mhealth Uhealth 2021 | vol. 9 | iss. 4 | e24604 | p. 1
                                                                                                                         (page number not for citation purposes)
XSL• FO
RenderX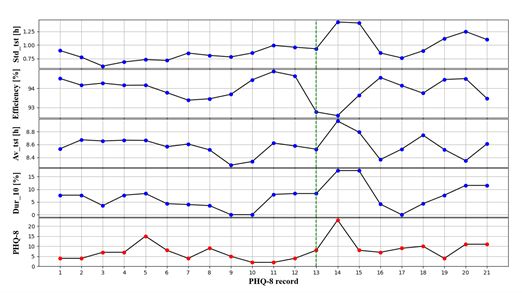
JMIR MHEALTH AND UHEALTH                                                                                                             Zhang et al

     Methods: Daily sleep data were collected passively by Fitbit wristband devices, and depressive symptom severity was self-reported
     every 2 weeks by the PHQ-8. The data used in this paper included 2812 PHQ-8 records from 368 participants recruited from 3
     study sites in the Netherlands, Spain, and the United Kingdom. We extracted 18 sleep features from Fitbit data that describe
     participant sleep in the following 5 aspects: sleep architecture, sleep stability, sleep quality, insomnia, and hypersomnia. Linear
     mixed regression models were used to explore associations between sleep features and depressive symptom severity. The z score
     was used to evaluate the significance of the coefficient of each feature.
     Results: We tested our models on the entire dataset and separately on the data of 3 different study sites. We identified 14 sleep
     features that were significantly (P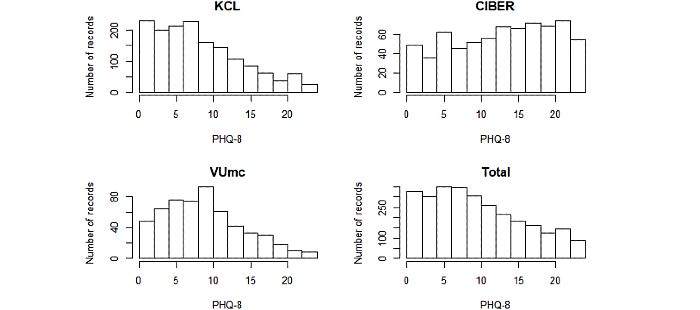
JMIR MHEALTH AND UHEALTH                                                                                                                Zhang et al

     of remote measurement technologies to monitor people with              PHQ-8 Data
     depression, epilepsy, and multiple sclerosis in real-world             The variability of each participant’s depressive symptom
     settings. The study protocol for the depression component              severity was measured via the PHQ-8, conducted by mobile
     (Remote Assessment of Disease and Relapse–Major Depressive             phone every 2 weeks. The questionnaire contains 8 questions,
     Disorder [RADAR-MDD]) is described in detail in Matcham                with the score of each subitem ranging from 0 to 3. The total
     et al [23]. The RADAR-MDD project aims to recruit 600                  score (range 0 to 24) of all subitems is the PHQ-8 score, which
     participants with a recent history of depression in 3 study sites      can evaluate depressive symptom severity of the participant for
     (King’s College London [KCL], UK; Vrije Universiteit Medisch           the past 2 weeks. A PHQ-8 score ≥10 is the most commonly
     Centrum [VUMC], Amsterdam, The Netherlands; and Centro                 recommended cutpoint for clinically significant depressive
     de Investigación Biomédican en Red [CIBER], Barcelona,                 symptoms [26] (ie, if the PHQ-8 of a participant is ≥10, the
     Spain). Recruitment procedures vary slightly across sites and          participant is likely to have had depressive symptoms in the
     eligible participants are identified either through existing           previous 2 weeks). In the PHQ-8, subitem 3 refers to sleep. The
     research cohorts (in KCL and VUmc) who had given consent               content of subitem 3 is “Trouble falling or staying asleep, or
     to be contacted for research purposes; advertisements in general       sleeping too much” [26]. A higher score in subitem 3 indicates
     practices, psychologist practices, newspapers, and                     worse self-reported sleep in the past 2 weeks. For reading
     Hersenonderzoek.nl [24], which is a Dutch online registry              convenience, we denoted the score of subitem 3 as the sleep
     (VUmc); or through mental health services (in KCL and CIBER)           subscore in this paper.
     [23]. Participants from KCL and VUmc are community-based,
     while the participants from CIBER come from a clinical                 Sociodemographics
     population. As part of the study, participants are asked to install    Sociodemographic of participants were collected during the
     several remote monitoring technology apps and use an activity          enrollment session. According to previous studies on the
     tracker for up to 2 years of follow-up. Many categories of             associations between depression and sociodemographic
     passive and active data are being collected and uploaded to an         characteristics [30,31], we considered baseline age, gender,
     open-source platform, RADAR-base [25]. In this paper, we               education level, and annual income as potential confounding
     focus on the sleep and Patient Health Questionnaire 8-item             variables in our analyses. Due to the different educational
     (PHQ-8) data [26].                                                     systems in different countries, we simply divided the education
     Sleep Data                                                             level into 2 levels: degree (or above) and below degree. The
                                                                            annual income levels of Spain and the Netherlands were
     According to the American Academy of Sleep Medicine manual             transformed into equivalent British levels.
     for the scoring of sleep and associated events, sleep can be
     divided into 2 phases, REM sleep and non-REM (NREM) sleep,             Feature Extraction
     and NREM sleep can be subdivided into N1, N2, and N3 stages
                                                                            Feature Window Size
     according to characteristic patterns of brain waves collected by
     PSG [11]. In our project, the daily sleep records of participants      For each PHQ-8 record, we extracted sleep features from a
     were collected by the Charge 2 or Charge 3 (Fitbit Inc). An            2-week time window prior to the PHQ-8 completion time, as
     entire night’s sleep is divided into 4 stages: awake, light, deep,     the PHQ-8 score is used to represent the depressive symptom
     and REM. The light stage provides estimates for the N1 and N2          severity of the participant for the past 2 weeks. The feature
     stages in PSG, while the deep stage provides estimates for the         window is denoted as ∆t in this paper.
     N3 stage in PSG. According to several validation studies of            Sleep Features
     Fitbit, the Fitbit wristband had limited specificity in sleep stages
     estimation [27-29]. Therefore, in this study, we were not              According to known sleep pathology and our experience, 18
     expecting the Fitbit devices to provide information as accurate        sleep features extracted in this paper were divided into the
     as PSG would have provided. However, the Fitbit devices were           following 5 categories (Table 1): sleep architecture, representing
     deemed sensitive enough to detect changes in sleep-wake states         the basic and cyclical patterns of sleep; sleep stability,
     [27-29]; therefore, the provided sleep stage information could         representing the variance of sleep in the feature window; sleep
     be used to determine estimates for detailed sleep parameters           quality, measures relating to total sleep and wake times;
     based on known sleep pathology.                                        insomnia, trouble falling or staying asleep; and hypersomnia,
                                                                            excessive sleepiness.

     https://mhealth.jmir.org/2021/4/e24604                                                        JMIR Mhealth Uhealth 2021 | vol. 9 | iss. 4 | e24604 | p. 3
                                                                                                                 (page number not for citation purposes)
XSL• FO
RenderX
JMIR MHEALTH AND UHEALTH Zhang et al
Table 1. A list of sleep features used in this study and their short descriptions.
Features Description Unit
Sleep architecture
Av_tst Mean total sleep time Hour
Av_time_bed Mean time in bed Hour
Deep_pct Mean percentage of deep sleep %
Light_pct Mean percentage of light sleep %
REM_pct Mean percentage of REMa sleep %
NREM_pct Mean percentage of NREMb sleep %
Awake_pct Mean percentage of awake time %
Av_onset Mean sleep onset time Hour
Av_offset Mean sleep offset time Hour
REM_L Mean REM latency time Hour
Sleep stability
Std_tst Standard deviation of total sleep time Hour
Std_onset Standard deviation of sleep onset time Hour
Std_offset Standard deviation of sleep offset time Hour
Sleep quality
Efficiency Mean sleep efficiency %
Awake_5 Mean number of awakenings (>5 minutes) per night Times
WKD_diff Total sleep time difference between weekend and weekdays Hour
Insomnia
M_insomnia Percentage of days with potential middle insomnia %
Hypersomnia
Dur_10 Percentage of days with total sleep time >10 hours %
a
REM: rapid eye movement.
b
Non-REM: non–rapid eye movement.
respectively. The combination of deep and light sleep is NREM
Sleep Architecture
sleep. The mental activity that occurs in NREM and REM sleep
The features of sleep architecture were intended to describe the is a result of 2 different mind generators, which also explains
basic and cyclical patterns of sleep. Therefore, we extracted the difference in mental activity [35]. So, we extracted the mean
some features similar to those in the PSG report (total sleep percentage of NREM sleep in ∆t, which was denoted as
time, time in bed, sleep onset time, sleep offset time, and REM NREM_pct. We calculated the mean sleep onset time (the first
latency) [32], and features of the percentages of all sleep stages. nonawake stage) in ∆t, denoted as Av_onset. Mean sleep offset
Total sleep time of one night is defined as the sum of all time (the last nonawake stage) in ∆t was calculated and denoted
nonawake stages (light, deep, and REM) [32]. The mean total as Av_offset. Previous literature has shown that shortened REM
sleep time in ∆t was denoted as Av_tst. Time in bed of one night latency can be considered as a biological mark of depression
is defined as the sum of all sleep stages (awake, light, deep, and relapse [9]. REM latency is defined as the interval between
REM) of the entire night [32]. The mean time in bed in ∆t was sleep onset and occurrence of the first REM stage. The mean
denoted as Av_time_bed. Percentage of each sleep stage is REM latency in ∆t was denoted as REM_L.
defined as the percentage of the time in the sleep stage to the
time in bed of the entire night. Different sleep stages have Sleep Stability
different functions and can reflect the quality of sleep. Deep The features in this category were used to estimate the variance
sleep is considered essential for memory consolidation [33], of sleep during ∆t. We extracted the standard deviation of total
and REM sleep favors the preservation of memory [34]. A sleep time, sleep onset time, and sleep offset time in ∆t, which
previous sleep report has shown that more deep sleep and fewer were denoted as Std_tst, Std_onset, and Std_offset, respectively.
awakenings represent better sleep quality [32]. Therefore, we
extracted the mean percentages of these 4 sleep stages in ∆t,
and denoted them as Deep_pct, Light_pct, REM_pct, Awake_pct,
https://mhealth.jmir.org/2021/4/e24604 JMIR Mhealth Uhealth 2021 | vol. 9 | iss. 4 | e24604 | p. 4
(page number not for citation purposes)
XSL• FO
RenderXJMIR MHEALTH AND UHEALTH Zhang et al
Sleep Quality Statistical Analyses
In this paper, we used features of sleep efficiency, awakenings, In our study, each participant had multiple PHQ-8 records and
and weekend catch-up sleep to describe sleep quality. The repeated sleep measures. For this reason, we used linear mixed
definition of sleep efficiency is the percentage of total sleep models, which allow for accounting of both within and
time to time in bed [32]. Mean sleep efficiency in ∆t was between-individual variability over time [43]. For each sleep
denoted as Efficiency. The definition of awakenings (>5 minutes) feature, a 3-level linear mixed model with a participant-specific
for one night is the number of episodes in which an individual random intercept and a site-specific random intercept was built
is awake for more than 5 minutes [32]. The average number of on the entire dataset to explore the association between this
awakenings in ∆t was denoted as Awake_5. Weekend catch-up sleep feature and depressive symptom severity (PHQ-8) by
sleep is an indicator of insufficient weekday sleep, which might bivariate analysis. We then used 2-level linear mixed models
be associated with depression level [36]. A longer total sleep with participant-specific random intercepts to test these
time during the weekend compared with weekdays may reflect associations on the 3 subsets (KCL, CIBER, and VUmc)
the actual sleep needed [37]. Therefore, we calculated the mean separately. We similarly analyzed the associations between
total sleep time difference between weekend and weekdays in sleep features and sleep subscore. All models were adjusted for
∆t, which was denoted as WKD_diff. baseline age, gender, education level, and annual income, which
Insomnia were specified as fixed effects. Model assumptions were checked
by the histograms of residuals and Q-Q plots. If the residuals
A review of several longitudinal studies suggested that insomnia are not normally distributed, the Box-Cox transformation was
is bidirectionally related to depression [6]. According to the performed [44]. The z score was used to evaluate the statistical
diagnostic features provided in the Diagnostic and Statistical significance of the coefficient of each model. All P values of
Manual of Mental Disorders, Fifth Edition [38], insomnia these tests were corrected by using the Benjamini-Hochberg
manifests as initial insomnia (difficulty initiating sleep at method [45] for multiple comparisons, and the significance
bedtime), middle insomnia (frequent or prolonged awakening level of the corrected P value was set to .05. All linear mixed
throughout the night), and late insomnia (early-morning models were implemented by using the lme4 package for R
awakening with an inability to return to sleep). software version 3.6.1 (R Foundation for Statistical Computing).
For initial insomnia and late insomnia, mean sleep onset time In order to identify and compare the relationship between
(Av_onset) and sleep offset time (Av_offset) can be used to self-reported sleep and self-reported depression among different
partially reflect them, respectively. We define potential middle study sites, Spearman correlations were calculated between the
insomnia to be whether the total sleep time is less than 6 hours PHQ-8 score and sleep subscore on the 3 study sites separately.
and there is at least one prolonged awakening (≥30 minutes)
during the night. The percentage of days with potential middle An example of such a 3-level linear mixed model is as follows:
insomnia in the feature window was denoted as M_Insomnia. Sleepijk = δ000 + V00k + U0jk + β1(PHQ8ijk) + β2(agejk)
Hypersomnia + β3(genderjk) + β4(educationjk) + β5(incomejk) + εijk
Hypersomnia can be another symptom of depression [7]. The
where PHQ8ijk is the ith PHQ-8 score of the participant j of the
hypersomnia criteria used in Tam et al [39] is sleeping more
than 10 hours per day, 3 days per week. In this paper, the site k, Sleepijk is one sleep feature extracted in ∆t before the ith
percentage of days with total sleep time greater than 10 hours PHQ-8 record of the participant j of the site k, agejk, genderjk ,
was extracted in ∆t and denoted as Dur_10. educationjk, and incomejk are potential confounding variables
Statistical Method of the participant j of the site k, εijk is the residual, δ000 is the
fixed effect on intercept, U0jk is the random intercept of the
Data Inclusion Criteria participant j in the site k, and V00k is the random intercept of
Sleep and PHQ-8 records were missing in our data cohort for the site k.
a variety of expected reasons, including the participants not
wearing the Fitbit wristband when they slept, participants Results
forgetting to complete the PHQ-8, and the Fitbit wristband being
damaged during follow-up. We, therefore, specified the Data Summary
following inclusion criteria: (1) PHQ-8 record should be
According to our data inclusion criteria, from June 2018 to
completed (ie, participant answered all 8 questions in the
February 2020, 2812 PHQ-8 records from 368 participants
questionnaire); (2) number of days with sleep records in the
collected from 3 study sites were included for our analysis. A
feature window should be at least 12 days (approximately 85%
summary of the sociodemographic characteristics of these
of the feature window size) [40]; (3) number of PHQ-8 records
participants at baseline and scores of all PHQ-8 records is shown
for each participant should be greater than or equal to 3 [41];
in Table 2. The Kruskal-Wallis test was used to determine
(4) date of PHQ-8 records should be before February 2020,
whether there were any significant differences for these
because the impact of the COVID-19 pandemic on sleep needs
characteristics between the sites. These tests revealed that,
to be excluded [42].
except for gender, sociodemographic characteristics and
distribution of PHQ-8 scores differed between the study sites.
The histograms of PHQ-8 scores of the study sites and the entire
https://mhealth.jmir.org/2021/4/e24604 JMIR Mhealth Uhealth 2021 | vol. 9 | iss. 4 | e24604 | p. 5
(page number not for citation purposes)
XSL• FO
RenderXJMIR MHEALTH AND UHEALTH Zhang et al
dataset are shown in Figure 1. We can observe that the KCL Spearman correlation analysis; we can observe there was a
site had the most PHQ-8 records among the sites. PHQ-8 scores strong positive correlation between the sleep subscore and
from the CIBER site were relatively high, probably because PHQ-8 score (r=.73, z=54.48, PJMIR MHEALTH AND UHEALTH Zhang et al
Figure 1. Histograms of the PHQ-8 scores of the three study sites and the entire dataset.
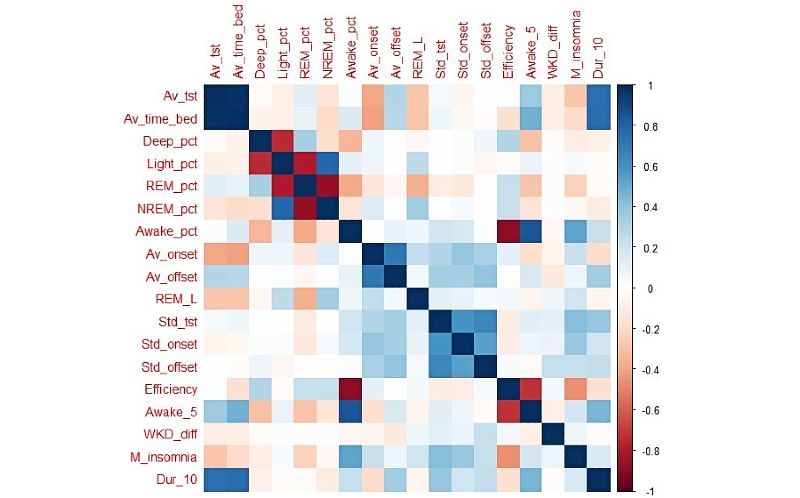
Figure 2. Correlation plot of pairwise Spearman correlations between all sleep features. Descriptions of abbreviations of sleep features are shown in
Table 1.
https://mhealth.jmir.org/2021/4/e24604 JMIR Mhealth Uhealth 2021 | vol. 9 | iss. 4 | e24604 | p. 7
(page number not for citation purposes)
XSL• FO
RenderXJMIR MHEALTH AND UHEALTH Zhang et al
Table 3. Spearman correlation coefficients between the PHQ-8 score and sleep subscorea on the 3 study sites and their 95% confidence intervals, z
score statistics, and P values.
Study site r 95% CI z score P value
KCLb .74 0.71, 0.76 41.99JMIR MHEALTH AND UHEALTH Zhang et al
For sleep subscore, we can notice that deep sleep percentage PHQ-8 score on different research sites separately. On the KCL
(Deep_pct), REM sleep percentage (REM_pct), and sleep data, most associations between sleep features and depression
efficiency (Efficiency) were significantly and negatively were consistent with the results on the entire dataset. On the
associated with the sleep subscore, whereas features of the CIBER data, some features were no longer significantly
percentage of awake time (Awake_pct), unstable sleep (Std_tst, associated with the PHQ-8 score. However, on the VUmc data,
Std_onset, Std_offset), awakening times (Awake_5), weekend most features lost their significance except features of total sleep
catch-up sleep (WKD_diff), sleep onset time (Av_onset), sleep time (Av_tst), time in bed (Av_time_bed), REM latency
offset time (Av_offset), insomnia (M_insomnia), and (REM_L), and awakenings (Awake_5).
hypersomnia (Dur_10) were significantly and positively
Table 6 shows associations between sleep features and the sleep
associated with the sleep subscore.
subscore on different research sites. The significance of
Two-Level Linear Mixed Models on Different Research associations between sleep features and the sleep subscore were
Sites different among the 3 study sites. Notably, the insomnia feature
(M_insomnia) and at least one feature of sleep stability were
Table 5 provides the results from 2-level linear mixed models
significantly positively associated with sleep subscore on the
which show the associations between sleep features and the
data of all 3 sites.
Table 5. Coefficient estimates, 95% confidence intervals, and P values from 2-level linear mixed models on the 3 study sites for exploring associations
between sleep featuresa and the PHQ-8 score.
Features KCLb CIBERc VUmcd
Coeff.e 95% CI P value Coeff. 95% CI P value Coeff. 95% CI P value
Av_tst 0.013 0.005, 0.020 .001 0.016 –0.001, 0.033 .06 0.011 0, 0.022 .049
Av_time_bed 0.016 0.008, 0.024JMIR MHEALTH AND UHEALTH Zhang et al
Table 6. Coefficient estimates, 95% confidence intervals, and P values from 2-level linear mixed models on the 3 study sites for exploring associations
between sleep featuresa and the sleep subscoreb.
Features KCLc CIBERd VUmce
Coeff.f 95% CI P value Coeff. 95% CI P value Coeff. 95% CI P value
Av_tst 0.015 –0.021, 0.050 .41 –0.035 –0.116, 0.047 .41 –0.017 –0.070, 0.035 .52
Av_time_bed 0.026 –0.013, 0.066 .19 –0.025 –0.116, 0.065 .58 –0.015 –0.074, 0.043 .61
Deep_pct –0.027 –0.134, 0.081 .63 –0.196 –0.412, 0.020 .07 –0.191 –0.369, –0.014 .04
Light_pct –0.024 –0.213, 0.166 .81 0.098 –0.250, 0.445 .58 0.312 0.016, 0.608 .04
REM_pct –0.116 –0.260, 0.028 .12 –0.037 –0.304, 0.230 .79 –0.169 –0.398, 0.060 .15
NREM_pct –0.048 –0.194, 0.098 .52 –0.123 –0.389, 0.143 .37 0.125 –0.096, 0.346 .27
Awake_pct 0.165 0.085, 0.245JMIR MHEALTH AND UHEALTH Zhang et al
between these sleep features and the PHQ-8 score was reduced it would be hard to find the association between hypersomnia
in the VUmc data (Table 5). One possible reason is that, as seen and depression.
on Table 3, the correlation between the sleep subscore and
PHQ-8 score in the VUmc data (r=.64) was weaker than other
Comparison With Prior Work
2 study sites (KCL: r=.74 and CIBER: r=.78), which may be Our study has a relatively larger sample size and a longer
caused by confounding variables that we did not consider or follow-up duration than previous studies on monitoring
record in the VUmc population such as medication and depression by using wearable devices and mobile phones
occupational status. [19-21]. Each participant has multiple PHQ-8 records and
repeated measurements of sleep, so we can not only explore the
Sample size and heterogeneity of the dataset were other possible relationships between sleep and depression between individuals
factors that may affect results. Table 2 shows that the KCL site but also find the associations within individuals by using the
had the most PHQ-8 records, whereas VUmc had the least data. linear mixed model. Figure 3 is an example of a possible
As depression manifests itself in distinctive symptoms on depression relapse of one participant, showing an obvious
different people, it may be difficult to fully explore the increasing trend in PHQ-8 scores at the 13th PHQ-8 record of
associations between sleep and depression on a relatively smaller this participant. We can observe the sleep features in Figure 3
dataset (VUmc). For example, hypersomnia is specifically are significantly associated with the PHQ-8 score. This indicates
related to bipolar patients [7,8]; therefore, if the dataset did not that the sleep features extracted in this paper have the potential
contain enough bipolar patients or bipolar patients were not in to be the biomarkers of depression.
depressive episodes when they completed their PHQ-8 records,
Figure 3. The PHQ-8 scores and a select 4 sleep features of one participant with an obvious increasing trend in PHQ-8 score at 13th PHQ-8 record.
Descriptions of abbreviations of sleep features in this figure are shown in Table 1.
We also compared our findings with previous studies that used adolescents, and this is consistent with the finding in our paper.
other measurements to assess sleep, such as PSG and sleep A sleep report has shown that higher sleep efficiency, more
questionnaires. Although the sample size, population, deep sleep, and fewer awakenings after sleep onset represent
measurements, duration of these studies are different, the better sleep quality [32], which is also consistent with the
comparison may help to find more general associations between relationships we found between deep sleep percentage, awake
sleep and depression. Table 7 provides a summary of the percentage, and awakenings (>5 minutes) with sleep subscore.
comparison. Several longitudinal studies based on sleep A review showed that according to PSG research, the shortened
questionnaires have shown that insomnia and hypersomnia are REM latency and increased percentage of REM sleep are
both symptoms of depression [6,46], which we found in our biological markers of depression relapse [9]; however,
research. Kang et al [36] found the weekend catch-up sleep was relationships between depressive symptom severity with REM
significantly positively correlated with the severity of depression sleep percentage and REM latency were not significant in our
by analyzing the self-sleep questionnaires of 4553 Korean results.
https://mhealth.jmir.org/2021/4/e24604 JMIR Mhealth Uhealth 2021 | vol. 9 | iss. 4 | e24604 | p. 11
(page number not for citation purposes)
XSL• FO
RenderXJMIR MHEALTH AND UHEALTH Zhang et al
Table 7. Summary of the comparisons with previous studies using other measurements to assess sleep.
Type of feature Findings in previous studies Consistenta Measurement
Insomnia Insomnia is significantly related to depression [6]. Yes Questionnaire
Hypersomnia Prevalence of hypersomnia is high in depressed patients [46]. Yes Questionnaire
Weekend catch-up sleep Weekend catch-up sleep is significantly positively correlated with the Yes Questionnaire
severity of depression [36].
Deep sleep percentage More deep sleep represents higher sleep quality [32]. Yes Questionnaire
Awake percentage, Awakenings (>5 Fewer awakenings after sleep onset represents better sleep quality [32]. Yes Questionnaire
mins)
Sleep efficiency Higher sleep efficiency represents better sleep quality [32]. Yes Questionnaire
REM sleep percentage Increased REM sleep percentage can be biomarkers of depression [9]. No Polysomnography
REMb latency Shortened REM latency can be biomarkers of depression [9]. No Polysomnography
a
Whether it is consistent with our findings.
b
REM: rapid eye movement.
try to use activity information (eg, steps) provided by Fitbit to
Limitations approximate SOL. Although there are some limitations of Fitbit
Missing data is the major hindrance in our study. For various data, it provides a means to investigate sleep characteristic in
reasons, there were many missing records of sleep. We set the home settings.
completion rate of sleep records greater than 85% (12 days) as
one of the data inclusion criteria. However, the optimum In feature extraction, we did not consider the impact of
threshold is unclear, which needs to be further studied in future individual circumstances on sleep features. For example, some
research. Missingness could also be associated with depressive participants may need to shift work at night, which our features
status and could be a useful marker of relapse of depression; are unable to capture. We will consider the impact of sleep
for example, participants may not feel like complying if they habits and lifestyles on sleep features in the future. Further, we
are feeling depressed. In future research, we will consider did not explore the impact of individual patterns of depression
missingness as a potential feature. [47]—for example, the distinction between people with typical
and atypical depression who report reduced and increased sleep,
Although we adjusted our models for age, gender, education respectively, during depressive episodes. In future work, we
level, and annual income, it is hard to consider all potential will explore whether including this dimension improves
confounding variables. For example, some participants with specificity of our findings.
sleep disorders may take sleep medications. Sleep medications
have a significant influence on the features of sleep. In this paper, we focused on analyzing the manifestations of
Unfortunately, there was no daily record of whether the depression in sleep characteristics. We will investigate whether
participant took medication. This confounding variable may these relationships are bidirectional in future research. We only
affect the result. performed bivariate analysis (ie, separately analyzing the
association between each feature and the PHQ-8 score). The
The data of sleep stages used in this paper were provided by combination of features and nonlinear relationships was not
the Fitbit wristband. According to their validation studies, the considered. We will try to apply machine/deep learning models
Fitbit wristband showed promise in detecting sleep-wake states to predict the severity of depression by using sleep features in
but limitations in other sleep stages estimation [27-29]. This future research.
may be the reason the features of REM percentage and REM
latency in our paper did not show significant relationships with Conclusions
depressive symptoms. For detecting insomnia, the sleep onset Although consumer wearable devices may not be a substitute
latency (SOL) in the PSG report is a reliable indicator of for PSG to assess sleep quality accurately, we demonstrated
insomnia, but the Charge 2 and 3 are not able to measure SOL that some derived sleep features extracted from these wearable
directly. The features related to insomnia in our paper can devices show potential for remote measurement of sleep and
partially reflect insomnia, but they may be affected by factors consequently can act as a biomarker of depression in real-world
(such as work schedules or activities) other than insomnia. settings. These findings may provide the basis for the
Therefore, in future research, we will combine multiple features development of clinical tools that could be used to passively
(such as a late sleep onset time accompanied by a short total monitor disease state and trajectory with minimal burden on
sleep time) to determine whether a participant has insomnia and the participant.
Acknowledgments
The RADAR-CNS project has received funding from the Innovative Medicines Initiative 2 Joint Undertaking under grant 115902.
This joint undertaking receives support from the European Union’s Horizon 2020 research and innovation program and European
https://mhealth.jmir.org/2021/4/e24604 JMIR Mhealth Uhealth 2021 | vol. 9 | iss. 4 | e24604 | p. 12
(page number not for citation purposes)
XSL• FO
RenderXJMIR MHEALTH AND UHEALTH Zhang et al
Federation of Pharmaceutical Industries and Associations (EFPIA). This communication reflects the views of the RADAR-CNS
consortium and neither the Innovative Medicines Initiative nor the European Union and EFPIA are liable for any use that may
be made of the information contained herein. Participants in the CIBER site came from the following 4 clinical communities in
Spain: Parc Sanitari Sant Joan de Déu Network services, Institut Català de la Salut, Institut Pere Mata, and Hospital Clínico San
Carlos. Participant recruitment in Amsterdam was partially accomplished through Hersenonderzoek.nl, a Dutch online registry
that facilitates participant recruitment for neuroscience studies [24]. Hersenonderzoek.nl is funded by grant 73305095003 from
ZonMw-Memorabel, a project in the context of the Dutch Deltaplan Dementie, Gieskes-Strijbis Foundation, the Alzheimer’s
Society in the Netherlands, and Brain Foundation Netherlands. This paper represents independent research partially funded by
the National Institute for Health Research (NIHR) Biomedical Research Centre at South London and Maudsley National Health
Service (NHS) Foundation Trust and King’s College London. The views expressed are those of the authors and not necessarily
those of the NHS, NIHR, or the Department of Health and Social Care. RB is funded in part by grant MR/R016372/1 from the
King’s College London Medical Research Council Skills Development Fellowship program funded by the UK Medical Research
Council and by grant IS-BRC-1215-20018 from the NIHR Biomedical Research Centre at South London and Maudsley NHS
Foundation Trust and King’s College London.
Conflicts of Interest
VAN is an employee of Janssen Research and Development LLC and may own equity in the company.
References
1. Depression and other common mental disorders: global health estimates. Geneva: World Health Organization; 2017. URL:
https://apps.who.int/iris/bitstream/handle/10665/254610/WHO-MSD-MER-2017.2-eng.pdf [accessed 2021-03-26]
2. Cuijpers P, Schoevers RA. Increased mortality in depressive disorders: a review. Curr Psychiatry Rep 2004 Dec;6(6):430-437.
[doi: 10.1007/s11920-004-0007-y] [Medline: 15538991]
3. Lenox-Smith A, Macdonald MTB, Reed C, Tylee A, Peveler R, Quail D, et al. Quality of life in depressed patients in UK
primary care: the FINDER study. Neurol Ther 2013 Dec;2(1-2):25-42 [FREE Full text] [doi: 10.1007/s40120-013-0006-1]
[Medline: 26000214]
4. Lerner D, Adler DA, Chang H, Berndt ER, Irish JT, Lapitsky L, et al. The clinical and occupational correlates of work
productivity loss among employed patients with depression. J Occup Environ Med 2004 Jun;46(6 Suppl):S46-S55 [FREE
Full text] [doi: 10.1097/01.jom.0000126684.82825.0a] [Medline: 15194895]
5. Mendelson WB, editor. Human Sleep and Its Disorders. Berlin: Springer Science & Business Media; 2012.
6. Alvaro PK, Roberts RM, Harris JK. A systematic review assessing bidirectionality between sleep disturbances, anxiety,
and depression. Sleep 2013 Jul 01;36(7):1059-1068 [FREE Full text] [doi: 10.5665/sleep.2810] [Medline: 23814343]
7. Detre T, Himmelhoch J, Swartzburg M, Anderson CM, Byck R, Kupfer DJ. Hypersomnia and manic-depressive disease.
Am J Psychiatry 1972 Apr;128(10):1303-1305. [doi: 10.1176/ajp.128.10.1303] [Medline: 4335278]
8. Thase ME, Himmelhoch JM, Mallinger AG, Jarrett DB, Kupfer DJ. Sleep EEG and DST findings in anergic bipolar
depression. Am J Psychiatry 1989 Mar;146(3):329-333. [doi: 10.1176/ajp.146.3.329] [Medline: 2919689]
9. Palagini L, Baglioni C, Ciapparelli A, Gemignani A, Riemann D. REM sleep dysregulation in depression: state of the art.
Sleep Med Rev 2013 Oct;17(5):377-390. [doi: 10.1016/j.smrv.2012.11.001] [Medline: 23391633]
10. Riemann D, Berger M, Voderholzer U. Sleep and depression—results from psychobiological studies: an overview. Biol
Psychol 2001;57(1-3):67-103. [doi: 10.1016/s0301-0511(01)00090-4] [Medline: 11454435]
11. Iber C, Ancoli-Israel S, Chesson A, Quan S. AASM Manual for the Scoring of Sleep and Associated Events. Darien:
American Academy of Sleep Medicine; 2007.
12. Sánchez-Ortuño MM, Edinger JD, Means MK, Almirall D. Home is where sleep is: an ecological approach to test the
validity of actigraphy for the assessment of insomnia. J Clin Sleep Med 2010 Feb 15;6(1):21-29 [FREE Full text] [Medline:
20191934]
13. Buysse DJ, Reynolds CF, Monk TH, Berman SR, Kupfer DJ. The Pittsburgh Sleep Quality Index: a new instrument for
psychiatric practice and research. Psychiatry Res 1989 May;28(2):193-213. [doi: 10.1016/0165-1781(89)90047-4] [Medline:
2748771]
14. Moore CM, Schmiege SJ, Matthews EE. Actigraphy and sleep diary measurements in breast cancer survivors: discrepancy
in selected sleep parameters. Behav Sleep Med 2015;13(6):472-490 [FREE Full text] [doi: 10.1080/15402002.2014.940108]
[Medline: 25117292]
15. Beattie Z, Oyang Y, Statan A, Ghoreyshi A, Pantelopoulos A, Russell A, et al. Estimation of sleep stages in a healthy adult
population from optical plethysmography and accelerometer signals. Physiol Meas 2017 Oct 31;38(11):1968-1979. [doi:
10.1088/1361-6579/aa9047] [Medline: 29087960]
16. Van de Water ATM, Holmes A, Hurley DA. Objective measurements of sleep for non-laboratory settings as alternatives
to polysomnography—a systematic review. J Sleep Res 2011 Mar;20(1 Pt 2):183-200 [FREE Full text] [doi:
10.1111/j.1365-2869.2009.00814.x] [Medline: 20374444]
https://mhealth.jmir.org/2021/4/e24604 JMIR Mhealth Uhealth 2021 | vol. 9 | iss. 4 | e24604 | p. 13
(page number not for citation purposes)
XSL• FO
RenderXJMIR MHEALTH AND UHEALTH Zhang et al
17. Zhang Y, Yang Z, Lan K. Sleep stage classification using bidirectional lstm in wearable multi-sensor systems. 2019 Presented
at: IEEE INFOCOM–IEEE Conference on Computer Communications Workshops; 2019; Paris p. 443-448. [doi:
10.1109/infcomw.2019.8845115]
18. Zhang Y, Yang Z, Zhang Z. Breathing disorder detection using wearable electrocardiogram and oxygen saturation. Proc
16th ACM Conf Emb Netw Sensor Syst 2018:313-314. [doi: 10.1145/3274783.3275159]
19. Miwa H, Sasahara S, Matsui T. Roll-over detection and sleep quality measurement using a wearable sensor. Annu Int Conf
IEEE Eng Med Biol Soc 2007:1507-1510. [doi: 10.1109/IEMBS.2007.4352587] [Medline: 18002253]
20. Mark G, Czerwinski M, Iqbal S. Workplace indicators of mood: behavioral and cognitive correlates of mood among
information workers. Proc 6th Int Conf on Dig Health 2016:29-36. [doi: 10.1145/2896338.2896360]
21. Demasi O, Aguilera A, Recht B. Detecting change in depressive symptoms from daily wellbeing questions, personality,
and activity. IEEE 2016:1. [doi: 10.1109/wh.2016.7764552]
22. Khoulji S, Garzón-Rey J, Aguilo J. Remote Assessment of Disease and Relapse–Central Nervous System (RADAR-CNS).
Transact Mach Learn Artif Intell 2017 Aug 31;5(4):1. [doi: 10.14738/tmlai.54.3293]
23. Matcham F, Barattieri di San Pietro C, Bulgari V, de Girolamo G, Dobson R, Eriksson H, RADAR-CNS consortium.
Remote assessment of disease and relapse in major depressive disorder (RADAR-MDD): a multi-centre prospective cohort
study protocol. BMC Psychiatry 2019 Feb 18;19(1):72 [FREE Full text] [doi: 10.1186/s12888-019-2049-z] [Medline:
30777041]
24. Hersenonderzoek.nl. URL: https://hersenonderzoek.nl [accessed 2020-12-07]
25. Ranjan Y, Rashid Z, Stewart C, Conde P, Begale M, Verbeeck D, RADAR-CNS Consortium. RADAR-Base: open source
mobile health platform for collecting, monitoring, and analyzing data using sensors, wearables, and mobile devices. JMIR
Mhealth Uhealth 2019 Aug 01;7(8):e11734 [FREE Full text] [doi: 10.2196/11734] [Medline: 31373275]
26. Kroenke K, Strine TW, Spitzer RL, Williams JBW, Berry JT, Mokdad AH. The PHQ-8 as a measure of current depression
in the general population. J Affect Disord 2009 Apr;114(1-3):163-173. [doi: 10.1016/j.jad.2008.06.026] [Medline: 18752852]
27. de Zambotti M, Goldstone A, Claudatos S, Colrain IM, Baker FC. A validation study of Fitbit Charge 2 compared with
polysomnography in adults. Chronobiol Int 2018 Apr;35(4):465-476. [doi: 10.1080/07420528.2017.1413578] [Medline:
29235907]
28. Haghayegh S, Khoshnevis S, Smolensky MH, Diller KR, Castriotta RJ. Accuracy of wristband fitbit models in assessing
sleep: systematic review and meta-analysis. J Med Internet Res 2019 Nov 28;21(11):e16273 [FREE Full text] [doi:
10.2196/16273] [Medline: 31778122]
29. Liang Z, Chapa-Martell MA. Accuracy of fitbit wristbands in measuring sleep stage transitions and the effect of user-specific
factors. JMIR Mhealth Uhealth 2019 Jun 06;7(6):e13384 [FREE Full text] [doi: 10.2196/13384] [Medline: 31172956]
30. Aluoja A, Leinsalu M, Shlik J, Vasar V, Luuk K. Symptoms of depression in the Estonian population: prevalence,
sociodemographic correlates and social adjustment. J Affect Disord 2004 Jan;78(1):27-35. [doi:
10.1016/s0165-0327(02)00179-9] [Medline: 14672794]
31. Akhtar-Danesh N, Landeen J. Relation between depression and sociodemographic factors. Int J Ment Health Syst 2007
Sep 04;1(1):4 [FREE Full text] [doi: 10.1186/1752-4458-1-4] [Medline: 18271976]
32. Ohayon M, Wickwire EM, Hirshkowitz M, Albert SM, Avidan A, Daly FJ, et al. National Sleep Foundation's sleep quality
recommendations: first report. Sleep Health 2017 Feb;3(1):6-19. [doi: 10.1016/j.sleh.2016.11.006] [Medline: 28346153]
33. Walker MP. Sleep-dependent memory processing. Harv Rev Psychiatry 2008;16(5):287-298. [doi:
10.1080/10673220802432517] [Medline: 18803104]
34. Rasch B, Born J. About sleep's role in memory. Physiol Rev 2013 Apr;93(2):681-766 [FREE Full text] [doi:
10.1152/physrev.00032.2012] [Medline: 23589831]
35. Manni R. Rapid eye movement sleep, non-rapid eye movement sleep, dreams, and hallucinations. Curr Psychiatry Rep
2005 Jun;7(3):196-200. [doi: 10.1007/s11920-005-0053-0] [Medline: 15935133]
36. Kang S, Lee YJ, Kim SJ, Lim W, Lee H, Park Y, et al. Weekend catch-up sleep is independently associated with suicide
attempts and self-injury in Korean adolescents. Compr Psychiatry 2014 Feb;55(2):319-325. [doi:
10.1016/j.comppsych.2013.08.023] [Medline: 24267542]
37. Liu X, Zhao Z, Jia C, Buysse DJ. Sleep patterns and problems among chinese adolescents. Pediatrics 2008
Jun;121(6):1165-1173. [doi: 10.1542/peds.2007-1464] [Medline: 18519486]
38. American Psychiatric Association. Diagnostic and Statistical Manual of Mental Disorders (DSM-5). Washington: American
Psychiatric Publishers; 2013.
39. Tam EM, Lam RW, Robertson HA, Stewart JN, Yatham LN, Zis AP. Atypical depressive symptoms in seasonal and
non-seasonal mood disorders. J Affect Disord 1997 Jun;44(1):39-44. [doi: 10.1016/s0165-0327(97)01447-x] [Medline:
9186801]
40. Farhan AA, Yue C, Morillo R. Behavior vs. introspection: refining prediction of clinical depression via smartphone sensing
data. 2016 Presented at: 2016 IEEE Wireless Health (WH); 2016; Bethesda p. 1-8. [doi: 10.1109/wh.2016.7764553]
41. Singer JD, Willett JB, Willett JB. Applied Longitudinal Data Analysis: Modeling Change and Event Occurrence. Oxford:
Oxford University Press; 2003.
https://mhealth.jmir.org/2021/4/e24604 JMIR Mhealth Uhealth 2021 | vol. 9 | iss. 4 | e24604 | p. 14
(page number not for citation purposes)
XSL• FO
RenderXJMIR MHEALTH AND UHEALTH Zhang et al
42. Sun S, Folarin AA, Ranjan Y, Rashid Z, Conde P, Stewart C, RADAR-CNS Consortium. Using smartphones and wearable
devices to monitor behavioral changes during COVID-19. J Med Internet Res 2020 Sep 25;22(9):e19992 [FREE Full text]
[doi: 10.2196/19992] [Medline: 32877352]
43. Laird NM, Ware JH. Random-effects models for longitudinal data. Biometrics 1982 Dec;38(4):963-974. [Medline: 7168798]
44. Box GEP, Cox DR. An analysis of transformations. J Royal Stat Soc B 2018 Dec 05;26(2):211-243. [doi:
10.1111/j.2517-6161.1964.tb00553.x]
45. Benjamini Y, Hochberg Y. Controlling the false discovery rate: a practical and powerful approach to multiple testing. J
Royal Stat Soc B 2018 Dec 05;57(1):289-300. [doi: 10.1111/j.2517-6161.1995.tb02031.x]
46. Kaplan KA, Harvey AG. Hypersomnia across mood disorders: a review and synthesis. Sleep Med Rev 2009
Aug;13(4):275-285. [doi: 10.1016/j.smrv.2008.09.001] [Medline: 19269201]
47. Brailean A, Curtis J, Davis K, Dregan A, Hotopf M. Characteristics, comorbidities, and correlates of atypical depression:
evidence from the UK Biobank Mental Health Survey. Psychol Med 2019 May 02;50(7):1129-1138. [doi:
10.1017/s0033291719001004]
Abbreviations
CIBER: Centro de Investigación Biomédican en Red
EFPIA: European Federation of Pharmaceutical Industries and Associations
KCL: King’s College London
NHS: National Health Service
NIHR: National Institute for Health Research
NREM: non-REM
PHQ-8: Patient Health Questionnaire 8-item
PSG: polysomnography
PSQI: Pittsburgh Sleep Quality Index
RADAR-CNS: Remote Assessment of Disease and Relapse–Central Nervous System
RADAR-MDD: Remote Assessment of Disease and Relapse–Major Depressive Disorder
REM: rapid eye movement
SOL: sleep onset latency
VUmc: Vrije Universiteit Medisch Centrum
WHO: World Health Organization
Edited by L Buis; submitted 26.09.20; peer-reviewed by N Jacobson, Z Liang; comments to author 25.11.20; revised version received
07.12.20; accepted 03.02.21; published 12.04.21
Please cite as:
Zhang Y, Folarin AA, Sun S, Cummins N, Bendayan R, Ranjan Y, Rashid Z, Conde P, Stewart C, Laiou P, Matcham F, White KM,
Lamers F, Siddi S, Simblett S, Myin-Germeys I, Rintala A, Wykes T, Haro JM, Penninx BWJH, Narayan VA, Hotopf M, Dobson RJB,
RADAR-CNS Consortium
Relationship Between Major Depression Symptom Severity and Sleep Collected Using a Wristband Wearable Device: Multicenter
Longitudinal Observational Study
JMIR Mhealth Uhealth 2021;9(4):e24604
URL: https://mhealth.jmir.org/2021/4/e24604
doi: 10.2196/24604
PMID:
©Yuezhou Zhang, Amos A Folarin, Shaoxiong Sun, Nicholas Cummins, Rebecca Bendayan, Yatharth Ranjan, Zulqarnain Rashid,
Pauline Conde, Callum Stewart, Petroula Laiou, Faith Matcham, Katie M White, Femke Lamers, Sara Siddi, Sara Simblett, Inez
Myin-Germeys, Aki Rintala, Til Wykes, Josep Maria Haro, Brenda WJH Penninx, Vaibhav A Narayan, Matthew Hotopf, Richard
JB Dobson, RADAR-CNS Consortium. Originally published in JMIR mHealth and uHealth (http://mhealth.jmir.org), 12.04.2021.
This is an open-access article distributed under the terms of the Creative Commons Attribution License
(https://creativecommons.org/licenses/by/4.0/), which permits unrestricted use, distribution, and reproduction in any medium,
provided the original work, first published in JMIR mHealth and uHealth, is properly cited. The complete bibliographic information,
a link to the original publication on http://mhealth.jmir.org/, as well as this copyright and license information must be included.
https://mhealth.jmir.org/2021/4/e24604 JMIR Mhealth Uhealth 2021 | vol. 9 | iss. 4 | e24604 | p. 15
(page number not for citation purposes)
XSL• FO
RenderXYou can also read