Research on real-time reachability evaluation for reentry vehicles based on fuzzy learning
←
→
Page content transcription
If your browser does not render page correctly, please read the page content below

Open Astronomy 2022; 31: 205–216
Research Article
Hong Ma*, Ke Xu, Shouming Sun, Wei Zhang, and Tao Xi
Research on real-time reachability evaluation for
reentry vehicles based on fuzzy learning
https://doi.org/10.1515/astro-2022-0026
received April 23, 2022; accepted May 02, 2022
1 Introduction
Abstract: Accurate and rapid prediction of reentry trajec- For the real reentry vehicle and reentry environment, the
tory and landing point is the basis to ensure the reentry mathematical simulation model and its corresponding
vehicle recovery and rescue, but it has high requirements real system (reentry vehicle aerodynamic model, sensor
for the continuity and stability of real-time monitoring model, actuator model, atmospheric environment model,
and positioning data and the fidelity of the reentry pre- aerodynamic ablation model, etc.) generally have high
diction model. In order to solve the above contradiction, nonlinearity and strong coupling, it also has many uncer-
based on the theory of relative entropy and closeness in tain influencing factors, and then, the reentry trajectory
fuzzy learning, research on real-time evaluation of reentry envelope is large (Hale et al. 2002, Phillips 2003, Richie
reachability is presented in this article. With the Monte 1999, Vinh et al. 1980, Peña-Asensio et al. 2021). At the
Carlo analysis data during the design and evaluation of same time, restricted by the tracking ability of TT&C
the reentry vehicle control system, the reentry trajectory
equipment, complete and continuous telemetry data of
feature information base is designed. With the matching
the reentry vehicle with preset trajectory cannot be obtained
identification decision strategy between the identified tra-
in the real reentry process, and then based on the state of its
jectory and trajectory feature base, the reachability of the
attitude, navigation and positioning, guidance and control
reentry vehicle, reachable trajectory, and landing point
systems to predict and judge the reachability of reentry
can be predicted. The simulation results show that by rea-
vehicle will be difficult (Vinh 1981, Tang et al. 2019). How-
sonably selecting the time window and using the evalua-
ever, for the TT&C equipment, search and rescue system, it
tion method designed in this article, making statistics of
is necessary to realize the guidance of tracking equipment,
the trajectory sequence number and frequency identified
recover and search the reentry vehicles by evaluating the
based on relative entropy and closeness method, the reach-
impact point dispersion and predicting reachability of the
ability evaluation results can be given stably, which is sui-
reentry vehicle, according to the real-time measured posi-
table for the real-time task evaluation of TT&C system.
tioning data, high fidelity reentry trajectory prediction model
Keywords: reentry trajectory, reachability evaluation, rela- and guidance algorithm (Ono et al. 2020, Du and Liu 2017,
tive entropy theory, closeness and closest principles, match Jiang et al. 2020, Dong et al. 2022, Mehta et al. 2017).
identify The above contradiction has a strong dependence on
the stability of real-time measurement data, the accuracy
of reentry trajectory high fidelity model and the robust-
ness of the guidance module. The real-time trajectory
data of high-speed reentry vehicles can be smoothed by
filtering algorithm (Wei et al. 2022, Huang et al. 2020,
Wang et al. 2014), but the high-fidelity model of reentry
* Corresponding author: Hong Ma, State Key Laboratory of trajectory prediction and guidance calculation module is
Astronautic Dynamics, Xi’an 710043, China; Xi’an Satellite Control generally a “black box” for the TT&C equipment, search
Center, Xi’an 710043, China, e-mail: qingtingsay@163.com and rescue system. High computer performance and quan-
Ke Xu, Shouming Sun, Tao Xi: State Key Laboratory of Astronautic titative evaluation results should be required if using
Dynamics, Xi’an 710043, China; Xi’an Satellite Control Center,
the Monte Carlo analysis method to predict the impact
Xi’an 710043, China
Wei Zhang: State Key Laboratory of Spacecraft In-Orbit Fault
distribution in real time. Then, the Monte Carlo analysis
Diagnosis and Maintenance, Xi’an 710043, China; Xi’an Satellite method can only be used as the impact analysis of uncer-
Control Center, Xi’an 710043, China tain factors for the control system, but not suitable for the
Open Access. © 2022 Hong Ma et al., published by De Gruyter. This work is licensed under the Creative Commons Attribution 4.0
International License.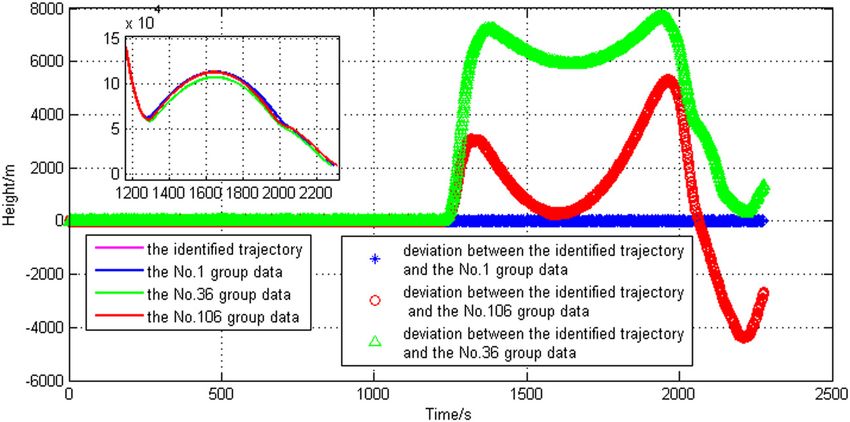
206 Hong Ma et al.
real-time reachability capability evaluation of reentry reachable area (Qiao et al. 2017), based on the fuzzy
vehicles for TT&C dependent itself. learning theory, a reachability evaluation strategy for
The research on the reachability of reentry vehicle the reentry vehicle is presented in this article. Estab-
mainly focuses on such as the optimal design of reentry lishing the fuzzy set by trajectory flight envelope informa-
orbit (De Grossi et al. 2021, Fieee et al. 2005, Chen et al. tion generated as the basic feature library, the trajectory
2021, Meng et al. 2015, Wang et al. 2019, Roh et al. 2020), data are generated based on the high fidelity reentry tra-
reentry trajectory and TT&C station determination method jectory prediction model and guidance model with Monte
(Mansell and Grant 2018, Haitao et al. 2021), through error Carlo trajectory analysis. Constructing the trajectory fuzzy
transfer analysis (Wu et al. 2021, Wang and Grant 2017), vector to be identified based on the real-time measured
aerodynamic shape (Li et al. 2020) and reentry trajectory reentry flight path feature information of the reentry vehicle,
comprehensive optimization method (Taheri et al. 2021, the matching identification strategy and reentry reachability
Vivani and Pezzella 2015, Graves and Harpold 1972), guidance evaluation method are designed in this article. The max-
method comparison (Terui et al. 2020, Gamble et al. 1988, Lu imum possibility of the reachable path and landing point
2008, Rea and Putnam 2007, Bairstow 2007, 2006, Putnam for the real reentry vehicle are calculated, so as to evaluate
et al. 2008, Wang et al. 2021, Guo et al. 2021, You et al. 2021, the reachability and provide guidance for trajectory and
Succa et al. 2016, Fang et al. 2018). Considering constraints of landing point prediction. It provides a new method for
specific models and guidance algorithms such as no-fly zone, real-time reachability evaluation with TT&C equipment
heating and overload, it consumes a lot of computing time tracking and guidance with abnormal tracking conditions.
with analysis reachable domain, and the real-time perfor-
mance is not good. Some scholars hope to build a model
through the neural network artificial intelligence theory to
realize reentry trajectory prediction (You et al. 2020; Sán- 2 Relative entropy and closeness in
chez-Sánchez and Izzo 2018, Ma et al. 2021, Yang and Wang
2020), but it also needs to consume a lot of training time and
fuzzy learning
calculation energy consumption in advance, so the flexibility
is limited. 2.1 Definition of fuzzy relative entropy
As a theory of processing small sample data, fuzzy
learning theory is more and more favored by researchers Defining the probability distribution as
and engineers in the fields of machine learning, artificial p = ( p1 , p2 , ⋯ , pn ) ,
intelligence and so on. It is an important basis for analyzing (1)
q = (q1, q2 , ⋯ , qn) ,
the performance of learning machines and developing new
learning algorithms. Fuzzy relative entropy (Lin 1991) and where n is the number of fuzzy vectors, pi , qi ≥ 0,and
closeness theory (De Luca and Termini 1972) are two impor- n n
tant theories in fuzzy clustering evaluation. Fuzzy relative ∑pi = 1, ∑qi = 1, i = 1, 2, ⋯ , n .
i=1 i=1
entropy, also known as K–L divergence, describes the
degree of similarity between samples with a probability dis- The relative entropy of known probability distribu-
tribution. The smaller the relative entropy is, the more tion Q to distribution P is defined as:
similar the probability distribution is. The closeness degree n
pi
describes the similarity degree by describing the ratio of H (P , Q ) = ∑pi ln , (2)
i=1
qi
overlapping area to non-overlapping area after the transfor-
mation of the sample vector membership function. The where p is the Lagrange multiplier, and H(P,Q) reflects
greater the closeness degree is, the greater the similarity the difference between distribution P and Q.
degree is. Therefore, these two theories can be used to mea- For n = 2 , assuming p1 = p , p2 = 1 − p, q1 = q , q2 =
sure and identify the coincidence degree between systems. 1 − q , then:
At present, relative entropy theory and closeness theory are
p 1−p
mainly used to solve multi-attribute decision-making pro- H (P , Q) = p ln + (1 − p) ln . (3)
q 1−q
blems (Bi et al. 2015, Ning et al. 2019, Li et al. 2022), such
as emergency decision-making, customer credit evaluation As it is similar to relative entropy, fuzzy relative entropy
and competence strength and satisfaction evaluation. could be defined to reflect and measure the difference
Considering the inevitable correlation between the between two fuzzy vectors based on probability distribution
current flight path state of the reentry vehicle and the accordingly.Research on real-time reachability evaluation 207
Assuming that A = (μA(x1) , μA(x2 ), ⋯ , μA(xn)) and B = recognition of set B̃ , it is necessary to estimate which
(μB (x1) , μB (x2 ), ⋯ , μB (xn)) are two given distributions and set is closest to subset Ãi . Such problems could also be
are called two fuzzy vectors. μA(xi ) represents the degree recognized by the proximity selection principle. The close-
to which xi belongs to set A,μB (xi ) represents the degree ness degree is defined as (De Luca and Termini 1972):
to which xi belongs to set B , and μA(xi ) , μB (xi ) ∈ [0, 1]. Defining à and B̃ are fuzzy subsets of universe X , and
Defining the fuzzy relative entropy of μA(xi ) and μB (xi ) take the target membership function as
as follows (Lin 1991):
μA(xi ) ⎧ 0, B˜ (xi ) ≥ max A˜ (xi ),
S (μA(xi ) , μB (xi )) = μA(xi ) ln ⎪ max A˜ (x ) − B˜ (x )
μB (xi ) ⎪ i i
min A˜ (xi ) ≤ B˜ (xi )
(4) μ(B˜ (xi )) = max A˜ (x ) − min A˜ (x ) , (9)
1 − μA(xi ) ⎨ i i
⎪ ≤ max A˜ (xi ),
+ (1 − μA(xi )) ln . ⎪1,
1 − μB (xi ) ⎩ B(xi ) ≤ min A˜ (xi ),
˜
Therefore, the relative entropy of fuzzy vector B → A where max A˜ (xi ) and min A˜ (xi ) represent the set of maximum and
can be defined as: minimum values in set Ãi , respectively.
⎧ μ (x ) ln μA(xi ) + ⎫ Definition 1. μmax (B˜ (xi )) = A˜ (xi ) ∨ B˜ (xi ) represents the
n ⎪ A i μB (xi ) ⎪
S (A , B ) = ∑⎨ . (5) maximum value of the subset membership μ(B˜ (xi )) at point
1 − μA(xi ) ⎬
i=1
⎪ (1 − μA(xi )) ln ⎪ xi , and μmin (B˜ (xi )) = A˜ (x i ) ∧ B˜ (x i ) represents the minimum
⎩ 1 − μB (xi ) ⎭
value of the subset membership μ(B˜ (xi )) at point xi .
This reflects the difference between two fuzzy
vectors. However, the above formula has a disadvantage, Definition 2. Closeness – A finite universe is defined as
that is, when μA(xi ) → 0, 1 or μB (xi ) → 0, 1, S (A, B) → ∞. X = {x1, x2 , ⋯ , xn} . According to Definition 1 and the defi-
Therefore, we ought to revise it. nitions of inner product and outer product in number
In fact, H (P , Q) also has the same disadvantage, theory:
which is modified as:
∑ni = 1μmin (B˜ (xi ))
n
pi N (A˜ , B˜ ) = , 0 ≤ N (A˜ , B˜ ) ≤ 1. (10)
K (P , Q) = ∑pi ln . (6) ∑n μmax (B˜ (xi ))
i=1
i=1
pi / 2 + qi/ 2
N (A˜ , B˜ ) is the closeness of fuzzy vectors A˜ (x ) and
Similarly, S (A, B) could also be modified as follows:
˜
B(x ), which represents the ratio of overlapping area to
⎧ μ (x ) ln μA(xi ) ⎫ non-overlapping area of two fuzzy vectors. It indicates
+
n ⎪ A i μA(xi ) / 2 + μB (xi ) / 2 ⎪
E (A , B ) = ∑⎨ . (7) that à and B̃ is closer when N (A˜ , B˜ ) → 1.
i=1
1 − μA(xi ) ⎬
⎪ (1 − μA(xi )) ln ⎪
⎩ 1 − ( μ (
A ix ) + μ (
B ix )) / 2 ⎭
It has complete significance and practicability, which
is called fuzzy relative entropy. It could characterize the
3 Evaluation strategy of
difference between set A and set B. That is, the smaller the reachability for reentry vehicle
fuzzy relative entropy, the smaller difference between them.
It is easy to prove that E (A, B) does not satisfy sym-
based on fuzzy learning
metry, and E (A, B) ≥ 0, if and only if A = B , E (A, B) = 0.
3.1 Establishing the fuzzy vector of reentry
trajectory
2.2 Closeness of fuzzy set
3.1.1 The information feature database of reentry
Fuzzy recognition mainly focuses on which fuzzy set is closest reachable trajectory
to a known one. The given fuzzy subset is defined as:
A˜1 , A˜2 , ⋯ A˜ n , A˜ i ∈ F (X ) . (8) Monte Carlo analysis is carried out based on the high
fidelity dynamic model and uncertainty error term, and
Represent F (X ) as the set of all fuzzy subsets, B˜ ∈ F (X ) the sub-satellite point trajectories are calculated. Set the
is defined as a subset to be recognized. For fuzzy sub-satellite point of i in the reentry reachable trajectory208 Hong Ma et al.
information database as (ti, Bi , Li , Hi ), so as to define the ∑i3= 1[A˜ 0i ∧ A˜ ji ]
N (A˜ 0 , A˜ j ) = , (14)
feature information database as: ∑i3= 1[A˜ 0i ∨ A˜ ji ]
N
∑(ti, Bi , Li , Hi). (11) where i = 1, 2, 3, indicating the sub-satellite feature
i=1 trajectory information with latitude, longitude and
altitude.
The feature reflects the attribute values of fuzzy fea-
tures, and each feature trajectory is a set of vectors
related to time, latitude, longitude and height of sub-
satellite points. 3.3 Strategy of matching identification
Set the latitude, longitude and altitude of the sub-satel-
lite point of the trajectory to be identified as (t0, B0 , L0 , H0), Considering the relative entropy can not only reflect
respectively, which is the characteristic attribute vector of the distribution characteristics of the target feature
the trajectory to be identified. attributes to be identified, but also obtain more accu-
rate target similarity by weighting, and finally improve
the accuracy of target recognition. When calculating the
3.1.2 Standardizing the fuzzy vector closeness, the accuracy of target recognition will be reduced
when the identified vector is not in the feature base or there
Setting xmax and xmin to be the maximum and minimum is noise interference. Therefore, the following recognition
values of the original data, which of the index parameters decision-making strategy is formulated:
to be standardized, and x̄ to be the average values, (1) When Emin(A0 , Aj ) ∪ Nmax (A˜ 0 , A˜ j ) is satisfied, it is
respectively. Standardizing the latitude, longitude and matching successful, that is, when the fuzzy relative
altitude information in the reachable trajectory informa- entropy of the trajectory to be identified and the tra-
tion base according to the range processing method as jectory information feature base is the smallest, and the
follows: closeness is the largest, it is estimated that matching is
successful;
ri = (xi − x¯ ) / (xmax − xmin) . (12)
(2) When Emin(A0 , Aj ) or Nmax (A˜ 0 , A˜ j ) is satisfied, the one
That is, normalizing each element in the fuzzy with the smallest relative entropy is taken as the
vector to (0,1). Recording that the normalized trajectory optimal “matching” result.
modulus vector to be identified as A0 = (B¯ 0 , L¯ 0 , H¯ 0) =
(A01 , A02 , A03 ), the fuzzy vector of target number j is
Aj = (B¯ j , L¯ j , H¯ j ) = (Aj1 , Aj 2 , Aj 3 ).
3.4 The reachability evaluation method for
reentry vehicles
3.2 Calculating the relative entropy and
The specific steps of evaluating the reentry reachability
closeness of reentry trajectory for reentry vehicles based on fuzzy theory are as follows.
Figure 1 is the flowchart of the evaluation method of
According to formula (7), calculating the fuzzy relative
reachability for reentry vehicles.
entropy between the trajectory information to be identi-
(1) Carrying out Monte Carlo analysis, based on the high
fied and the feature database vector, then generating the
fidelity dynamic model, the identified system uncer-
relative entropy matrix
tainty factors and error interference terms; calculating
⎧ A0i ln A0i ⎫ characteristic information of sub-satellite points to
3
+
⎪ A0i / 2 + Aji / 2 ⎪ generate the reentry trajectory characteristic informa-
E (A0 , Aj ) = ∑ . (13) tion database.
⎨
i = 1 (1 − A0i ) ln
1 − A0i ⎬
⎪ 1 − (A0i + Aji ) / 2 ⎪ (2) Filtering and smoothing the real-time positioning
⎩ ⎭
data in the process of real reentry flight as the trajec-
According to formulas (8) and (9), calculating the tory to be identified, and calculating sub-satellite
closeness of the specially identified trajectory informa- points to generate the characteristic information of
tion as follows and generating the closeness matrix: the trajectory to be identified.Research on real-time reachability evaluation 209
(3) Processing the trajectory feature information calcu- 4 Simulation and result
lated in steps (1) and (2) by fuzzy vector standardiza-
tion. Taking the Skip Entry with the characteristics of sec-
(4) Calculating and sorting the calculation results of ondary reentry trajectory as the simulation verification
fuzzy relative entropy and closeness, which of the object, the feasibility of the reentry reachability evalua-
trajectory to be identified relative to the reentry tra- tion method based on fuzzy learning is verified.
jectory feature database, according to the specified
real-time data accumulation evaluation time window
Δt . 4.1 Simulation settings
(5) Finding the most matching trajectory in the current
real-time data window and trajectory feature data- (1) Considering the separation point of 5,000 km module
base according to the matching identification stan- and vehicle (Huang et al. 2020, Li et al. 2020), set the
dard. Setting the trajectory matching serial number initial deviation term according to the random normal
as K, taking the landing point and landing time cor- distribution, as shown in Table 1. Generate 300 groups
responding to this trajectory as the currently identi- of deviation trajectories based on the Monte Carlo
fied reachability evaluation result. method as the reentry trajectory characteristic infor-
(6) Repeating steps (2) to (5), counting the trajectory mation base of the reentry vehicle.
matching sequence number as ∑k , and calculating
the number of occurrences of the matched trajectory Figures 2 and 3 show the altitude and sub-satellite
sequence number by sliding the accumulated real- point dispersion diagram of 300 groups of trajectories in
time data time ∑Δt . Taking the trajectory with the the trajectory feature information database. The GNC
most occurrences as the final result of the reentry system guidance capability of the simulation object reentry
reachability evaluation, and its corresponding landing vehicles can ensure that the altitude dispersion range of
point and landing time as the final landing point pre- first skipping out is about 40 km and the landing point
diction result. dispersion range is ±50 km.
Establishing reentry track basic feature database
Filtering Real-time reentry track data
Standardizing fuzzy vector of reentry track data
Sliding real-time
Calculating fuzzy relative entropy and closeness data time window
Matching recognition and assessing accessibility with
sliding time window of real-time reentry track data
Outputting End of reentry No
evaluation results section?
Yes
Taking the most times listed in the "matching
sequence number" as the final result, outputting the
landing point and time.
End of real-time reachability evaluation
of reentry module
Figure 1: Flowchart of reentry reachability evaluation method for reentry vehicles.210 Hong Ma et al.
Table 1: Error source setting (for module separation point)
Serial number Category Error term Range
1 Initial condition deviation Height (km) ±5%
2 Speed (M/s) ±1%
3 Reentry angle ±0.2
4 Longitude (°) ±0.2
5 Latitude (°) ±0.2
6 Velocity Azimuth (°) 0.2
7 Mass (kg) ±10.0
8 Deviation of atmospheric density, sound velocity and dynamic model Atmospheric density, sound velocity ±20%
9 Lift coefficient, Cl ±20%
10 Drag coefficient, Cd ±20%
(2) Taking the first of the 300 characteristic trajectories setting and results in this article. For the skip reentry
generated by the Monte Carlo analysis method as the spacecraft, the recognition window is set reasonably,
reference nominal trajectory, and the total time of the and the recognition results of the two windows are
trajectory is 2,000 s. evaluated at the same time.
(4) The trajectory number in the trajectory feature data-
Considering the distance ρ , azimuth angle A, and angle base starts from serial number 1.
of elevation E with the capabilities of the tracking equip- (5) Programing language and computer configuration:
ment, and converting them into the deviation range of the Visual Studio C++ 2010, Intel Core i5-4570pentium (R),
sub-satellite point parameters, and setting the deviation CPU 3, 20 GHz, 4-GB memory.
term according to the random normal distribution, as shown
in Table 2. It is used as the trajectory to be identified after the
smooth processing of real-time positioning data in the real
reentry process for the reentry vehicle. Refer to Table 2 for the 4.2 Simulation results
deviation range of trajectory parameters.
(3) In order to test the calculated energy consumption, 4.2.1 Identifying once per second
the sliding recognition time window is set in two
ways, once per second and once every accumulated In the current test environment, the total calculation
10 s data, so as to evaluate the recognition window takes 10.72 s to complete 2,000 evaluations. Table 3 gives
6
x 10 120
5
4
x 10 Local amplification below 120km
4.5 15
100
4
10 80
Height/m
3.5
3 5 60
Latitude/°
Local amplification below 120km
Height/m
2.5
111
40
0
Latitude/°
2 1000 1500 2000 2500 110
Time/s
1.5 20 109
1 108
0
0.5 41 42.5
Longitude/°
0 -20
0 500 1000 1500 2000 2500 -40 -30 -20 -10 0 10 20 30 40 50
Time/s Longitude/°
Figure 2: The height dispersion diagram in trajectory feature infor- Figure 3: The distribution diagram of sub-satellite points in trajec-
mation base. tory feature information base.Research on real-time reachability evaluation 211
Table 2: Error source setting of trajectory to be identified 300
Serial number Category Error term Range 250
1 Trajectory deviation Longitude (°) ±0.04
2 Latitude (°) ±0.04
200
3 Height (m) ±50
data number
150
the calculation results of fuzzy relative entropy and clo-
seness calculated with 300 groups of data in the feature 100
database every 1 s with the trajectory to be identified.
Figure 4 shows the recognition result based on the 50
relative entropy between the data per second and the
feature database, that is, the matching sequence number. 0
Figure 5 makes frequency statistics of the recognized 0 500 1000 1500 2000
Time/s
sequence number. As can be seen from Figures 4 and 5,
the four serial numbers that appear more frequently are Figure 4: Identification results of trajectory matching sequence
as follows: 389 times for serial number 1,357 times for number based on fuzzy relative entropy.
serial number 106, 284 times for serial number 36 and
187 times for serial number 141.
Figure 6 shows the recognition result based on the (2) When 1,200 s < t212 Hong Ma et al.
400 300
350
250
matching sequence number
matching sequence number
300
200
250
200 150
150
100
100
50 50
0 50 100 150 200 250
0 50 100 150 200 250
data number data number
Figure 5: Identification results of matching sequence number fre- Figure 7: Identification results of matching sequence number fre-
quency statistics based on fuzzy relative entropy. quency statistics based on fuzzy closeness.
generated by adding deviation disturbance to the
time and landing point prediction; after the first
data of No. 1. The reentry reachability evaluation
reentry phase, take the trajectory number 1 as the
algorithm designed in this article identifies itself
prediction result, and take the last point of the tra-
with disturbance, and the correctness of the algo-
jectory as the landing time and landing point of the
rithm has been verified.
landing point prediction.
(5) Determining the strategy of matching identification.
Identifying once every second, mainly according to
the second strategy of Section 2.3.
(6) The evaluation results of reentry vehicle reachability 4.2.2 Identifying once every accumulated 10 s data
are as follows: before the first reentry phase, take the
trajectory number 36 as the prediction result, and In the current test environment, the total calculation
take the last point of the trajectory as the landing takes 22.36 s and is evaluated 200 times. Table 4 gives
the calculation results of fuzzy relative entropy and clo-
seness calculated with 300 groups of data in the feature
300 database every 10 s of the trajectory to be identified.
Figure 8 shows the recognition result based on the
250 relative entropy between the data per 10 s and the feature
database, that is, the matching sequence number. Figure 9
200
makes frequency statistics of the recognized sequence
number. As shown in Figures 8 and 9, the two serial num-
data number
bers that appear more frequently are 117 times for serial
150
number 36 and 73 times for serial number 1.
Figure 10 shows the recognition result based on the
100
closeness between the data and the feature database per
10 s, that is, the matching sequence number. Figure 11
50 makes frequency statistics of the recognized sequence
number. Figures 10 and 11 show the two sequence num-
0 bers that appear more frequently are 73 times for serial
0 500 1000 1500 2000
number 1 and 71 times for serial number 36.
Time/s
Based on the aforementioned calculation results,
Figure 6: Identification results of trajectory matching sequence taking the separation point of 5,000 km capsule as the
number based on fuzzy closeness. time zero, the data accumulated every 10 s are matchedResearch on real-time reachability evaluation 213
Table 4: Results of recognition once every 10 s
Serial number 1–10 s 1–20 s 1–30 s 1–2,000 s
−4 −4 −4
Fuzzy relative entropy 0.04306 × 10 0.10183 × 10 0.40296 × 10 0.79562 × 10⁻⁴
Match result Group 180 Group 180 Group 36 Group 1
Maximum and minimum closeness 0.99993 0.99993 0.99992 0.99978
Match Result Group 153 Group 15 Group 153 Group 1
300 300
250 250
200
200
data number
data number
150
150
100
100
50
50
0
0 50 100 150 200
0
Time/s 0 50 100 150 200
Time/s
Figure 8: Identification results of trajectory matching sequence
number based on fuzzy relative entropy. Figure 10: Identification results of trajectory matching sequence
number based on fuzzy closeness.
with the feature database, and a total of about 200 cal-
culations are made. It can be seen that:
(2) When t > 1,200 s, the reentry vehicle is located after
(1) When t < 1,200 s, the reentry vehicle is located before
the first reentry phase, and the “match” recognition
the first reentry phase, and the “match” recognition
result is serial number 1.
result is serial number 36.
80
120
70
matching sequence number
100
60
matching sequence number
80 50
40
60
30
40
20
20 10
0 50 100 150 200 250 0 50 100 150 200 250
data number data number
Figure 9: Identification results of matching sequence number fre- Figure 11: Identification results of matching sequence number fre-
quency statistics based on fuzzy relative entropy. quency statistics based on fuzzy closeness.214 Hong Ma et al.
Figure 12: Height deviation.
Figure 13: Sub-satellite point deviation.
(3) Determining the strategy of matching identification. phase, and the matching degree value between the reentry
Identify once every 10 s, mainly according to the first vehicle and number 1 trajectory is high after the first reentry
strategy of Section 2.3. phase. The simulation recognition result is correct.
(4) The reachability evaluation result of the reentry vehicle is the
same as that in Section 3.2.1. The result shows that when
there are enough members in the special identification
data set, it can better reflect its essential characteris- 5 Conclusion
tics. According to the demand, the identification data
window can be reasonably selected to reduce the calcu- The real-time reachability evaluation method of reentry
lation energy consumption and improve the identifica- vehicles based on fuzzy learning is presented in this
tion probability and evaluation rate at the same time. article. Compared with the traditional real-time trajectory
and landing point prediction method of reentry vehicles
based on high fidelity reentry and guidance model, this
4.2.3 Trajectory deviation between to be identified and method only needs the sample trajectory data, which is
identification results generated by the Monte Carlo method, and based on the
calculation of fuzzy relative entropy and closeness, then
Figures 12 and 13 show the trajectory deviation relation- it can realize the real-time reachability evaluation of
ship between four groups of data of serial numbers 1, 36, reentry vehicle. The accuracy and evaluation speed can
106, and the trajectory to be identified. It also shows that adapt to the needs for the rapid response to real-time
the matching degree value between the reentry vehicle tasks. It provides a new idea and way for reentry trajec-
and number 36 trajectory is high before the first reentry tory prediction, landing point prediction and reachabilityResearch on real-time reachability evaluation 215
evaluation of non-cooperative reentry vehicles. It is sui- Funding information: This research was funded by the
table for the TT&C equipment tracking and guidance with National Natural Science Foundation of China (Grant
abnormal tracking conditions. No. 11772356, No. U21B2050).
In order to test the calculation of energy consump-
tion and the accuracy of analysis and evaluation, the Author contributions: All authors have accepted respon-
sliding recognition time window is set in two ways, sibility for the entire content of this manuscript and
once per second and once every accumulated 10 s data approved its submission.
in this article. For the skip reentry spacecraft, the recog-
nition window is set reasonably, and the recognition Conflict of interest: Authors state no conflict of interest.
results of the two windows are evaluated. After analysis,
the recognition of the two time windows requires 10.72 s
(2,000 evaluations in total) and 22.36 s (200 evaluations
in total), respectively. Obviously, the calculation speed is
faster with evaluating once per second. However, through
References
the comparison between Figures 7 and 9, it can be found
Bairstow SH. 2006. Reentry guidance with extended range
that there are more similar tracks identified in the tracking capability for low L/D spacecraft. Dissertation. Boston:
database with the evaluation result of once per second. Massachusetts Institute of Technology (MIT).
Accumulating 10 s data, with the increase of feature infor- Bairstow SH. 2007. Orion reentry guidance with extended range
mation, that is, when there are many members in the data capability using PredGuid. In: AIAA Guidance, Navigation and
Control Conference and Exhibit; 2007 Aug 20–23. Hilton Head,
set to be identified, the most similar tracks can be better
SC: AIAA. p. 2007–6427.
identified, and the accuracy is also improved. Of course,
Bi K, Wang X, Xing Y. 2015. Fuzzy clustering ensemble based on
the recognition window can also be longer, but we will fuzzy measure and DS evidence theory. Control Decision.
be anxious to know which reentry track the vehicle will 30(5):823–830.
take in real time. Increasing the measurement data accu- Chen C, Zhang Z, Sheng R, Yang M. 2021. Mission analysis and
mulation time will not improve the recognition accuracy design of half-ballistic reentry for deep space exploration.
J Deep Space Explor. 8(3):269–275.
qualitatively. However, the accuracy and calculation energy
De Grossi F, Marzioli P, Cho M, Santoni F, Circi C. 2021. Trajectory
consumption of 10 s recognition can suit the requirements optimization for the Horyu-VI international lunar mission.
of real-time tasks. Therefore, it is suggested to select it rea- Astrodynamics. 5(3):263–278.
sonably according to the display requirements of real-time De Luca A, Termini S. 1972. A definition of nonprobabilistic
monitoring system in practical application. entropy in the setting of fuzzy sets theory. Inf Control.
20(4):301–312.
Moreover, the entry phase when the reentry vehicle
Dong J, Rao W, Sun Z, Wang C, Huang X, Li Q, Li J. 2022.
enters the black barrier and cannot obtain the measure-
Interdisciplinary design and validation for key phases of
ment data is not simulated during the simulation, but martian landing missions. Jf Astron. 4(3):21–29.
when the recognition window is selected once for 10 s, Du X, Liu H. 2017. Analysis of reachable sets of lunar module skip
Figures 8 and 10 show that the recognition and evalua- entry trajectory. Zairen Hangtian. 23(2):163–172.
tion result has already converged to one track, which Fang K, Zhang Q, Ni K, Lin Cheng, Yuntao Huang. 2018. Time-coor-
dinated reentry guidance law for hypersonic vehicle. Hangkong
does not affect the presentation of the evaluation result.
Xuebao. 39(5):321958.
Of course, in order to improve the accuracy of this Fieee AF, Immediata L, Timmoneri L, Meloni M, Vigilante D. Comparison
method for reachability evaluation and landing point predic- of recursive and batch processing for impact point prediction of
tion, we need to rely on a large number of trajectory feature ballistic targets. IEEE International Radar Conference; 2005 May
samples as the basic identification database. Subsequently, 9–12; Arlington (VA), USA. IEEE; 2005. p. 121–126.
Gamble JD, Cerimele CJ, Moore TE, Higgins J. 1988. Atmospheric
the intelligent machine learning method can be used to ana-
guidance concepts for an aeroassisted flight experiment.
lyze and learn the trajectory information of Monte Carlo ana-
J Astronaut Sci. 36:45–71.
lysis in time domain and frequency domain, so as to improve Graves CA, Harpold JC. 1972. Apollo experience report-mission
its trajectory and landing point prediction ability. planning for apollo entry. Technical report. Houston. NASA
TN D-6725.
Acknowledgments: The author would like to thank Ke Xu Guo T, Song Z, Shi J. 2021. Study on predictor-corrector guidance
law for skip reentry of manned spacecraft with blunt body.
of the State Key Laboratory of Astronautic Dynamics and
Zairen Hangtian. 27(2):149–157.
Wei Zhang of the State Key Laboratory of Spacecraft In- Haitao LI, Chen S, Li Z, Fan M, Cheng C. 2021. Ground station visible
Orbit Fault Diagnosis and Maintenance for their support region determination method in Chang’E-5 reentry. J Deep
and interest in this research. Space Explor. 8(3):284–289.216 Hong Ma et al.
Hale N, Lamotte N, Garner T. Operational experience with hyper- Roh H, Oh YJ, Tahk MJ, Kwon K-J, Kwon H-H. 2020. L1 penalized
sonic entry of the space shuttle. AIAA/AAAF 11th International sequential convex programming for fast trajectory optimiza-
Space Planes and Hypersonic Systems and Technologies tion: with application to optimal missile guidance. Int J
Conference; 2022 24 Sep–4 Oct; Orleans, France. AIAA; 2002. Aeronaut Space Sci. 21(2):493–503.
Doi: 10.2514/6.2002-5259. Sánchez-Sánchez C, Izzo D. 2018. Real-time optimal control via
Huang P, He Y, Wang A, Zhang J. 2020. Analysis on real-time impact deep neural networks: study on landing problems. J Guid
point calculation method of cz-2c rocket residues. Spacecr Control Dyn. 41(5):1122–1135.
Recovery Remote Sens. 41(5):13–20. Succa M, Boscolo I, Drocco A, Malucchi G, Dussy S. 2016. IXV
Jiang X, Dang L, Li Z, Li S, Tang X. 2020. Analysis and research on avionics architecture: Design, qualification and mission
scattered range of irregular debris for uncontrolled reentry dis- results. Acta Astronaut. 124:67–78.
integration of spacecraft. Manned Spaceflight. 26(4):436–442. Taheri E, Arya V, Junkins JL. 2021. Costate mapping for indirect
Li Y, Guo J, Qi L, Liu X, Ruan P, Tao X. 2022. Density-sensitive fuzzy trajectory optimization. Astrodynamics. 5(4):359–371.
kernel maximum entropy clustering algorithm. Control Theory Tang X, Wang J, Xiao Z. 2019. Landing point prediction ballistic
Appl. 39(1):67–82. reentry spacecraft. J Nanjing Univ Aeronaut Astronaut.
Li Z, He Y, Gao C, Zhang X, Wang Q. 2020. Optimization of aeroshape 51(S):145-148.
integrated design of winged re-entry vehicles. Hangkong Terui F, Ogawa N, Ono G, Yasuda S, Masuda T, Matsushima K, et al.
Xuebao. 41(5):623356. 2020. Guidance, navigation, and control of Hayabusa2 touch-
Lin J. 1991. Divergence measures based on Shannon entropy. IEEE down operations. Astrodynamics. 4(4):393–409.
Trans Inf Theory. 37(1):145–151. Vinh NX, Busemann A, Culp RD. Hypersonic and planetary entry
Lu P. 2008. Predictor-corrector entry guidance for low-lifting vehi- flight mechanics. Ann Arbor, USA: The University of Michigan
cles. J Guid Control Dyn. 31(4):1067–1075. Press; 1980.
Ma Z, Li M, Fan Y, Li W, Xia Q. 2021. The sensitivity analysis of Vinh NX. Optimal trajectories in atmospheric flight. New York:
departure stability of hypersonic vehicle based on neural net- Elsevier; 1981. p. 222–224.
work. J Projectiles Rockets Missiles Guid. 41(1):124–134. Vivani A, Pezzella G. Winged re-entry vehicles: Aerodynamic and
Mansell JR, Grant MJ. 2018. Adaptive continuation strategy for aero thermo dynamic analysis of space mission vehicles.
indirect hypersonic trajectory optimization. J Spacecr Rockets. Berlin: Springer International Publishing; 2015.
55(4):818–828. p. 571–701.
Mehta PM, Kubicek M, Minisci E, Vasile M. 2017. Sensitivity analysis Wang J, Bian H, Chen X, Shen Y, Zhao W. 2014. Research on impact
and probabilistic re-entry modeling for debris using high point prediction methods of CZ-2F rocket fairing Debris. Zairen
dimensional model representation based uncertainty treat- Hangtian. 20(5):457–460.
ment. Adv Space Res. 59(1):193–211. Wang J, Liang H, Qin X, Qi Z, Li Z. 2019. Mapped Chebyshev pseudo
Meng Z, Gao S, Wang Z, Zhou W. 2015. Circumlunar free return spectral methods for optimal trajectory planning of differen-
trajectories design and validation for high-speed moon-to- tially flat hypersonic vehicle systems. Aerosp Sci Technol.
earth reentry mission. Sci Sin Technol. 45(3):249–256. 89(6):420–430.
Ning B, Xie J, Shan Z. 2019. Sorting method for multi-attribute Wang Y, Yang M, Yu D, Qiang D, Wang Z, Xu Y. 2021. Skip-reentry
decision-making based on relative entropy and VIKOR. Math guidance, navigation, and control technology for the Chang’e-5
Practice Theory. 49(4):35–45. lunar-return vehicle. Sci SinTech. 51:799–812.
Ono G, Terui F, Ogawa N, Mimasu Y, Yoshikawa K, Takei Y, et al. Wang Z, Grant MJ. 2017. Constrained trajectory optimization for
2020. Design and flight results of GNC systems in Hayabusa2 planetary entry via sequential convex programming. J Guid
descent operations. Astrodynamics. 4(2):105–117. Control Dyn. 10(10):2603–2615.
Peña-Asensio E, Trigo-Rodrıguez JM, Langbroek M, Rimola A, Wei W, Li H, Li J, Gu J. 2022. Ballistic impact point prediction
Robles AJ. 2021. Using fireball networks to track more frequent method based on UKF algorithm. Ordnance Ind Automat.
reentries: Falcon 9 upper-stage orbit determination from video 41(2):70–74.
recordings. Astrodynamics. 5(4):347–358. Wu Y, Deng J, Li L, Su X, Lin L. 2021. A hybrid particle swarm opti-
Phillips TH. A common aero vehicle (CAV) model, description, and mization-gauss pseudo method for reentry trajectory optimi-
employment guide. USA Corporation; 2003. zation of hypersonic vehicle with navigation information
Putnam ZR, Bairstow SH, Braun RD, Barton GH. 2008. Improving model. Aerosp Sci Technol. 118:107046.
lunar return entry range capability using enhanced skip tra- Yang S, Wang Z. 2020. A deep learning-based approach to real-time
jectory guidance. J Spacecr Rockets. 45(2):309–316. trajectory optimization for hypersonic vehicles. AIAA Scitech
Qiao H, Li Z, Li X, Sun P. 2017. A unified numerical method for air- 2020 Forum; 2020 Jan 6–10; Orlando, FL, USA. AIAA; 2020.
craft accessibility problems. J Ballist. 29(4):9–14. Doi: 10.2514/6.2020-0023.
Rea JR, Putnam ZR. A comparison of two Orion skip entry guidance You S, Wan C, Dai R, Lu P, Rea JR. 2020. Learning-based optimal
algorithms. AIAA Guidance, Navigation and Control Conference control for planetary entry, powered descent and landing gui-
and Exhibit; 2007 Aug 20–23; Hilton Head, SC, USA. AIAA; dance. AIAA Scitech 2020 Forum; 2020 Jan 6-10; Orlando (FL),
2007. p. 2007–6424. USA. AIAA. p. 849.
Richie G. The common aero vehicle: space delivery system of the future. You Z, Yang Y, Liu G, Cao X, Zheng H. 2021. Reentry guidance
AIAA Space Technology Conference and Exposition; 1999 Sep algorithm based on Kalman filter for aerospace vehicles.
28–30; Albuquerque, USA. AIAA Press; 1999. p. 1999–4435. Hangkong Xuebao. 42(11):524608.You can also read


