Resonance ionization spectroscopy of thorium isotopes - towards a laser spectroscopic identification of the low-lying 7.6 eV isomer of 229Th
←
→
Page content transcription
If your browser does not render page correctly, please read the page content below
Confidential: not for distribution. Submitted to IOP Publishing for peer review 29 June 2011

Resonance ionization spectroscopy of thorium
isotopes - towards a laser spectroscopic
                                                                                         229
identification of the low-lying 7.6 eV isomer of                                               Th
            S Raeder1 , V Sonnenschein1,2 , T Gottwald1 , I D Moore2 , M
            Reponen2 , S Rothe1,3 , N Trautmann4 , and K Wendt1
            1
              Institute of Physics, University of Mainz, Staudingerweg 7, 55128 Mainz, Germany
            2
              Department of Physics, University of Jyväskylä, Survontie 9, 40014 Jyväskylä,
            Finland
            3
              CERN, CH-1211 Genve 23, Switzerland
            4
              Institute of Nuclear Chemistry, University of Mainz, Fritz-Straßmann-Weg 2, 55128
            Mainz, Germany
            E-mail: raeder@uni-mainz.de, volker.t.sonnenschein@jyu.fi

            Abstract.
                In-source resonance ionization spectroscopy was used to identify an efficient
            and selective three step excitation/ionization scheme of thorium, suitable for
            titanium:sapphire (Ti:sa) lasers. The measurements were carried out in preparation of
            laser spectroscopic investigations for an identification of the low-lying 229 m Th isomer
            predicted at 7.6 ± 0.5 eV above the nuclear ground state. Using a sample of 232 Th,
            a multitude of optical transitions leading to over 20 previously unknown intermediate
            states of even parity as well as numerous high-lying odd parity auto-ionizing states
            were identified. Level energies were determined with an accuracy of 0.06 cm−1
            for intermediate and 0.15 cm−1 for auto-ionizing states. Using different excitation
            pathways an assignment of total angular momenta for several energy levels was possible.
            One particularly efficient ionization scheme of thorium, exhibiting saturation in all
            three optical transitions, was studied in detail. For all three levels in this scheme,
            the isotope shifts of the isotopes 228 Th, 229 Th, and 230 Th relative to 232 Th were
            measured. An overall efficiency including ionization, transport and detection of 0.6 %
            was determined, which was predominantly limited by the transmission of the mass
            spectrometer ion optics.

            PACS numbers: 32.30.-r, 32.80.Rm, 32.80.Zb, 42.62.Fi
Resonance ionization spectroscopy of thorium isotopes                                    2

1. Introduction

High resolution γ-spectroscopic experiments predict the existence of an isomeric state
                           +
of 229 Th, 229 m Th, I = 32 , with an excitation energy of only 7.6 ± 0.5 eV [1] above the
                              +
ground state 229 g Th, I = 52 . This is the lowest excitation energy of an excited state in
any nucleus known so far, lying in the range of typical atomic excitation and ionization
energies. The γ-spectroscopic measurements used a differencing technique of γ-ray de-
cay paths to infer the excitation energy from the observed spectra. Direct observation
of the decay of the isomer via a M1 transition to the nuclear ground state was not suc-
cessful. The reason for this was in part attributed to earlier expectations, which pointed
towards a lower excitation energy of about 3.5 eV [2]. This resulted in several searches
for UV emission from 229 m Th in an incorrect wavelength regime [3, 4, 5]. In addition,
non-radiative decay paths, such as internal conversion and electron scattering [6, 7], as
well as absorption of the 160 nm VUV decay photons in most media might obscure the
results and would require a dedicated experimental setup. The half-life of 229 m Th is
theoretically estimated to be about 1 to 5 hours by extrapolation from a comparable
transition of the 233 m U isomer [1] connecting the same Nilsson states but with an energy
difference of 312 keV, as well as from calculations based on another M1 transition in the
229
    Th nucleus [8]. Nevertheless, large deviations from this estimate could be possible
depending on the exact electronic configuration [6]. Earlier calculations, based on the
lower excitation energy of 3.5 eV, neglected the possibility of internal conversion that
becomes possible when accepting the energy of 7.6 eV, which is higher than the ioniza-
tion potential of 6.32 eV for thorium. A recent experiment [9] hints at a half-life of less
than 2 hours, probably affected by the chemical conditions of the sample.
Aside from the basic nuclear physics interest, the low-lying isomer would provide a
unique opportunity for fundamental research on laser-optical atom-to-nucleus coupling.
For example, its use as a nuclear time standard of ultimate precision was proposed [10].
With respect to state-of-the-art atomic clocks a nuclear clock could exhibit significant
advantages, e.g., the nucleus is shielded from its environment by the surrounding elec-
tron shell, preventing or at least tremendously reducing line-shifts induced by external
fields. The currently estimated half-life of the isomeric state would result in a linewidth
of less than 1 mHz, leading to a theoretical precision of ∆λ/λ ≈ 10−19 , outbalancing
current high precision clocks by about two orders of magnitude. In addition, the strong
dependence of the transition on the balance of individual fundamental forces within the
nucleus could yield an amplification of several orders of magnitude of any frequency shift
effect, e.g., induced by a potential variation of the electromagnetic coupling constant α
with time [11], or of the constituent quark masses [12]. In this manner, long term com-
parisons of a hypothetical 229 m Th clock to a conventional atomic clock could stimulate
the ongoing research on the cosmological evolution of the fundamental force coupling
constants. Regarding the field of quantum optics and quantum computing, a nuclear
isomeric state that could be directly interrogated by laser light also could serve as a
dedicated qubit with extraordinary features. Finally, the isotope 229 Th is most likely
Resonance ionization spectroscopy of thorium isotopes 3
a suitable candidate for NEET (Nuclear Excitation by Electron Transition), a process,
which could help in pumping the isomeric state from the ground state [13].
In order to ascertain the existence of the predicted low-lying isomeric state of the
nucleus 229 Th, an alternative approach to gamma spectroscopy or other means of direct
observation of the decay is needed. This could involve the identification of the isomer
through a measurement of its specific hyperfine structure within a selected optical res-
onance in the atomic spectrum in comparison with to the well known structure related
to the influence of the nuclear ground state coupling to the electron shell. In this work
we describe laser spectroscopic investigations which serve as important preparation of
such experimental activities.
One method to produce the radioisotope 229 Th is via the alpha decay of the parent
nucleus 233 U, whereby a small branching ratio of about 2 % of the decay populates the
low-lying isomeric level [9]. In the last few years, efforts at the Jyväskylä IGISOL ioso-
tope separator facility, Finland, have concentrated on the development of a novel ion
guide system optimized for the extraction of daughter recoil nuclei originating from the
α-decay of, e.g., a 233 U source [14]. The source, electroplated onto stainless steel strips,
is mounted on the inside surface of a helium-filled gas cell. Gas flow and an electrical
guiding field efficiently extract the decay recoils as positively charged ions, primarily
in a singly- or doubly-charged state. After a number of gas cell improvements the ex-
traction efficiency for decay products of 233 U, namely 221 Fr (T1/2 = 4.9 min) and 217 At
(T1/2 = 32 ms), has been increased to about 16 %. On the other hand, the extraction
efficiency for 229 Th does not exceed 1.6 % [15], a factor of 10 lower. This difference is
ascribed to a considerable fraction of thorium persisting in or converting into the neutral
state. With a generation rate of ≈ 105 recoils of 229 Th per second in the present setup
a 229 m Th beam production with an intensity of approximately 30 ions/s is expected.
For both the nuclear ground state as well as the isomeric atoms the optical excitation
probability of each atomic transition is distributed over several hyperfine components
differing in their total angular momentum. This fact significantly reduces optical line
strength on a given wavelength of resonance. Combined with a limited fluorescence de-
tection efficiency of typically only about 0.02 % and considerable background in a laser
spectroscopy arrangement providing high resolution as, e.g., collinear fast beam laser
spectroscopy [16], successful unfolding of the isomeric hyperfine structure from that of
the ground state is highly unlikely. However, considering a reasonably large fraction of
neutral thorium recoils, the opportunity for increasing the extraction efficiency through
the use of laser ionization via in-source resonance ionization on the neutral species, be-
comes highly favourable.
Laser Ion Sources (LIS) give access to efficient and selective ionization [17] at on-line
facilities such as ISOLDE at CERN, Geneva, Switzerland, ISAC at TRIUMF, Vancou-
ver, Canada or others [18]. Today, state-of-the-art solid state laser systems are increas-Resonance ionization spectroscopy of thorium isotopes 4
ingly used for efficient multi-step resonant excitation and ionization of the atoms of a
specific element. This technique of resonance ionization spectroscopy (RIS) is also under
development for application at the IGISOL system in Jyväskylä using Titanium-sapphire
(Ti:sa) lasers. There it will be adapted for use in combination with the aforementioned
gas cell and ion guide technique with a special focus on the production of 229 Th ions.
As a first step for preparation of a highly sensitive laser-based detection technique of
the isomer 229 m Th, Ti:sa laser RIS on thorium has been carried out in the LARISSA
laboratory at Mainz University, Germany, in order to identify suitable resonant laser
excitation and ionization schemes.
A number of laser spectroscopic investigations on thorium have been performed
earlier, e.g., for analytics or for addressing the study of isotope shifts and the hyperfine
structure of 229 Th in order to determine nuclear charge radii and nuclear moments [19].
Previous RIS investigations on thorium applied pulsed as well as continuous-wave dye
lasers within a simple two-step excitation/ionization scheme. The pulsed laser RIS
localized low-lying excited levels of odd parity around 26 000 cm−1 as well as numerous
even parity auto-ionizing levels just above the ionization potential at 50 867 cm−1 [20].
Due to the use of high laser power considerable background was generated, which
hampered the foreseen development of a high precision, high accuracy determination
technique for thorium isotope ratios in geological samples [21]. Correspondingly, the
technique of continuous wave laser RIS was also established by one of the groups
using non-resonant ionization by a high power argon ion laser. An impressive overall
efficiency of this technique of up to 0.4 % has been demonstrated [20]. In the present
study an excitation/ionization scheme involving three resonant steps is favoured, which
promises comparable or even higher efficiency in combination with high suppression of
background from uranium, which could be generated either by non-resonant ionization
or by fragmentation of uranium oxide induced by any blue to UV laser radiation.
2. Experimental setup
The laser system used for the measurements presented in this work is composed of a set
of three tunable nanosecond Ti:sa lasers jointly pumped by a commercial frequency
doubled Nd:YAG laser (Photonics Industries DM 532-80) with a repetition rate of
typically 10 kHz. Output power reaching up to 3 W is obtained with a pump laser
power of about 16 W per Ti:sa laser. Frequency selection is achieved by a combination
of birefringent filter and etalon within the laser resonator [22], which results in a
spectral bandwidth of 5 GHz. However, such a laser construction provides only limited
wavelength tunability. Therefore, one of the lasers is equipped with a grating mounted
in Littrow configuration for frequency selection [23]. This laser exhibits a continuous
frequency tuning range from 710 nm up to 950 nm, which is ideally suited for the long
range search of unknown atomic transitions. Single pass second harmonic generation
(SHG) of the fundamental Ti:sa laser radiation in an optical nonlinear crystal (β-Resonance ionization spectroscopy of thorium isotopes 5
# $ % & !"
+ - $
.
!) /'
(
'
!"
*
+ ,
Figure 1. Schematic experimental setup: laser system consisting of three Ti:sa lasers
and a Nd:YAG pump laser, mass spectrometer with graphite oven, quadrupole mass
filter and ion detector. The components are controlled by the data acquisition system.
BaB2 O4 ) is employed to obtain up to 500 mW output power in the blue to UV spectral
range. The typical pulse length is approximately 40 ns. Pulses of individual lasers
are temporally synchronized within 5 ns using fast Pockels cell switching. The time
structure as well as the wavelength of each laser is monitored by fast photodiodes and
commercial wavemeters (High Finesse WS6, ATOS LM007), respectively. The laser
beams are finally overlapped and focussed, resulting in a beam waist radius of about
0.1 mm within the center of the graphite oven (inner diameter 2.2 mm, 50 mm length)
of the MABU (Mainz Atomic Beam Unit) spectroscopic setup. A schematic sketch of
the latter is given in Figure 1.
Samples for spectroscopic investigations contained about 1015 atoms of 232 Th in
nitric acid solution. Each solution was dried on a small piece of zirconium foil, which was
folded for improved reduction of thorium oxides into neutral thorium, and inserted into
a graphite oven. A long-term stable atom source was achieved by carefully heating the
oven resistively up to 1600 K. The evaporated thorium atoms are then resonantly excited
and subsequently ionized by laser radiation inside the oven. The resulting photo ions,
as well as thermally produced interfering surface ions, were extracted and guided by ion
optics to a static quadrupole deflector. Deflecting the ion beam by 90◦ separated the ions
from the neutral particles and allowed for a convenient injection of the laser radiation
into the interaction region inside the oven. A subsequent quadrupole mass filter was
used to suppress surface ions of different masses produced in the hot cavity. To ensure
reasonable transmission in the order of 10 % the mass filter was tuned to a somewhat
reduced mass resolution of m/∆m ≈ 200 during the spectroscopic experiments. Ions of
interest were finally detected quantitatively by an off-axis channeltron detector operated
in single ion counting mode. Data acquisition was performed with a LabView program
and included reading of the ion count rate, monitoring of the wavelengths of the lasers
run with fixed frequencies as well as the control of the grating laser tuning and the
quadrupole mass filter settings.Resonance ionization spectroscopy of thorium isotopes 6
232Th
A B C
IP 50 867 cm-1
3rd Step
SES
Scan
2nd Step
26 878.16 cm-1 26 287.05 cm-1 26 113.26 cm-1 FES
6d27s7p 3G°3 6d27s7p 3D°1 J=2
1st Step 372.05 nm 380.42 nm 382.94 nm
Aki=2.2xx107 s-1 Aki=1.3xx108 s-1 Aki=1.9xx107 s-1
0 cm-1
6d27s2 3F2 GS
Figure 2. Selected strong transitions for the first excitation step of suitable ionization
schemes for thorium. J-Values, A-factors and configurations are taken from [25, 26].
3. Measurements and Results
An efficient excitation and ionization scheme for atomic thorium requires knowledge
of suitable high-lying energy levels as well as auto-ionizing states above the ionization
potential (IP). Existing information on the spectrum of thorium is quite limited, with
transitions and configurations known only for energy levels up to 38 000 cm−1 and the
ionization potential of thorium is reported to be 50 867(2) cm−1 [24]. Correspondingly,
for all investigations reported in this study three step ionization schemes with the first
excitation step in the blue to UV wavelength region followed by two excitation steps in
the infrared, were selected.
3.1. Intermediate states
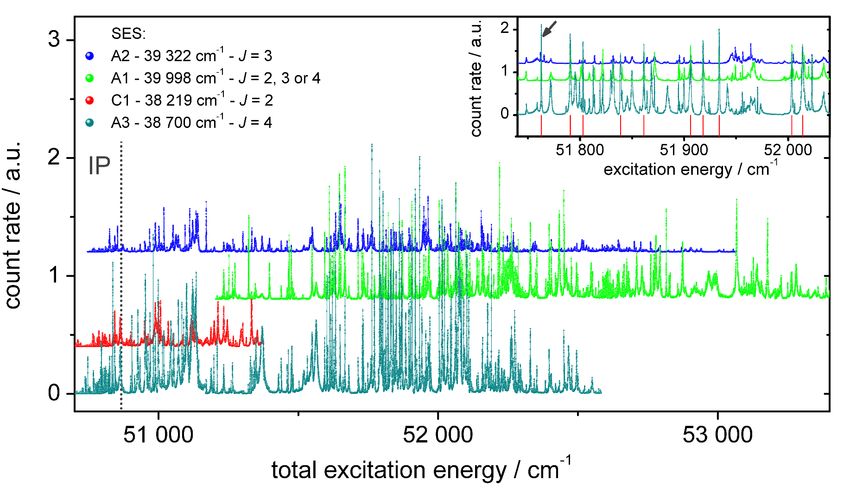
Three well known energy levels [25, 26] accessible by frequency doubled Ti:sa laser
radiation and exhibiting high transition strengths from the atomic ground state (GS)
were chosen as first excited states (FES) as shown in Figure 2. For further excitation
into unknown high-lying excited states from one of these FESs, the grating-assisted
Ti:sa laser was scanned over an extended wavelength range from 715 nm to 880 nm
with a spectral step width of about 0.01 cm−1 (0.3 GHz). A third laser operating at a
wavelength around 730 nm ensured non-resonant photo-ionization from levels populated
by the scanning laser. Numerous even parity levels in an energy region from 37 500 cm−1
to 40 500 cm−1 with a total angular momentum J2 = J1 − 1, J1 , J1 + 1, where J1
indicates the angular momentum of the FES, were identified. Information on the angular
momentum of each energy level was obtained by exciting the same energy level from
different FES with different J-values. Figure 3 shows the combined laser scans from
all three FESs with an artificial individual offset introduced for visual clarity. In theseResonance ionization spectroscopy of thorium isotopes 7
Figure 3. Three scans for high lying levels of even parity starting from different FES
of odd parity, denoted A, B and C according to Figure 2. For clarity the individual
scans are separated by an artificial offset. Resonances addressed in further studies
are indicated by A1, A2, A3 and C1. The inset shows a detailed scan of one of
the intermediate states used for the precise evaluation of level energies. Along the
horizontal axis earlier known and newly determined resonances are marked by short
green and slightly larger orange dashes, respectively.
spectra, 24 transitions to previously unknown levels were identified in addition to the
confirmation of 43 levels already mentioned in the literature [26]. Finally, detailed laser
scans with high spectral resolution were performed for all newly observed levels as well
as for a few of the earlier known levels for reference.
The experimental data of each individual resonance were found to be well described
by a saturated Gaussian function given by
S0 · G(E0 , wG )
y = y0 + A0 · (1)
S0 · G(E0 , wG ) + 1
with
−(E−E0 )2
1 2·w2
G(E0 , wG ) = p 2
·e G (2)
2π · wG
and the centroid energy E0 , the Gaussian linewidth wG , the saturation parameter S0 ,
the amplitude of the peak A0 and an offset y0 . This confirms the assumption that
the spectroscopic signal is dominated by the Gaussian spectral distribution of the laser
convoluted with similarly shaped Doppler profile of the atom ensemble inside the source,
while a contribution from the natural linewidth is not visible. An example for such
a fit is shown in the inset of Figure 3, exhibiting a FWHM of about 0.2 cm−1 . All
newly observed levels of even parity as discovered in this work are tabulated in Table 1
with their centroid energy, relative signal strength and possible J-values. The latterResonance ionization spectroscopy of thorium isotopes 8
Table 1. Newly identified high-lying energy levels of even parity in atomic thorium.
Signal strength indicates the intensity of the ion signal on each resonance populated,
as related to one of the three FESs, denoted A, B, C with JFES = 3,1,2, respectively,
according to Figure 2. Labeling is: strong (S), medium (M), weak (W) or not visible
(n). The excitation of the individual levels from different first excited steps constrain
the J-values; possible values are given. In case of ambiguity the most probable J-value
is printed in bold.
Energy Signal strength J
cm−1 from FES A,B,C
1 38 021.14(6) n,W,S 1,2
2 38 028.82(8) n,W,n 0,1,2
3 38 221.68(8) n,W,n 0,1,2
4 38 394.92(8) n,M,n 0,1,2
5 38 443.82(6) M,n,W 3,2
6 38 960.68(7) S,S,W 2
7 39 106.15(5) n,S,M 1,2
8 39 324.25(7) S,S,W 2
9 39 357.28(4) n,S,W 1,2
10 39 419.39(8) n,S,M 1,2
11 39 548.81(5) n,S,M 1,2
12 39 567.43(8) n,S,n 0,1,2
13 39 710.05(6) S,n,W 2,3
14 39 964.65(6) M,S,M 2
15 39 997.59(8) M,n,n 2,3,4
16 40 024.98(8) W,M,M 2
17 40 059.75(8) n,W,n 0,1,2
18 40 079.71(5) n,M,W 1,2
19 40 084.72(8) W,n,W 2,3
20 40 185.14(5) W,M,S 2
21 40 280.93(8) M,-,- 2,3,4
22 40 350.52(8) M,-,- 2,3,4
23 40 577.38(8) W,-,- 2,3,4
24 40 697.45(8) W,-,- 2,3,4
are restricted by the excitation of the individual levels from different FESs; with the
most probable J-value printed in bold in case of ambiguity. The statistical error for
the centroid energy, as determined from several measurements of the same level, is
given. The relative signal strength, as indicated only qualitatively in Table 1 by a
letter code, is specific for the experimental arrangement and the conditions used in this
work. However, this rough classification is sufficient for the identification of an efficient
excitation scheme, while absolute transition strengths could not be determined with the
present setup.Resonance ionization spectroscopy of thorium isotopes 9
232Th
A1 A2 A3 C1
AI
Scan IP 50 867 cm-1
3rd Step
39 997.59 cm-1
39 321.81 cm-1 38 700.25 cm-1
J2 = 2,3 or 4 38 219.03 cm-1 SES
J2 = 3 J2 = 4
J2 = 2
2nd Step 762.23 nm 803.62 nm 845.87 nm 826.05 nm
26 878.16 cm-1
26 113.26 cm-1 FES
6d27s7p 3G°3
J1 = 2
1st Step 372.05 nm 382.94 nm
Aki=2.2xx107 s-1 Aki=1.9xx107 s-1
0 cm-1
6d27s2 3F2 GS
Figure 4. Schemes for the search for auto-ionizing resonances of odd parity. From
four SESs of even parity and different J-value, laser scans for excitation just above the
ionization potential were performed.
3.2. Auto-ionizing and Rydberg states
Suitable final excitation steps towards ionization were determined in a similar manner
as the second excited states (SES). While the first two excitation steps were kept
fixed on selected resonances, the grating-tuned Ti:sa laser was scanned to cover the
region ranging from 50 700 cm−1 to 53 000 cm−1 of total excitation energy. The four
intermediate excitation steps with strong ion signal, which were chosen for these further
investigations, are shown in Figure 4. As visualized in Figure 5 the level density
observed in the energy region covered is much higher than the one in the region of the
SESs around 38 000 cm−1 , which is shown in Figure 3. All spectra recorded are highly
complex, containing numerous peaks with different linewidths. In addition, overlapping
of different structures and the occurrence of significant interference effects are observed.
Correspondingly, no Rydberg series could be identified unambiguously in any of the
spectra.
The inset in Figure 5 shows a detailed view of the most interesting region for the
determination of a suitable, highly efficient ionization scheme. It enlarges the region
of strongest transition strengths but also of highest level density. A number of narrow
transitions with resonance widths comparable to the laser linewidth of 5 GHz is observed
here. These auto-ionizing levels provide very high ionization rates, a factor of ∼100
above the background of non-resonant ionization. Table 2 indicates the ten strongest
auto-ionizing resonances determined in these scans, all starting from the same SES (A3)
located at 38 700.25 cm−1 and exhibiting rather similar ionization probability.Resonance ionization spectroscopy of thorium isotopes 10
Figure 5. Spectra of AI resonances just above the IP, which is indicated at the left
hand side. A very high level density is observed. Excitation started from one of four
different high-lying SESs as given. The inset shows the region of 51 700 − 52 100 cm−1
with the strongest AI resonances in more detail. The energetic position of resonances
used for further investigation as summarized in Table 2 are indicated by red dashes.
The strongest AI resonance indicated by the arrow is selected for the final ionization
scheme.
Table 2. Compilation of the ten strongest AI resonances of odd parity investigated.
All resonances were observed starting from the same SES at 38 700.25 cm−1 from
scheme A3. The relative line strength indicates the ion signal relative to the strongest
AI level, which is denoted level 1. A restriction on possible J-values is deduced from
comparing excitation from SESs with different J2 .
Level Energy rel. strength width J
cm−1 cm−1
1 51 762.84(15) 1.0 0.25 3,4,5
2 51 790.65(15) 0.8 0.60 3,4
3 51 802.84(15) 0.8 0.26 3,4,5
4 51 839.03(15) 0.7 0.46 3,4,5
5 51 861.38(15) 0.8 0.34 3,4
6 51 906.20(15) 0.7 0.73 3,4
7 51 918.27(15) 0.9 0.45 3,4
8 51 933.81(15) 1.0 0.36 3,4,5
9 52 003.55(15) 0.7 0.34 3,4,5
10 52 014.01(15) 0.7 0.90 3,4,5Resonance ionization spectroscopy of thorium isotopes 11
232Th
AI
51 762.84 cm-1
IP 50 867 cm-1
765.54 nm
J2 = 4 38 700.25 cm-1
SES
845.87 nm
J1 = 3 26 878.16 cm-1
FES
372.05 nm
J0 = 2 GS
0 cm-1
Figure 6. Final three step ionization scheme for 232 Th with detailed scans for each
excitation step (left) and saturation curves (right).
3.3. Characterization of the ionization scheme
3.3.1. Saturation The excitation scheme finally chosen involves a strong, yet narrow
auto-ionizing level at 51 762.84 cm−1 . The scheme is depicted in Figure 6 in combination
with the saturation behavior as well as detailed spectral scans of each step. The
latter were performed using significantly higher laser power for better statistics and
correspondingly a slight Lorentzian contribution in the line shape appeared due to
saturation effects. Peaks were thus fitted with a saturated Voigt profile, in which the
Voigt convolution was used in 1 instead of the simple Gaussian distribution. The third
excitation step towards ionization shows an interference structure together with a weak
overlapping peak. Both effects are clearly visible in the logarithmic scaling chosen but
cannot be assigned unambiguously to any known configuration.
For saturation measurements the ion signals were recorded as function of the laser
power of each one of the excitation steps, while the power in the remaining two excitation
steps were kept fixed. The resulting saturation curves were fitted with a function of the
form
P/PS
f (P ) = I0 + m · P + A · , (3)
(1 + P/PS )
which extends the conventional saturation formula for a two-level atomic excitation with
an additional linear term. The offset parameter I0 accounts for the thermal ionization
as well as non-resonant photo ionization, while P represents the laser power and PS the
saturation power. The linear increase with a slope m accounts for deviations from the
basic saturation behavior, which arise from non-resonant ionization processes driven by
the laser whose power is varied during the measurement.Resonance ionization spectroscopy of thorium isotopes 12
Figure 7. (A): Isotope shift of excited states in the ionization scheme of Figure 6 for
228
Th, 229 Th, 230 Th, and 232 Th. Literature values are given for 230 Th/232 Th, taken
from [26], and for 229 Th, taken from [27]. (B): Two dimensional scan of the first and
second excitation step for 229 Th versus 232 Th for the first two excitation steps.
Table 3. Energy level positions of the ionization scheme for the isotopes
228
Th,229 Th,230 Th, and 232 Th and level isotope shifts; literature values as indicated.
228 229 230 232
Th Th Th Th
first excited state (FES)
measured cm−1 26 878.81(4) 26 878.70(6) 26 878.48(4) 26 878.18(4)
literature cm−1 26 878.76c 26 878.49b 26 878.16b
Level ISa cm−1 0.63(4) 0.52(6) 0.30(4) 0
second excited state (SES)
measured cm−1 38 701.25(4) 38 701.07(8) 38 700.76(4) 38 700.28(4)
literature cm−1 38 700.75b 38 700.25b
Level ISa cm−1 0.97(4) 0.79(6) 0.47(4) 0
auto-ionizing state (AI)
measured cm−1 51 763.77(7) 51 763, 63(9) 51 763, 34(5) 51 762, 92(5)
Level ISa cm−1 0.85(4) 0.71(6) 0.42(4) 0
a
Isotope Shift (A Th - 232
Th), b
taken from [26], c
taken from [27].
As shown in Figure 6 by the dotted curve, which omits the linear non-resonant
ionization term, all transitions in the excitation scheme of interest can be fully saturated
with the available laser powers. Corresponding saturation power values measured in this
setup are 2.2 mW for the first transition, 68 mW for the second and 125 mW for the third
transition, respectively. Utilizing the totally available laser power for each excitation
step, it can be estimated that saturation could be obtained on an atom-laser interaction
area about ten times larger than the 0.03 mm2 used here. This fact could prove useful in
future experiments, for example regarding the rather large gas cell volume of the 229 Th
recoil ion guide mentioned previously.Resonance ionization spectroscopy of thorium isotopes 13
3.3.2. Isotope shifts and hyperfine structure The determination of the isotope shifts
as well as the prediction of a potential isomer shift for the individual energy levels of
the atomic excitation scheme is of utmost importance. Clearly, for investigations on the
low-lying isomer in 229 Th, the most interesting shift is the one between the 229 Th nuclear
ground state and the isomeric state. The thorium nitrate sample used in this work also
contained minor amounts of 228 Th and 230 Th. Thus, for completeness, the corresponding
isotope shifts for these isotopes relative to 232 Th were determined. All data are given
in Table 3 as absolute level energies for each isotope together with level isotope shifts.
Transition isotope shifts may be deduced by subtraction. Isotope shifts of 230 Th for the
first and second excited levels were reported already earlier in literature [26], while for
229
Th only the isotope shift for the first step was quoted in [27]. No earlier data exists
for the isotope 228 Th. All values measured in this work agree very well with the previous
results, as illustrated in Table 3. Figure 7 (A) graphically visualizes the level isotope
shifts for each individual excitation, plotted as total level energies. The plot indicates
a linear trend for the even A isotopes together with a weak odd-even staggering for
the isotope 229 Th as expected. Due to a different saturation behavior in the unresolved
hyperfine components of the odd A isotope 229 Th, the energy level positions determined
in this work from the unresolved peak structure do not necessarily represent the center of
gravity of the hyperfine splitting precisely. The size of this effect can be estimated from
the widths and the very slight asymmetries observed in the individual resonance lines.
Errors on the energy level positions for the isotope 229 Th were enlarged correspondingly.
In general, the relative isotope shifts for each individual energy level correspond well to
the changes in mean-square nuclear charge radii of thorium isotopes as given by [19].
This behavior is expected in this high Z−region where the volume effect dominates the
isotope shift and a possible mass effect can be neglected.
A two dimensional spectrum of the isotope shifts of 229 Th versus 232 Th in the first
two levels is given in Figure 7,(B), depicting a limited optical isotope selectivity with
slight overlap of the two peaks. The two dimensional resonance peak shapes and widths
are dominated by the laser line width and the scanning step size. The pronounced
diagonal peak enhancement predominantly visible for the much stronger signal of 232 Th
is induced by a resonance enhanced two photon process with both excitation steps
being near-resonant and the sum energy exactly matching the level energy of the SES.
As briefly mentioned above, no indication of the 229 Th hyperfine structure has been
observed in either one of the two transitions, indicating that its overall spread is always
well below the experimental linewidth of 0.3 cm−1 .
3.3.3. Ionization efficiency The overall ionization efficiency was determined by
evaporating a precisely known number of atoms of 229 Th until complete exhaustion
and accumulation of the corresponding resonance ion counts in the detector, as shown
in Figure 8. The signal showed highest release of thorium at about 1900 K oven
temperature, while maximum heating reached up to 2300 K. From the behavior of the
count rate as function of the steadily increased oven temperature we conclude that atResonance ionization spectroscopy of thorium isotopes 14
Figure 8. Efficiency measurement on a sample of 4 × 10¹¹ atoms of 229 Th. The
furnace temperature was stepwise increased and the signal of laser-ions as well as of
non-resonant background was recorded as a function of time.
this maximum value the sample is almost totally evaporated. An efficiency value of 0.6 %
was obtained by substracting the background from the integrated signal. The value was
reproduced with only marginal variations in three individual measurements. It includes
all possible losses within the individual processes of evaporation, chemical reduction of
the oxide, atomization, resonance excitation and ionization and ion beam transmission
through the apparatus. In the present setup, which was optimized for spectroscopic
application instead of analytics, the latter is expected to cause the dominant limitation.
From ion optical simulations the transmission is estimated to be of the order of only
about 10 %. Thus a further significant enhancement of the overall efficiency for in-source
resonance ionization of Th is expected by correspondingly optimizing the transmission
with the trade-off of a reduced mass resolution or by alternatively chosing a high
transmission magnetic sector field mass separator for these experiments.
4. Conclusion and Outlook
For the identification of a suitable efficient three-step resonance ionization scheme for
thorium, in-source resonance ionization spectroscopy was carried out. From hundreds
of observed resonances the level energies and restrictions on the angular momenta
for 24 previously unknown intermediate atomic energy levels and ten strong auto-
ionizing states were extracted. A dedicated resonance ionization scheme was selected
and characterized by measurements on saturation power and isotope shifts, while the
hyperfine structure of the odd-A isotope 229 Th could not be resolved. An overall
ionization efficiency of 0.6 % was determined for our experimental arrangement, which
agrees well with the expectations. This excitation scheme will be used in the near future
at the 229 Th source for experiments at the Jyväskylä IGISOL facility. By accessing the
large neutral fraction of the recoil nuclei a significant efficiency increase in the low-
energy radioactive ion beam production is envisaged. In this manner, the requiredResonance ionization spectroscopy of thorium isotopes 15
beam intensity for high resolution collinear fast beam laser fluorescence spectroscopy on
the hyperfine structure of the nuclear ground and isomeric state of 229 Th may hopefully
become possible.
A high resolution measurement of the hyperfine structure of the ground state of
229
Th has recently been realized, utilizing an injection-locked narrow bandwidth Ti:sa
laser. These data are presently under evaluation and the results will be published
soon. In order to finally fully establish the existence of the still mysterious 229m Th
isomer via its atomic hyperfine structure, these kind of measurements serve as an
important prerequisite by delivering a precise template of the nuclear ground state and
the corresponding hyperfine pattern beforehand.
Acknowledgments
This research was funded by the ”Bundesministerium für Bildung und Forschung” under
contract number BMBF-06Mz228 and supported by the GRASPANP Graduate School
in Particle and Nuclear Physics of Finland.
References
[1] B. R. Beck, J. A. Becker, P. Beiersdorfer, G. V. Brown, K. J. Moody, J. B. Wilhelmy, F. S. Porter,
C. A. Kilbourne, and R. L. Kelley. Energy Splitting of the Ground-State Doublet in the Nucleus
229
Th. Phys. Rev. Lett., 98:142501, 2007.
[2] R. G. Helmer and C. W. Reich. An excited state of 229 Th at 3.5 eV. Phys. Rev. C, 49(4):1845–1858,
1994.
[3] G. M. Irwin and K. H. Kim. Observation of electromagnetic radiation from deexcitation of the
229
Th isomer. Phys. Rev. Lett., (6):990–993.
[4] D. S. Richardson, D. M. Benton, D. E. Evans, J. A. R. Griffith, and G. Tungate. Ultraviolet
photon emission observed in the search for the secay of the 229 Th isomer. Phys. Rev. Lett.,
80(15):18–20, 1998.
[5] R. W. Shaw, J. P. Young, S. P. Cooper, and O. F. Webb. Spontaneous ultraviolet emission from
233
Uranium / 229 Thorium samples. Phys. Rev. Lett., 82(6):1109–1111, 1999.
[6] E. V. Tkalya. Properties of the optical transition in the Th-229 nucleus. Physics - Uspekhi 46
(3), 46(3):315–320, 2003.
[7] E. V. Tkalya, A. N. Zherikhin, and V. I. Zhudov. Decay of the low-energy nuclear isomer 229 Thm
(3/2+ , 3.5±1.0 eV ) in solids (dielectrics and metals): A new scheme of experimental research.
Phys. Rev. C, 61:064308, 2000.
[8] A. M. Dykhne and E. V. Tkalya. Matrix element of the anomalously low-energy 3.5±0.5 eV
transition in 229 Th and the isomer lifetime. JETP Lett., 67(4):251–256, 1998.
[9] H. Kikunaga, Y. Kasamatsu, H. Haba, M. Hara, K. Takamiya, T. Ohtsuki, A. Yokoyama,
T. Nakanishi, and A. Shinohara. Half-life estimation of the first excited state of 229 Th by
using alpha-particle spectrometry. Phys. Rev. C, 80:034315, 2009.
[10] E. Peik and Chr. Tamm. Nuclear laser spectroscopy of the 3.5 eV transition in Th-229. Europhys.
Lett., 61:181–186, 2003.
[11] E. Litvinova, H. Feldmeier, J. Dobaczewski, and V. Flambaum. Nuclear structure of lowest 229 Th
states and time-dependent fundamental constants. Phys. Rev. C, 79:064303, 2009.
[12] V. Flambaum and R. Wiringa. Enhanced effect of quark mass variation in Th-229 and limits from
Oklo data. Phys. Rev. C, 79(3):034302, 2009.Resonance ionization spectroscopy of thorium isotopes 16
[13] I. Izosimov. Role of autoionization states in nuclear excitation and triggering by an electron
transition (NEET). J. Nucl. Sci. Technol. Supplement, (6):1–5, 2008.
[14] B. Tordoff, T. Eronen, V. V. Elomaa, S. Gulick, U. Hager, P. Karvonen, T. Kessler, J. Lee,
I. Moore, A. Popov, S. Rahaman, and T. Sonoda. An ion guide for the production of a low
energy ion beam of daughter products of α-emitters. Nucl. Instrum. Meth. B, 252:347–353,
2006.
[15] I. Moore. Implementation of electrical fields in the gas cell concept. Technical Report Task
T-J08-5, KU Leuven, Jyväskylä, Mainz, IN2P3, Manchester, 2008.
[16] B. Tordoff, J. Billowes, P. Campbell, B. Cheal, D. H. Forest, T. Kessler, J. Lee, I. D. Moore,
A. Popov, and G. Tungate. Investigation of the low-lying isomer in 229 Th by collinear laser
spectroscopy. Hyp. Interact., 171:197–201, 2007.
[17] C. Geppert. Laser systems for on-line laser ion sources. Nucl. Instrum. Meth. B, 266:4354–4361,
2008.
[18] V. N. Fedosseev, L. E. Berg, N. Lebas, O. J. Launila, M. Lindroos, R. Losito, B. A. Marsh, F. K.
Osterdahl, T. Pauchard, G. Transtromer, and J. Vannesjo. ISOLDE RILIS: New beams, new
facilities. Nucl. Instrum. Meth. B, 266(19-20):4378–4382, 2008.
[19] W. Kaelber, J. Rink, K. Beck, W. Faubel, S. Goring, G. Meisel, H. Rebel, and R. C. Thompson.
Nuclear Radii of thorium isotopes from laser spectroscopy of strored ions. Z. Phys. A,
334(1):103–108, 1989.
[20] S. G. Johnson and B. L. Fearey. Spectroscopic study of thorium using continuous-wave resonance
ionization mass-spectrometry with ultraviolet ionization. Spectrochim. Acta B, 48(9):1065–1077,
1993.
[21] T. Billen, K. Schneider, T. Kirsten, A. Mangini, and A. Eisenhauer. Resonance ionization
spectroscopy of thorium. Appl.Phys. B, 57(2):109–112, 1993.
[22] C. Mattolat, S. Rothe, F. Schwellnus, T. Gottwald, S. Raeder, and K. Wendt. An all-solid-state
high repetiton rate titanium:sapphire laser system for resonance ionization laser ion sources.
AIP Conf. Proc., 1104:114–119, 2009.
[23] T. W. Hänsch. Repetitively pulsed tunable dye laser for high resolution spectroscopy. Appl. Opt.,
11(4):895–898, 1972.
[24] S. Köhler, R. Deißenberger, K. Eberhardt, N. Erdmann, G. Herrmann, G. Huber, J. V. Kratz,
M. Nunnemann, G. Passler, P. M. Rao, J. Riegel, N. Trautmann, and K. Wendt. Determination
of the first ionization potential of actinide elements by resonance ionization mass spectroscopy.
Spectrochim. Acta B, 52(6):717–726, 1997.
[25] R. L. Kurucz. Atomic spectral line database CD-ROM 23. 1995. available at http://www.pmp.uni-
hannover.de/cgi-bin/ssi/test/kurucz/sekur.html, accessed 15.04.2011.
[26] J. Blaise and J.-F. Wyart. Selected Constants, Energy Levels and Atomic Spectra Vol. 20. Tables
Internationales de Constantes, Universitè P. et M. Curie, Paris, 1992.
[27] E. A. Vernyi and V. N. Egorov. The isotope effect in the spectrum of thorium. Opt. Spectrosc.,
9:367–371, 1960.You can also read