Restricting the production of fossil fuels in Aotearoa New Zealand: March 2020 A note on the ban on new petroleum permits outside onshore Taranaki
←
→
Page content transcription
If your browser does not render page correctly, please read the page content below
Restricting the production of fossil
   fuels in Aotearoa New Zealand:
   A note on the ban on new petroleum permits
                      outside onshore Taranaki

                                 March 2020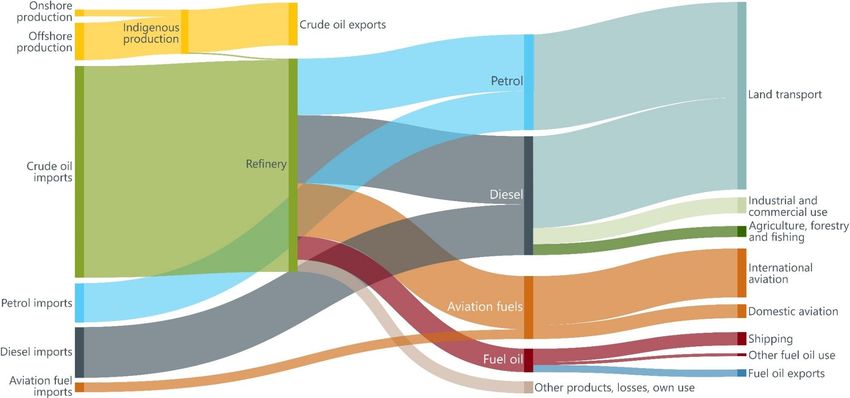
This note has been produced pursuant to subsections 16(1)(a) to (c) of the
Environment Act 1986. The Parliamentary Commissioner for the Environment is
an independent Officer of Parliament, with functions and powers set out in the
Environment Act 1986. His role allows an opportunity to provide Members of
Parliament with independent advice in their consideration of matters that may
have impacts on the environment.

This document may be copied provided that the source is acknowledged.
This note and other publications by the Parliamentary Commissioner for the
Environment are available at pce.parliament.nz.

Parliamentary Commissioner for the Environment
Te Kaitiaki Taiao a Te Whare Pāremata
PO Box 10-241, Wellington 6143
Aotearoa New Zealand
T 64 4 471 1669
F 64 4 495 8350
E pce@pce.parliament.nz
W pce.parliament.nz

March 2020
Acknowledgements
The Parliamentary Commissioner for the Environment is indebted to
Dr Ed Hearnshaw, Greg Briner and Megan Martin who assisted him in bringing
this note to completion. Any errors and omissions are entirely his own.

The Commissioner also wishes to thank the following individuals for their
expertise in reviewing an earlier draft of this note:
•   John Ballingal, Sense Partners
•   Gus Charteris, Giblin Group
•   Simon Coates, Concept Consulting
•   Dr Richard Denniss, The Australia Institute
•   Michael Lazarus, Stockholm Environment Institute
•   Dr Georgia Piggot, Stockholm Environment Institute
•   Professor Ralph Sims, Massey University
•   John Stephenson, Sense Partners.
Contents

1             Introduction ........................................................................................... 2     1

2             Different types of climate policies ................................................... 3

3             Economic impacts of the ban .......................................................... 17

4             Environmental effectiveness of the ban ....................................... 38

5             Conclusions .......................................................................................... 47

6             Annexes ................................................................................................. 50

References ............................................................................................................ 52
1          Introduction
    In 2018, the New Zealand Government decided not to grant any new
    petroleum prospecting, exploration and mining permits outside onshore
2
    Taranaki. The decision, which is effectively a ban, does not affect any existing
    permits or prevent the government from granting new permits for onshore
    Taranaki.1 It was described by the Government as “an important step
    to address climate change and create a clean, green and sustainable future for
    New Zealand.”2
    When the ban was announced, limited analysis was offered and the stakeholder
    consultation process was truncated. In particular, lack of consultation with iwi
    was seen as a flawed part of the process.3 The absence of a strong evidence-
    based case for the ban, coupled with suggestions that it may even increase
    global emissions, has done the ban few favours. The Opposition described it as
    “economic vandalism”4 and pledged it would repeal the ban should it win the
    next general election. The longevity of the ban is, therefore, far from
    guaranteed.
    The aim of this note is to extend the existing analysis by providing an
    assessment of what we know about the environmental effectiveness and likely
    economic impacts of the ban. It does not attempt to advocate for or against the
    ban. Its intention, rather, is to promote a better-informed debate about its
    relative merits given that there is cross-party support for the global temperature
    goals of the Paris Agreement and New Zealand’s 2050 target under the Climate
    Change Response Act.5
    While there is broad agreement on the climate outcomes that New Zealand is
    seeking, the policies used to achieve them still need to be subjected to careful
    scrutiny. If policies are to be durable, their contribution needs to be understood
    and their limitations admitted. That is my motivation for writing this note.

    1See Annex 1 for an explanation of the different types of petroleum permits required
    under the Crown Minerals Act (CMA) 1991. The ban does not affect the ability to seek
    changes to a permit under section 36 of the CMA or the ability to surrender an existing
    exploration permit in exchange for a mining permit.
    2 Beehive,   2018.
    3Although Te Āti Awa in Taranaki were not opposed to transitioning to a low-emissions
    economy, they stated that the Crown failed in its obligations to consult with them on the
    ban (Watson, 2018).
    4   Ambler, 2018.
    5 There was near unanimous support among parliamentarians for the Climate Change
    Response (Zero Carbon) Amendment Act 2019 (Zero Carbon Act), which amended
    New Zealand’s climate change laws to include the objective of contributing to “the global
    effort under the Paris Agreement to limit the global average temperature increase to
    1.5° Celsius above pre-industrial levels”.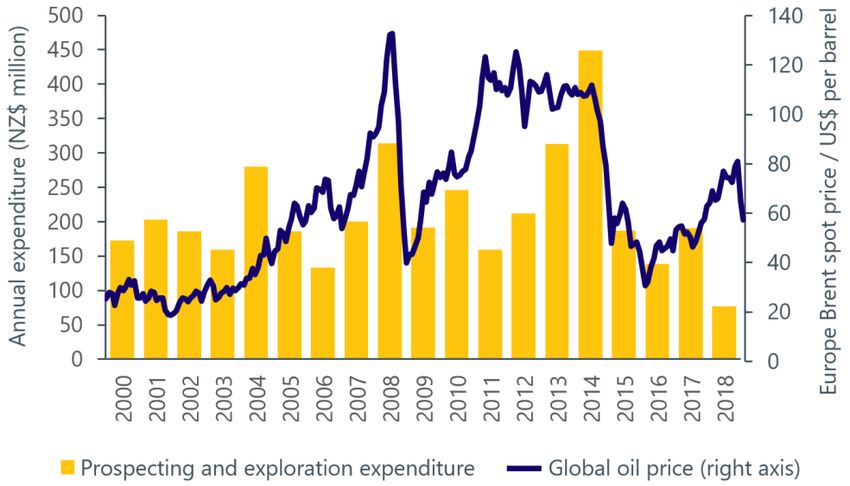
2          Different types of climate policies
According to mainstream textbook economics, there are two directions from
which environmental policies can bite: policies that target the supply side and
                                                                                                 3
policies that target the demand side. Supply-side policies aim to restrict the
supply or production of environmentally harmful substances. Demand-side
policies aim to reduce demand for those substances.
Supply-side policies have long been used to control substances that are harmful
to human health and the environment. Examples include restrictions on the
supply of asbestos, timber from clear-felled virgin native forests, certain ozone-
depleting substances and petroleum products containing lead. 6 Substances such
as these, or their production, have been deemed to be inherently harmful,
thereby justifying policies that have led to their complete removal from the
market.

Demand-side policies, by contrast, seek to influence consumer behaviour. They
are designed to moderate or discourage the consumption of goods or the use
of services that impose environmental costs. Examples include levies on waste
entering landfills to encourage resource efficiency and recycling, and congestion
pricing designed to discourage use of roads at busy times.

In the context of climate policy, supply-side climate policies embrace a range of
potential actions including regulatory approaches, such as bans on exploration
or extraction of fossil fuels, and price-based approaches, such as production
taxes on fossil fuels.7 Likewise, demand-side climate policies include regulatory
approaches, such as mandatory energy efficiency labelling programmes, and
price-based approaches, such as emissions pricing (e.g. emission taxes and
emissions trading schemes). Table 1 provides a few examples of regulatory and
price-based approaches for supply-side and demand-side climate policies.

Table 1: Examples of regulatory and price-based approaches for supply-side
and demand-side climate policies.

                    Supply-side climate policies         Demand-side climate policies

                                                         • Mandatory energy
    Regulatory      • Exploration ban
                                                           efficiency labelling
    approaches      • Production quotas
                                                           programmes

                    • Production taxes
                    • Export taxes on fossil             • Emissions trading schemes
    Price-based
                      fuels                              • Emissions taxes
    approaches
                    • Tradeable mining                   • Petrol excise taxes
                      permits

6   Green and Denniss, 2018.
7 A production tax on fossil fuels is different from a royalty. A royalty is a levy on the net
revenue produced from fossil fuels extracted. A production tax is a levy calculated on the
basis of the quantity of fossil fuels extracted.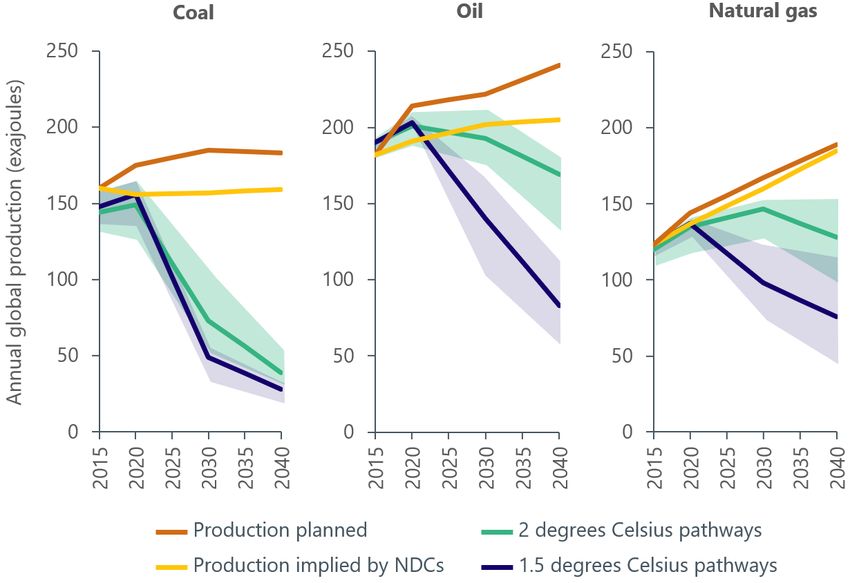
The attractions and limitations of emissions
    pricing
4   Economists typically promote price-based approaches to climate action because
    they are believed to achieve emissions reductions at lower cost than regulatory
    approaches. This is because businesses and consumers are incentivised to seek
    out the least costly ways of reducing emissions rather than, for instance, being
    directed to use particular technologies. Hence, price-based approaches allow
    different emitters greater flexibility in terms of how to achieve emissions
    reductions.

    They also generate revenues. These revenues can be recycled back into the
    economy through a reduction in other taxes and charges. For example, revenues
    from the carbon tax in British Columbia have been used to lower corporate
    taxes.

    Alternatively, the revenue can be used to directly support climate change
    mitigation efforts, such as supporting research and development into low-
    emissions technologies or assisting the transition of workers away from fossil
    fuel industries. These recycling mechanisms can increase the public acceptability
    of more stringent price-based climate policies.

    Regulatory approaches, while typically achieving emissions reductions at higher
    cost, may deliver lower administrative and adjustment costs compared to price-
    based approaches. This is because regulatory approaches are relatively easy to
    design and monitor. Hence, the choice between price-based and regulatory
    policies may depend on the level of ambition and coverage required. If the
    policy requires only incremental improvements in targeted sectors, then
    administrative costs may dominate and a regulatory approach could be
    preferable. However, if the level of ambition is relatively high because
    transformational improvements for the entire economy are sought, a price-
    based approach may be preferred.8
    Despite the existence of supply-side climate policies, economists have typically
    promoted price-based demand-side climate policies to address the problem of
    climate change. Theoretically, at least, given the global nature of the problem,
    many economists have argued that a global emissions price covering all
    emitting sectors would be the most efficient way to mitigate climate change.
    This was the long-term vision of the architects of the Kyoto Protocol signed in
    1997.

    A focus on pricing emissions makes sense. By making the release of emissions
    more expensive, emitters are encouraged to emit less.

    8   Joas and Flachsland, 2016.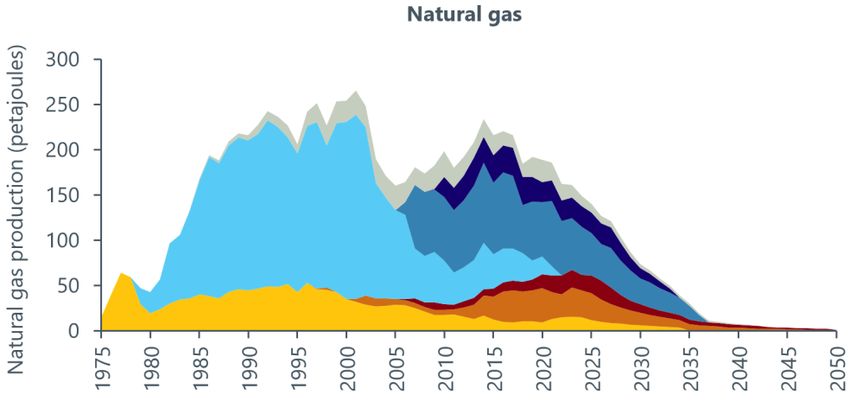
However, the Kyoto Protocol approach is no longer the favoured vehicle for
delivering international cooperation and the bottom-up architecture of the Paris
Agreement does not appear to have improved the prospects of achieving a
unified global emissions price. In fact, a supply-side climate policy, such as a
global production tax on fossil fuels could have a better chance of yielding a                5
global price-based approach. Such an approach could arguably be easier to
implement than a global emissions price because the number of countries
producing fossil fuels is far fewer than the number of countries consuming
them.9

Regardless of the theoretical potential of a global supply-side climate policy,
most effort to date has gone into establishing national- and regional-level
emissions pricing policies.10 But in practice, the level of ambition as seen in the
actual emissions price has been too slight to incentivise businesses and
consumers to meaningfully reduce their emissions. 11

All too often, political economy considerations have hampered emissions
pricing. As long as this persists, emissions pricing alone, while an indispensable
tool, will be insufficient to reduce emissions or the use of fossil fuels. Emissions
pricing needs to be flanked with complementary climate policies. 12

That is, in part, because complementary climate policies can achieve emissions
reductions in ways that often are more politically expedient than raising the
emissions price. Indeed, one study found that complementary polices can halve
the explicit emissions price needed to achieve deep decarbonisation. 13

Furthermore, not all market failures can be fixed by emissions pricing alone. For
example, businesses still tend to underinvest in research and development of
low-emissions technologies.

9A global production tax on fossil fuels would also conceivably have lower administrative
costs than global emissions pricing, as there would be no need for each emitter and
country to keep track of the emissions released (Yale Center for the Study of
Globalization, 2015; Green and Denniss, 2018). This has led to calls for a fossil fuel non-
proliferation treaty to deal with emissions at source (Newell and Simms, 2019).
10 Over 40 governments, including New Zealand, have adopted some sort of emissions
pricing policy (World Bank, 2019).
11For example, an emissions price of NZ$25 per tonne of carbon dioxide would only
increase the price of petrol by about 6 cents per litre.
12   Kennedy, 2019.
13   Bataille et al., 2015.
The Paris Agreement and the global carbon
    budget
6   In the 2015 Paris Agreement, governments agreed to hold the increase in the
    global average temperature to well below two degrees Celsius above pre-
    industrial levels and pursue efforts to limit the temperature increase to 1.5
    degrees Celsius.14

    As of January 2018, the remaining global carbon budget for a two-thirds chance
    of holding warming to 1.5 degrees Celsius was around 420 gigatonnes of
    carbon dioxide. For two degrees Celsius it was 1,170 gigatonnes of carbon
    dioxide.15 If global carbon dioxide emissions were to continue at their current
    rate, these budgets would be exhausted within around 13 years and 35 years
    respectively.16
    Carbon capture, use and storage (CCUS) technologies can lower the carbon
    dioxide emissions released from fossil fuel combustion at power plants and
    industrial facilities by preventing the release of carbon into the atmosphere. If
    CCUS were to become economically viable and deployed at scale, it is possible
    that fossil fuels could continue to be used a little longer without exceeding the
    global carbon budget.17

    However, global development of CCUS remains well off-track to reach the levels
    required to meet the global temperature goals of the Paris Agreement. 18 The
    New Zealand Government currently has no policies in place to support CCUS. 19
    In the absence of CCUS, the only way continued combustion of fossil fuels could
    possibly be compatible with the 1.5 degrees Celsius global temperature goal
    that underpins New Zealand’s 2050 target20 would be to combine it with high
    and sustained levels of forest planting. But relying heavily on carbon

    14   UN, 2015.
    15   IPCC, 2018.
    16Global carbon dioxide emissions from fossil fuel combustion were around 33 GtCO 2 in
    2018 and 2019 (IEA, 2020).
    17 It is also possible that carbon dioxide could be removed directly from the air using
    carbon dioxide removal (CDR) technologies. However, CDR technologies (other than
    planting trees) are even more speculative than CCUS and the Intergovernmental Panel on
    Climate Change (IPCC) has cautioned that “CDR deployed at scale is unproven, and
    reliance on such technology is a major risk in the ability to limit warming to 1.5°C” (IPCC,
    2018, p.96).
    18   IEA, 2019a.
    19Plans for a combined power, hydrogen, ammonia and nitrogen-fertiliser plant in
    New Zealand that uses CCUS technology have been proposed by Pouakai NZ, a related
    company of 8 Rivers. The project will be privately funded.
    20The Zero Carbon Act sets a target to reduce New Zealand’s net emissions of carbon
    dioxide and other greenhouse gases other than biogenic methane to zero by 2050.
sequestration by forests to offset New Zealand’s carbon dioxide emissions to
2050 and beyond is a risky strategy.21
If the world takes sufficient action to meet the global temperature goals of the
Paris Agreement, a large proportion of the world’s existing coal, oil and natural
7
gas reserves could be rendered “unburnable” (Figure 1).22 It is therefore perhaps
somewhat surprising that the Paris Agreement does not contain a single
reference to “fossil fuels”.
Source: Based on IPCC (2018) and BP (2019)
Figure 1: A comparison of the global carbon budget and global carbon
dioxide emissions if proven fossil fuel reserves were burnt without CCUS. 23
21I have drawn detailed attention to the nature of these risks in the Farms, forests and
fossil fuels report I published last year (PCE, 2019).
22The IPCC has cautioned that “innovations that disrupt entire systems may leave firms
and utilities with stranded assets, as the transition can happen very quickly. This may
have consequences for fossil fuels that are rendered ‘unburnable’ and fossil fuel-fired
power and industry assets that would become obsolete” (IPCC, 2018, chapter 4, p.323).
23 For global fossil fuel reserves, the carbon dioxide that would be emitted if all proven
reserves of coal, oil and natural gas were combusted without CCUS is shown. Brown coal
refers to lignite and sub-bituminous coals. Hard coal refers to anthracite and bituminous
coals. Brown coals generally emit more carbon dioxide emissions per tonne than hard
coals when burnt. Proven reserves exclude probable and possible reserves in existing
fields, contingent resources that are technically recoverable but not currently commercial
recoverable, and yet-to-be-discovered fossil fuel deposits. Inclusion of these additional
reserves and resources would lead to much higher potential carbon dioxide emissions
from fossil fuel combustion.Modelling indicates that, in the absence of CCUS, 35 per cent of global oil
reserves, 52 per cent of global natural gas reserves and 88 per cent of global
coal reserves cannot be extracted and combusted if the rise in global average
temperature is to be limited to two degrees Celsius. Even in a scenario assuming
8 widespread deployment of CCUS from 2025 onwards, these shares decrease
only slightly to 33 per cent of global oil reserves, 49 per cent of global natural
gas reserves and 82 per cent of global coal reserves. 24
Further investment in fossil fuel exploration therefore only makes sense if
investors are confident that governments will take insufficient action to meet
the global temperature goals of the Paris Agreement. If governments do take
sufficient action, any further investment in exploration risks creating stranded
assets that at some point prior to the end of their economic life are no longer
able to earn an economic return.25 It could also create stranded jobs and
communities unless support is provided for economic diversification and a well-
prepared transition to alternative sources of employment.
By implementing weak emissions pricing and other demand-side climate
policies, policymakers have failed to send a strong signal to investors and fossil
fuel producers about the risks of business as usual. If fossil fuel producers are
confident that the cost of future emissions will be not be much higher than it is
today, they can make a financial case for continued investment in exploration
and extraction.
Given the risk of their assets becoming worthless if emissions prices rise
significantly, fossil fuel producers are also incentivised to lobby to keep
emissions prices low. Furthermore, new investment once made will reinforce the
case for delaying more ambitious climate policies. Politicians face a choice
between stranding major fossil fuel investments and the jobs associated with
them, and stranding their climate ambitions.
24 McGlade and Ekins, 2015.
25 Carbon Tracker Initiative, 2017.In this way, ongoing investment in fossil fuels can perpetuate dependency on them through technological and economic lock-in.26 At least in democracies, there is a mismatch between the relatively short-term horizon of electoral cycles and the long-lived nature of many capital investments in fossil fuel infrastructure. If the projected future price of emissions is highly uncertain 9 beyond the political short term, policies aimed directly at the production of fossil fuels may provide an alternative way to overcome fossil fuel dependency. This may explain the recent renewal of interest in supply-side climate policies. Supply-side climate policies may also be able to mitigate the impact of a so- called ‘green paradox’.27 This paradox arises if fossil fuel producers expect emissions prices to rise in the long term, which may perversely incentivise them to increase fossil fuel production in the short term. This is because fossil fuel producers may choose to increase extraction while the ‘going is good’, thereby increasing emissions in the short term. At the same time, it is also likely that fossil fuel producers would seek to expand alternative markets for their products that do not involve direct combustion for transport, heat and power. There is already some evidence of such diversification of demand occurring. For example, demand for oil to make plastics, fertilisers, clothing, detergents and other petrochemical products is rapidly increasing and is expected to account for more of the growth in global oil demand to 2050 than trucks, aviation and shipping. 28 Given these incentives and political economy considerations, it is perhaps not surprising that fossil fuel production is still expanding globally. While global capital expenditure on oil and natural gas extraction projects contracted in 2015 and 2016, it is once again increasing and is forecast to total US$1.4 trillion between 2020 and 2024.29 These new projects increase the probability of a ‘carbon bubble’ growing within global financial markets.30 26Technologies and the systems that evolve to support them tend to perpetuate themselves. A combination of linked technical, economic, and institutional factors can favour the persistence of a particular technology or cluster of technologies in a way that locks out alternatives. This technological path dependency in respect of fossil fuel energy systems is termed ‘carbon lock-in’. In many cases future fossil fuel production would still be expected to take place even if the market price of the products is lower than the long- run marginal costs of production. This is because rational producers will ignore ‘sunk costs’ and continue to produce as long as the market price is sufficient to cover the marginal cost of production (Erickson et al., 2015). 27 Sinn, 2008; Green and Denniss, 2018. 28 IEA, 2018. 29Global Gas and Oil Network, 2019. This includes capital expenditure by both state- owned and privately owned companies. 30 Carbon Tracker Initiative, 2011.
At a global level, increased fossil fuel production will limit the ability of countries
     to collectively meet global temperature goals. The Production Gap Report 2019
     estimates that fossil fuel producers are planning to extract about 50 per cent
     more fossil fuels by 2030 than would be consistent with a two-degree Celsius
10   pathway, and 120 per cent more than would be consistent with a 1.5-degree
     Celsius pathway.31 The global production gap is largest for coal (see Figure 2).

                                                                     Source: UNEP et al. (2019)

     Figure 2: The production gap between global fossil fuel production plans and
     least-cost global pathways to 1.5°C and 2°C. 32

     Given that only a fraction of existing reserves can be burnt if the global
     temperature goals of the Paris Agreement are to be met, it has been argued
     that developed countries should curtail their fossil fuel production first. This
     would allow developing countries that have fossil fuel reserves to extract rents
     from them for a little longer to help accelerate their development. 33

     31UNEP et al., 2019a. Note this study excluded global scenarios that rely heavily on CDR
     technologies.
     32The 1.5°C-compatible and 2°C-compatible pathways include CCUS but scenarios with
     very high levels of reliance on carbon dioxide removal technologies were excluded. NDCs
     are nationally determined contributions under the Paris Agreement.
     33 Caney, 2016. Another possibility is that developed countries could compensate
     developing countries for leaving their fossil fuel reserves in the ground (Harstad, 2012).
     This would be similar in principle to existing payments for not cutting down rainforest
     under the United Nations’ Reducing Emissions from Deforestation and Forest
     Degradation (REDD+) programme. In 2007 the Government of Ecuador invited the
     international community to pay Ecuador US$3.6 billion to not develop almost one billion
     barrels of crude oil in the Ishpingo-Tambococha-Tiputini oilfields. However, the project
However, such an approach may risk locking-in emissions-intensive infrastructure in developing countries and make future decarbonisation more expensive.34 Furthermore, renewable energy technologies are already the least- cost sources of new power generation in many regions, especially if the external costs of different energy sources are accounted for.35 11 Overall, if widely adopted, supply-side climate policies could help close the production gap and avoid global over-investment in fossil fuel production, thereby supporting efforts to meet the global temperature goals of the Paris Agreement. If well designed, supply-side climate policies could also minimise the risks of the green paradox occurring by restricting exploration and extraction of fossil fuels in the short term.36 Meeting the global temperature goals of the Paris Agreement will require well- aligned climate policies that work effectively together. If both supply-side and demand-side climate policies are used, they should be mutually reinforcing, enabling policymakers to “cut with both arms of the scissors.”37 Using both together can increase the coverage and ambition of climate policies. 38 Emissions reporting and accounting All countries currently report and account for their emissions on a territorial basis. That is, only emissions that occur within a country’s borders are considered. Emissions that occur due to exported fossil fuels or imported emissions-intensive goods and services are attributed to the country burning the fuels or producing the goods. Territorial accounting enables countries that shut down emissions-intensive industries to ‘outsource’ their emissions by importing finished products manufactured elsewhere. Arguably, countries that are net importers of emissions-intensive goods and services should bear part of the responsibility for emissions occurring overseas as a result of their imports.39 This line of thinking led to the development of consumption-based accounting, which considers the global emissions footprint of a household, city or indeed an entire country. 40 For example, the only succeeded in raising US$13 million and was shelved in 2013 (Sovacool and Scarpaci, 2016). 34 UNU-INRA, 2019; Bradley et al., 2018. 35 IRENA, 2019. 36 Green and Denniss, 2018; Roberts, 2018. 37 Green and Denniss, 2018. 38 Lazarus and van Asselt, 2018. 39 Moss, 2019. 40 Peters, 2008.
United Kingdom has published estimates of its consumption-based emissions
     that account for the embodied emissions in traded goods and services. 41

     The idea of taking responsibility for global emissions footprints is not by any
     means new. Some businesses, responding to consumer concern about climate
12
     change, have adopted an approach based on producer responsibility that
     accounts not just for their direct emissions but also some of those incurred by
     their suppliers and customers. Ikea, for instance, has estimated and taken
     responsibility for the global emissions footprint of its entire value chain,
     including third-party suppliers, customer travel to its stores and the use of its
     products.42

     By only accounting for emissions produced within their borders, fossil fuel
     exporting countries can profess to be pursuing ambitious domestic climate
     policies secure in the knowledge that the emissions associated with burning
     their exported fossil fuels will be the responsibility of importing countries.
     Arguments have been advanced that fossil fuel exporting countries should
     accept, at least, partial responsibility for the emissions associated with their
     fossil fuel exports.43
     Applying the logic of producer responsibility, already accepted by some
     businesses,44 to fossil fuel producers leads to extraction-based reporting and
     accounting.45 Extraction-based accounting attributes the emissions from fossil
     fuel combustion to the producer of the fossil fuels, and hence results in higher
     emissions totals for large net exporters of fossil fuels.

     For example, Norway’s emissions of carbon dioxide in 2017 as reported in
     its national inventory were around 44 million tonnes (equivalent to around
     seven tonnes of carbon dioxide per person). But using extraction-based
     accounting, its carbon dioxide emissions were around 470 million tonnes
     (around 88 tonnes of carbon dioxide per person). 46

     41
       The United Kingdom’s carbon dioxide emissions in 2016 were around 400 MtCO 2 on a
     territorial basis (Brown et al., 2018) and around 600 MtCO2 when calculated on a
     consumption basis (Defra, 2019).
     42   Ikea, 2019.
     43   Moss, 2019.
     44This includes some businesses in the fossil fuel sector. For example, BP has a target to
     reduce net emissions from its operations and production activities to zero and half the
     carbon intensity of its products by 2050 (BP, 2020).
     45   Davis et al., 2011.
     46Territorial emissions from Norwegian Environment Agency (2019). Extraction-based
     emissions from UNEP et al. (2019b).
Australia, which is currently the world’s largest exporter of coal and liquefied natural gas, accounted for 1.2 per cent of global carbon dioxide emissions on a territorial basis, but 3.8 per cent on an extraction basis in 2017.47 Despite its large extraction-based emissions, Australia has assumed no responsibility for emissions overseas due to its fossil fuel exports. 13 The rationale for not doing so with respect to Australia’s coal exports was explained by one former Australian Environment Minister in these terms: “I hope you would agree the poorest countries should be able to decide their own energy future. I am not a neo-colonialist. I think the poorest should be able to make their own decisions.”48 In contrast, the Suva Declaration on Climate Change adopted by the Pacific Islands Development Forum in 2015 expresses “grave concern that the continued increase in the production of fossil fuels, particularly the construction of new coal mines, undermines efforts to reduce global greenhouse gas emissions and the goal of decarbonising the global economy”. 49 Like Norway, New Zealand’s territorial carbon dioxide emissions per capita in 2017 were around seven tonnes of carbon dioxide per person. But unlike Norway, New Zealand is a significant net importer of oil and petroleum products. As a result, its carbon dioxide emissions were four tonnes of carbon dioxide per person in 2017, if extraction-based accounting is used (Figure 3).50 47 Calculated using territorial emissions from IEA (2019c). Extraction-based emissions from UNEP et al. (2019b). 48 Taylor, 2015. 49 Pacific Islands Development Forum, 2015, p.6. The Suva Declaration on Climate Change also calls for “a new global dialogue on the implementation of an international moratorium on the development and expansion of fossil fuel extracting industries” (p.8). 50Territorial emissions from MfE (2019). Extraction-based emissions from UNEP et al. (2019b).
14

                Source: Based on IEA (2019b), OECD (2019), UNEP et al. (2019b) and UN (2019)

     Figure 3: Territorial-based, consumption-based and extraction-based carbon
     dioxide emissions per capita in selected OECD countries. 51

     The Paris Agreement provides limited guidance regarding the content of
     nationally determined contributions and how they are to be accounted for. 52
     The emissions reduction targets put forward so far by developed countries in
     their nationally determined contributions have focused on reducing territorial
     emissions and followed the international norm of using territorial emissions
     accounting. Targets that only address territorial emissions do not explicitly
     incentivise countries to adopt policies to reduce production of fossil fuels for
     export.

     Furthermore, asymmetries in climate policy stringency are likely to persist under
     the Paris Agreement for some time. So long as these asymmetries remain and
     nationally determined contributions are framed in terms of territorial
     emissions,53 there will be a risk of emissions leakage54 and a risk that fossil fuel
     producers in countries with tightening demand-side climate policies increasingly
     export their fossil fuels to countries with weaker climate policies.

     51Territorial-based and extraction-based emissions are for the year 2017; consumption-
     based emissions are for the year 2015.
     52The Paris Agreement stipulates that in accounting for their nationally determined
     contributions, countries shall “promote environmental integrity, transparency, accuracy,
     completeness, comparability and consistency, and ensure the avoidance of double
     counting” (UN, 2015, p.5).
     53There is the potential for nationally determined contributions to include targets to limit
     fossil fuel supply alongside enhanced targets to reduce emissions, and to specify the
     policies that will be used to do so (Verkuijl et al., 2018).
     54Emissions leakage occurs when businesses in one country are required to pay more for
     their emissions than their overseas competitors, and the cost difference is enough to
     result in their production moving offshore.
Simply reporting extraction-based emissions (and, for that matter,
consumption-based emissions) alongside territorial emissions would not
eliminate these risks, but it would improve transparency and highlight the
intuitive contradiction that ambitious climate policies at home can go hand in
hand with increasing production of fossil fuels for export. Importantly, the 15
adoption of extraction-based emissions reporting (or even targets for
extraction-based emissions, in addition to targets for territorial emissions)
would help incentivise the adoption of supply-side climate policies.
Supply-side climate policies in New Zealand
The ban is not the only supply-side climate policy promoted by the New Zealand
Government. It has, for example, been a long-term advocate of the progressive
elimination of subsidies for fossil fuels, including subsidies for fossil fuel
production.
The worldwide removal of these supply-side subsidies is essential if clear signals
are to be given about the transition to an energy system freed from reliance on
fossil fuels. In 2015 these subsidies for fossil fuel production have been
estimated globally to total a staggering US$444 billion.55
New Zealand is not the only country to take a renewed interest in supply-side
climate policies. For example:56
• Denmark has banned all exploration and drilling for oil, gas and shale gas
on land and in inland waters.
• Canada has placed a moratorium on offshore oil and natural gas activities in
Canada’s Arctic waters.
• France has decided not to renew exploration permits for conventional and
unconventional fossil fuels and to phase out all oil and natural gas
production by 2040.
• Costa Rica has banned offshore and onshore exploration and extraction of
fossil fuels.
• Belize has placed a moratorium on offshore oil exploration and drilling.
• Spain has committed to phasing out coal production.
• Germany has phased out subsidies for the production of hard coal.
However, while there is renewed political and academic interest in supply-side
climate policies coupled with reasons to justify their introduction, this does not
mean that the ban itself necessarily has merit as a climate policy. An analysis of
the ban requires an assessment of both its likely economic impacts and
environmental effectiveness, and how it interacts with the New Zealand
Emissions Trading Scheme (NZ ETS).
55 Bast et al., 2015.
56 UNEP et al., 2019a.While New Zealand accounts for tiny fractions of global fossil fuel production
and emissions, its emissions per capita are high. The global nature of the climate
change problem demands that any assessment of the effectiveness of climate
policies is placed in a global context – in particular, whether or not other
16 countries make sufficient efforts to meet the Paris Agreement.
As to the likely economic impacts of the ban, the principal concern will be
for the distributional consequences both nationally and regionally inside
New Zealand. But some of the distributional consequences of domestic policies
could also have implications for New Zealand’s negotiating position on climate
change. The remainder of this note attempts to survey these issues.
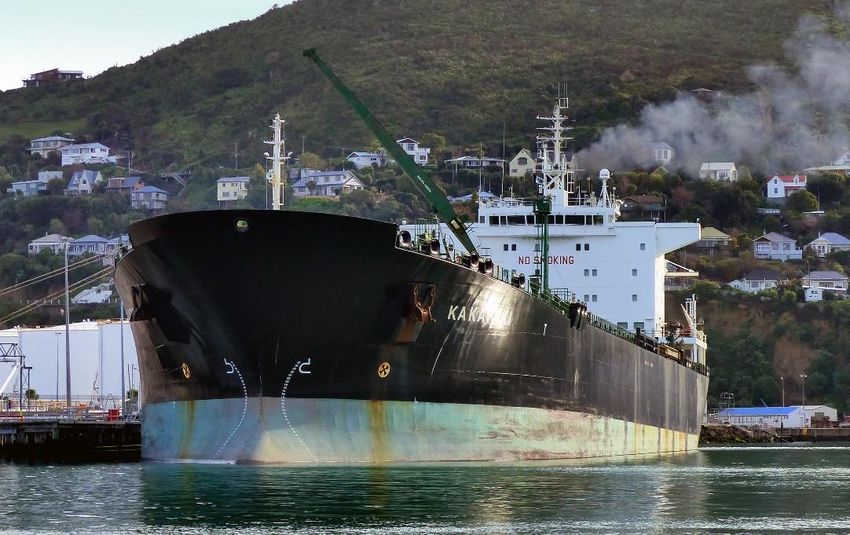
Source: Bernard Spragg, Flickr
Figure 4: The Kakariki crude oil tanker was built in 1999 and sailed under the
New Zealand flag until it was replaced in 2017. The tanker delivered more
than 142 million barrels of oil to New Zealand ports.3 Economic impacts of the ban
To examine the economic impacts of the ban, it is necessary to understand the
extent and characteristics of New Zealand’s fossil fuel production. In 2018,
17
New Zealand produced 172 petajoules (163 billion cubic feet) of natural gas,
60 petajoules (11 million barrels) of oil and 83 petajoules (3.2 million tonnes) of
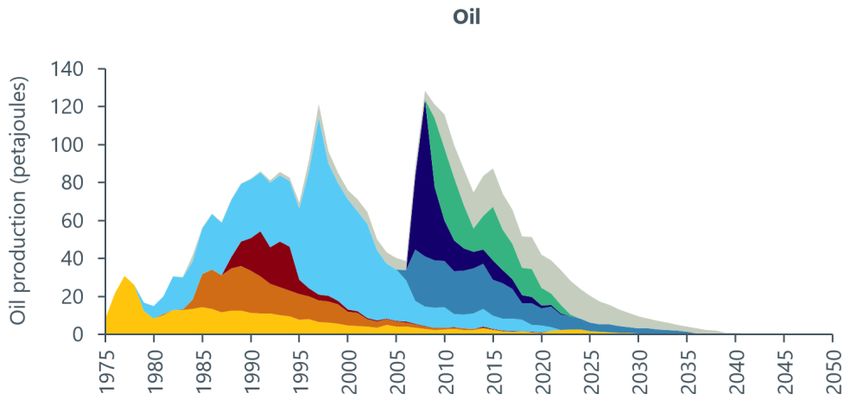
coal.57 In the absence of new discoveries, oil and natural gas production is
expected to significantly decline over the next two decades (see Figure 5).
Globally, New Zealand’s production of oil and natural gas is tiny. Its share of
world oil production has fluctuated between 0.02 per cent and 0.08 per cent
since the 1990s.
Despite these relatively small production levels, the New Zealand Government
has in recent years collected on average around NZ$650 million per year in
royalties and taxes from oil and natural gas producers. 58 These businesses have
been estimated to contribute over NZ$2.5 billion to New Zealand’s annual gross
domestic product (GDP),59 and directly and indirectly employ many thousands
of people across New Zealand. Most of this employment is concentrated in
Taranaki.
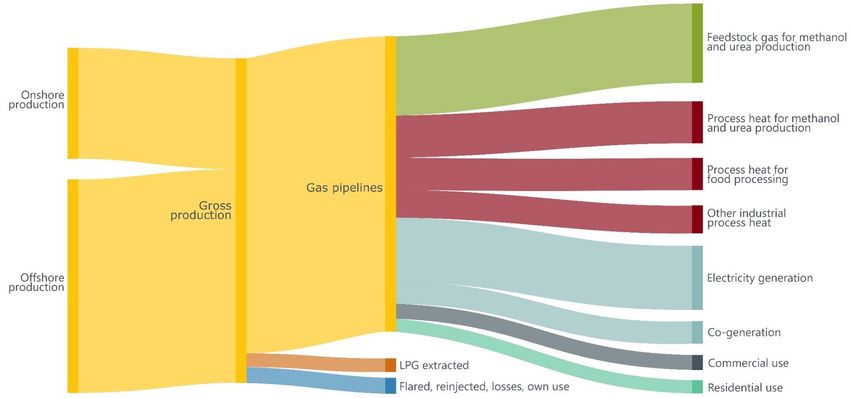
Figures 6 and 7 illustrate the flows between supply of and demand for natural
gas and oil in New Zealand respectively, including imports and exports. All the
natural gas produced in New Zealand is currently consumed domestically. On
the other hand, New Zealand imports nearly all the oil it consumes. Almost all of
the crude oil produced in New Zealand is exported, primarily to refineries in
Australia and Singapore. New Zealand does not currently produce or import any
liquefied natural gas.
57MBIE, 2019a. Note that 1 PJ of primary energy is contained in approximately 25 million
cubic metres of natural gas at atmospheric pressure, 180,000 barrels of oil, and 40,000
tonnes of sub-bituminous (hard) coal.
58NZ$653 million is calculated as a historical average between 2009 and 2017 (MBIE,
2018a). The royalty regime in New Zealand requires that any business producing and
selling oil and natural gas in New Zealand is required to pay a royalty to the Government.
This royalty is calculated as either 5% of net sales revenue or 20% of accounting profit,
whichever is higher.
59 PEPANZ, 2019; Venture Taranaki, 2015.18
Source: Based on MBIE (2019b, 2019c and 2019d)
Figure 5: New Zealand’s oil and natural gas production. 60
60Projections are in the absence of new discoveries or additional investment in the
development of contingent resources in existing fields. ‘Other fields’ include both
offshore and onshore fields.19
Source: Based on MBIE (2019d)
Figure 6: Flows of natural gas in New Zealand.1
1The width of each flow is roughly proportional to its magnitude in 2018. Stock changes and other small flows (such as use of natural gas for transport and
production losses, and own use in the electricity sector) are not shown.20 0
Source: Based on MBIE (2019b)
Figure 7: Flows of oil in New Zealand62
62The width of each flow is roughly proportional to its magnitude in 2018. Stock changes and other small flows (such as industrial use of fuel oil, use of diesel
by the residential and electricity generation sectors, and flows of liquified petroleum gas, bitumen, lubricants, solvents, waxes, petroleum coke, white spirit
and other liquid fuels) are not shown.New Zealand’s remaining reserves of natural gas are estimated to be around
2,000 petajoules, as of January 2019.63 If current rates of extraction continue and
no major new gas fields are discovered through current exploration efforts, this
is equivalent to around 12 years’ supply.
21
In reality, however, fossil fuel reserves are a function of economics. The extent to
which the extraction of these dwindling reserves remains commercially viable
depends largely on what happens to future demand for natural gas. The
available gas for recovery may be more than double the 2,000 petajoules
reserve estimate once additional resources from existing fields not yet
economically viable to extract are also considered (Figure 8). 64
Source: Based on MBIE (2019c)
Figure 8: New Zealand’s oil and natural gas reserves as of 1 January 2019.
63
These estimates refer to proven reserves and probable reserves. These reserves have a
50% probability of being produced.
64 Contingent resources reflect fossil fuel resources from existing fields that could be
recovered with current technology, but which are not economically viable at the current
time. Published data indicates the amount of contingent resources from existing fields (at
a 50% confidence level) is almost the same magnitude as the quantity from proven
reserves. However, while there is high confidence that proven reserves will be extracted,
it is likely that a smaller proportion of contingent resources will be developed. Funnell et
al. (2015) indicated a 50% probability of undiscovered gas in the Taranaki basin of
approximately 6,000 PJ. This volume of gas is equivalent to 30 years’ worth of current
demand. However, Funnell et al. (2015) highlighted it was extremely unlikely all this gas
would be discovered, let alone developed.While the ban has been framed by the Government as a climate policy, its most
immediate impact is economic. Potentially, some immediate economic impact
from the ban may already have occurred. For example, the ban may have meant
that financial resources expended by geophysical service companies for
22 prospecting (e.g. undertaking seismic surveys and seafloor sampling) under
existing permits prior to exploration have been written off.
But a far greater impact of the ban is likely to be foregone fiscal revenues to the
Crown and future contributions to GDP that might have been expected from the
oil and natural gas industries. This section focuses on clarifying these economic
impacts.
Fiscal costs
In its regulatory impact assessment (RIA), the Ministry of Business, Innovation
and Employment (MBIE) used its oil and gas model to estimate the fiscal costs
or lost revenues from foregone Crown royalties and taxes as a result of the ban.
The oil and natural gas modelling consisted of two sub-models: a simulation
sub-model and a financial sub-model. The simulation sub-model estimated a
range of variables, including the probabilities of exploratory success and the
likelihood of finding oil versus natural gas. The financial sub-model accounted
for the costs involved in oil and natural gas exploration in each basin, including
operating costs, development costs and appraisal costs.
The modelling analysed three scenarios:
• a low scenario reflecting a low oil price, low exploratory success and a high
emissions price
• a middle scenario reflecting a medium oil price, medium exploratory
success and a medium emissions price
• a high scenario reflecting a high oil price, high exploratory success and a
low emissions price.65
These scenarios are analogous to scenarios developed by the International
Energy Agency (IEA). The modelling results indicated that oil and natural gas
supply with the ban averages 87 petajoules from 2027 to 2050. This level of
production is less than half current levels.
65The low scenario, referred to by the IEA (2019c) as the Sustainable Development
Scenario, reflects an oil price of US$64 per barrel of crude oil in 2040 and a global
emissions price of US$140/tCO2-e. The middle scenario, referred to by the IEA as the
Stated Policies Scenario, reflects an oil price of US$111 per barrel of crude oil in 2040 and
a global emissions price of US$48/tCO2-e. The high scenario, referred to by the IEA as the
Current Policies Scenario, reflects an oil price of US$136 per barrel of crude oil in 2040
and a global emissions price of US$40/tCO2-e.As a result of the ban, this projected level of production results in fiscal costs to
2050 of between NZ$2.7 billion and NZ$14.4 billion for a three per cent
discount rate, and between NZ$0.5 billion and NZ$3.1 billion for a ten per cent
discount rate (Figure 9).66 The middle scenario estimates are NZ$7.9 billion and
NZ$1.8 billion in foregone revenue for a three per cent and ten per cent 23
discount rate, respectively.
It is important to stress that these figures are cumulative fiscal costs out to 2050.
Annual average revenue foregone for the middle scenario under a three per
cent discount rate is less than NZ$350 million between 2027 and 2050.
Source: Based on MBIE (2018a)
Figure 9: Fiscal impacts of the ban on future Crown revenue to 2050.
MBIE notes in its RIA that the modelled estimates were highly uncertain given
that “the business of quantifying undiscovered petroleum resources is fraught
with difficulty and there are numerous possibilities for error”.67 Accepting the
inevitable uncertainty surrounding the estimates, there are at least five reasons
why the modelled fiscal costs in the RIA are likely to be overestimates.
66P50 estimates were used for these fiscal costs. P50 estimates are defined as 50% of
estimates exceed the P50 estimate (and by definition, 50% of estimates are less than the
P50 estimate).
67 Funnell et al., 2015, p.19.First, there is the choice of discount rate. 68 While MBIE analysed both a three per
cent and a ten per cent discount rate, MBIE largely reported fiscal costs using
the three per cent discount rate. A three per cent discount rate was argued to
be appropriate because it was previously used to assess oil and natural gas field
24 development plans in 2013.69 However, the Treasury recommends a six per cent
discount rate as the default rate for both general policy analysis and energy-
specific policy analysis.70
Low discount rates inflate the net present value of future costs, especially costs
occurring in the medium to long term. If a six per cent discount rate had been
used, the estimated fiscal costs would be somewhere between the fiscal costs
for a three per cent and ten per cent discount rate.
Second, at least one and possibly two of the three scenarios modelled were not
particularly realistic. The high scenario reflected a world in which New Zealand
and other countries take no further action at all on climate change. This is
clearly unlikely. However, the IEA’s high scenario was never intended to be a
plausible future. Rather, it was designed as a baseline against which plausible
future scenarios could be assessed.
The middle scenario is more plausible. 71 The IEA designed it to account for
existing policies and, importantly, new climate policy initiatives that
governments have announced. This scenario includes the impact on global
energy markets of nationally determined contributions under the Paris
Agreement. However, it still reflects a world not on track to meet the global
temperature goals in the Paris Agreement.72
The middle scenario does not reflect New Zealand’s own stated level of climate
policy ambition, which is to contribute to the global effort under the Paris
Agreement to limit the global average temperature increase to 1.5 degrees
Celsius above the pre-industrial level. For example, to meet New Zealand’s 2050
target, it has been estimated that the domestic NZ ETS price needs to rise to at
least NZ$140 per tonne of carbon dioxide equivalent by 2050.
68 The discount rate reflects the Crown’s social rate of time preference.
69 MBIE, 2018a.
70 Treasury, 2020.
71The IEA (2019c) designed the Stated Policies Scenario (referred to in the RIA as the
middle scenario) to account for existing policies, and importantly, new policy initiatives
that governments have announced. Hence, this scenario, for example, includes the
impact on global energy markets from nationally determined contributions under the
Paris Agreement.
72The middle scenario reflects a world not on track to meet the Paris Agreement with
global temperatures held only to between 2.7°C and 3°C of warming (Mission 2020,
2019).At this NZ ETS price there would be a significant impact on New Zealand’s
natural gas consumption, irrespective of the ban. In the middle scenario, the
emissions price reaches only US$48 per tonne (i.e. NZ$72) of carbon dioxide
equivalent by 2040.73
25
The use of expected average global emissions prices in the RIA is justifiable for
oil production because most of the oil produced in New Zealand is exported.
But it is less appropriate for natural gas because nearly all of the natural gas
produced in New Zealand is used domestically and is covered by the NZ ETS. As
for coal, approximately 60 per cent of the coal produced in New Zealand is
consumed domestically and therefore covered by the NZ ETS.
The decision not to account appropriately for New Zealand’s stated level of
climate policy ambition is somewhat surprising. Even though the Climate
Change Response (Zero Carbon) Amendment Act 2019 had not yet been passed
at the time of the ban’s introduction, it was a leading government policy
initiative. The RIA should have at least broadly taken it into account. The RIA
was, after all, signed off by MBIE at the end of August 2018. By that time various
modelling efforts were publicly available as to possible NZ ETS price pathways
needed to reach the 2050 target and other proposed targets.74
One of these modelling efforts was the work commissioned by the Productivity
Commission. In that modelling, the fossil fuel and chemical production
industries contracted (in the absence of a ban) by at least 28 per cent by 2050 in
pathways compatible with meeting the 2050 target as a result of a rising NZ ETS
price.75 The fiscal costs of the ban as reported in the RIA are likely to be inflated
since they ignored the impact of a rising NZ ETS price to reach the 2050 target,
and instead assumed no contraction of the natural gas industry.
By contrast, the impact of the NZ ETS on the oil extraction industry is limited
because almost all of the oil New Zealand produces is exported. Similarly,
Methanex, New Zealand’s largest consumer of natural gas, currently receives
freely allocated NZ ETS units because it is categorised as an emissions-intensive
and trade-exposed (EITE) industry. This means Methanex only faces a small
percentage of the full NZ ETS price for its domestic emissions. 76
The New Zealand emissions price calculated uses an exchange rate of US$0.66 for
73
NZ$1, which reflects the middle exchange rate applied in the RIA.
74 MfE, 2019a.
75 Productivity Commission, 2018.
76 Methanol production currently receives a free allocation of units that equates to a level
of assistance of 90% multiplied by its allocative baseline (currently 0.7854) multiplied by
the annual quantity of methanol it produces that is of saleable quality. The allocative
baseline for methanol production is intended to reflect the ‘industry average’ emissions
intensity (i.e. tonnes of carbon dioxide emitted per tonne of methanol produced). If the
allocative baseline reflects the actual emissions intensity of Methanex’s methanol
production, then the free allocation reduces the effective NZ ETS price it pays for its
domestic emissions to 10% of the full price. If the actual emissions intensity is lower than
the allocative baseline, the effective price it pays will be lower than 10%.Because of these factors, the middle scenario remains plausible, albeit perhaps
representing the worst-case scenario where global action on climate change is
insufficient to meet the global temperature goals in the Paris Agreement.
On the other hand, the low scenario represents a world where action is sufficient
26
to hold the global temperature rise to below two degrees Celsius. This scenario
holds the global temperature rise to below 1.8 degrees Celsius with a 66 per
cent probability and would be insufficient to hold the global temperature rise to
1.5 degrees Celsius of warming.77
Third, the RIA indicates royalties in the middle scenario would average NZ$917
million per year between 2027 and 2050. This estimate is considerably higher
than the recent historical average of NZ$653 million per year between 2009 and
2017, when emissions prices in New Zealand and internationally were low. A 40
per cent increase in average annual royalties is significant. MBIE has justified this
increase from the historical average largely on the assumption that global oil
prices will, as a result of growing oil demand, increase from US$41 per barrel in
2016 to US$111 per barrel in 2040 for the middle scenario. 78
An oil price of US$111 per barrel is significantly higher than current market
expectations of future oil prices. For example, oil prices on the futures market
were around US$50 per barrel in 2030 as of early March 2020. 79
If oil prices in 2040 reached well over US$100 per barrel, they are likely to
induce innovation and substitution effects that were uneconomic at lower oil
prices. On the other hand, high oil prices would also spur greater exploration
efforts. The relationship between oil prices and exploration activity is seen in
Figure 10.80
77 IEA, 2019c.
78 While there is no definitive breakeven oil price to move forward with exploration, oil
prices lower than US$50 per barrel are typically less than the cost of oil production in
many parts of the world (Knoema, 2020). On the other hand, oil prices over US$60 per
barrel are sometimes used as a benchmark for renewed exploration activity (Gas Industry
Company, 2017). Analysis by Oil Change International (2017) has indicated that for a new
oil and natural gas field in Norway, a constant real oil price of US$60 per barrel will result
in the field breaking even by 2032, at US$50 per barrel the field would be marginal, and
at US$40 per barrel the field would be uneconomic.
79 CME Group, 2020.
80
Another key driver of exploration activity is New Zealand’s exchange rate.27
Source: Based on MBIE (2019a and 2017) and US EIA (2020)
Figure 10: Expenditure on oil and natural gas prospecting and exploration in
New Zealand and the price of oil.81
Apart from the oil price, oil and natural gas exploration expenditure is generally
incentivised by jurisdictions that display:
• promising geology that indicates the likely presence of oil and natural gas
deposits
• relatively low exploration and extraction costs
• attractive royalty regimes and other production incentives
• good institutions and stable policy environments.
Prior to the ban in 2018, some oil and gas companies were already leaving
New Zealand, or at least beginning to scale back their operations. 82 Investment
in upstream oil and natural gas activities decreased around the world after 2014,
following a slump in global oil prices.83 New Zealand was particularly affected
even though it has stable institutions and a reasonably attractive royalty regime.
The most probable reason for the strong downturn in exploration in
81Prospecting and exploration expenditure refers to annual national expenditure under
prospecting permits and exploration permits.
82Some oil and natural gas companies left New Zealand altogether. For example, prior to
the ban, Royal Dutch Shell sold all its extraction and exploration assets in New Zealand to
OMV for NZ$794 million.
83The sharp decrease in global oil prices in 2014 was due to a significant increase in the
supply of cheap US shale oil combined with relatively slow growth in global demand
(Blasi, 2017).New Zealand, apart from a low global oil price, is because of its relatively high
exploration and extraction costs compared to its competitors. 84
It is worth noting that since the introduction of the ban, the perception of
New Zealand as possessing a stable policy environment has changed. For
28
example, the Fraser Institute’s Policy Perception Index, which reflects the extent
of investment barriers in the oil and natural gas industries, has dropped by
around 20 per cent for New Zealand since the ban’s introduction.85 Even if the
ban were to be repealed, oil and gas companies would be likely to perceive
New Zealand’s policy environment as being uncertain for some time to come.
A fourth reason why future oil and natural gas royalties may be overestimated is
that unless a major oil or natural gas field is discovered soon, efforts to explore
offshore basins other than the Taranaki basin (i.e. frontier basins) could be
curtailed indefinitely, irrespective of the ban.
At the moment, some exploration under existing permits is occurring in frontier
basins. For example, OMV is undertaking a NZ$500 million campaign that
includes an exploration well in the Great South Basin. However, OMV
announced in February 2020 that the Tawhaki-1 exploration well in the Great
South Basin did not find any commercial quantities of oil or natural gas. 86
To be economic, any new field in a frontier basin probably needs to be
comparable in size to Maui, the largest natural gas field in offshore Taranaki.
Given the high costs of developing and operating a field in such a remote and
harsh environment, anything smaller would likely be uneconomic.
84 Frykberg, 2018; Oram, 2018; Oram, 2019.
85 Fraser Institute, 2018.
86 New Zealand Herald, 2020.You can also read