RETAIL First Half 2017 - Research and Forecast Report - Colliers International
←
→
Page content transcription
If your browser does not render page correctly, please read the page content below
Research and
Forecast Report

                     Accelerating success.

   RETAIL
   First Half 2017
EXPERTS
IN PROPERTY DATA & INSIGHTS
Colliers Edge is a subscription service developed by our in-house
property research specialists, drawing on the expertise of our
national network of operators.

  DEEPER INSIGHTS               LIMITLESS SUPPORT         FAIRER PRICING
   Largest data set             Analyst not operators   Tailored to your needs
   on market today

Want better insights, faster? Talk to a Colliers Edge expert today
         Anneke Thompson
         National Director | Research
         +61 412 581 647
         anneke.thompson@colliers.com
         colliers.com.au/colliersedge

                                                              Accelerating success.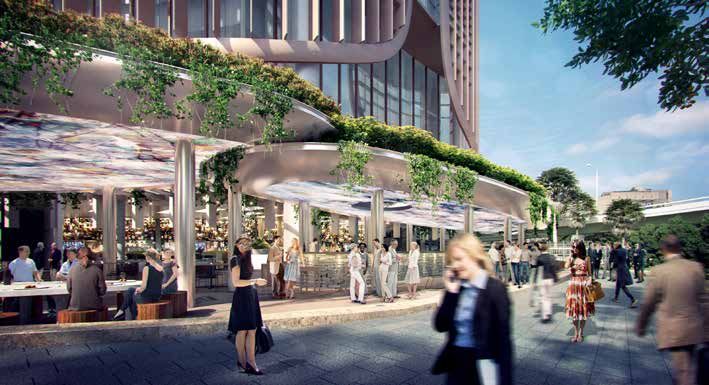
CONTENTS
Retail snapshot                                                                    4

National overview		                                                                5

New Zealand                                                                        8

Sydney CBD                                                                        10

Melbourne CBD                                                                     12

Brisbane CBD & Gold Coast                                                         14

Adelaide CBD                                                                      16

Perth CBD                                                                         18

Centres                                                                           20

Large Format Retail                                                               24

Our experience – Retail                                                           26

                          Retail | Research & Forecast Report | First Half 2017    3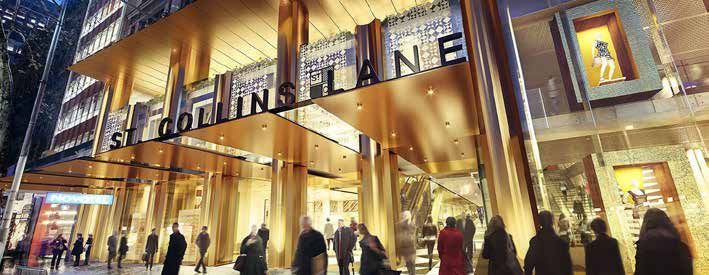
RETAIL
SNAPSHOT
AVERAGE YIELDS
                                          CBD                            REGIONAL                SUB REGIONAL                 NEIGHBOURHOOD        LARGE FORMAT RETAIL

                                  1Q17             1Q18             1Q17        1Q18              1Q17              1Q18        1Q17      1Q18      1Q17         1Q18

SYDNEY                           5.34%            5.07%            5.25%        5.11%            6.13%          6.03%          6.00%      6.00%     7.16%       7.16%

MELBOURNE                        5.00%            4.82%            5.13%        5.03%            6.03%          6.03%          5.73%      5.73%     7.88%       7.68%

BRISBANE                         6.25%            6.05%            5.63%        5.47%            6.25%          6.25%          6.38%      6.38%     7.88%       7.83%

PERTH                            5.55%            5.55%            5.75%        5.56%            6.13%          6.13%          6.60%      6.60%     7.50%       7.50%

ADELAIDE                         5.63%            5.63%            5.88%        5.64%            8.13%          7.90%          7.63%      7.63%     8.00%       7.96%

AVERAGE GROSS FACE RENTS
                                          CBD                            REGIONAL                SUB REGIONAL                 NEIGHBOURHOOD        LARGE FORMAT RETAIL

                                  1Q17             1Q18             1Q17        1Q18              1Q17              1Q18        1Q17      1Q18      1Q17         1Q18

SYDNEY                           $10,760          $10,966          $1,773       $1,812           $1,325             $1,354     $1,075     $1,099    $474         $484

MELBOURNE                        $7,250           $7,357           $1,775       $1,811           $1,060         $1,082          $800       $816     $270         $276

BRISBANE                         $4,650           $4,644           $1,606       $1,627           $1,110             $1,124      $800       $810     $350         $354

PERTH                            $3,665           $3,710           $1,100       $1,110            $788              $794        $555      $560       $190        $192

ADELAIDE                         $2,800           $2,845           $1,613       $1,621            $800              $804        $530       $533     $230         $231

                                                                                  RETAIL SUPPLY                                   NT 85,500
                                                                                                                                        23,022
RETAIL VACANCY                                                                          2017        2018       2019                     4,810

    CBD                        Neighbourhood
                                                                                   170,616 WA
    Regional                   LFR
                                                                                  243,529
    Sub-regional                                                                  193,086                                                                   QLD 131,964
                                                                        4.40%                                                                                    488,810
 4.10%                4.00%
                                                          3.50%3.90%                                                                                             289,028
                                          3.30%
              2.10%
     1.50%                    1.50%               1.60%

              NSW                                         VIC
                              18.20%
                                                                                                                                                                           NSW
                                                                        8.50%
                                                                                                                                                                           250,778
                                                                                                                            16,056 SA                                      386,997
                                                                                                                                                                           372,538
                                                                                                    5.90%                  155,026
                                                                                5.80%
5.80%
                      6.40%                                                                                                 30,242                                   ACT
                                          4.70%                 4.10%
                                                                                                            3.70%                          273,178 VIC               3,935
                                                                                                                                                                     34,461
         2.70%
              3.80%                                                                            2.60%                                      135,710                    59,600
                                                          2.20%                     1.80%
                                                                                                                                          249,003
                                                  0.70%
                                                                                                                                                    TAS 12,000
                                                                                                                                                            24,196
              QLD                                         WA                                   SA
Source: Colliers Edge, PCA
NATIONAL
OVERVIEW
By Daniel Lees
Director | Research Shopping Centre Yield Compression
daniel.lees@colliers.com 0.60%
0.50%
An attractive asset class
0.40%
0.30%
Retail assets within the direct property sector remain attractive
0.20%
from an investment perspective with transaction volumes only
0.10%
restricted by market stock levels. A softer global consumer
0.00%
backdrop and geopolitical headwinds have not reduced rents Regional Sub regional Neighbourhood Ave
within Australian assets, particularly those on the eastern Year to 1Q17 Year to 1Q18
seaboard. Depending on the type of asset sought after, retail Source: Colliers Edge
investors are presented with opportunities to maximise internal
ASIC Insolvency Cases (#)
rates of return through optimising the tenancy mix or exploiting
3,100 240
development opportunities. Additionally, those investors seeking 2,900 220
more defensive positions have found refuge in Neighbourhood 2,700
200
2,500
centres, gaining exposure to non-discretionary spending and 180
2,300
reliable yields. These factors combined explain the rapid rate 2,100
160
140
of compression that has occurred across the retail asset class 1,900
1,700 120
spectrum, with Regional, Sub regional and Neighbourhood 1,500 100
centre average yields compressing 28, 35 and 51 basis points
respectively through the year to 31 March 2017. This trend was
Total Retail trade (RHS)
also evident during the most recent corporate reporting season,
Source: ASIC
where the average cap rates of listed landlords compressed by 25
basis points in the six months to December 2016. Average Retail Vacancy
6.00%
Looking forward, we expect that the rate of yield compression will 5.00%
continue albeit at a slower rate, as global inflation expectations 4.00%
rise and the spread between risk free rates and retail asset class
3.00%
yields settle close to long term historical averages. As such we
2.00%
1.00%
0.00%
NSW VIC QLD WA SA
Dec-16 Mar-17
Source: Colliers Edge, PCA
Australian Forecast Population
30
29
28
27
Millions
26
25
24
23
22
2017 2018 2019 2020 2021 2022 2023 2024 2025 2026 2027
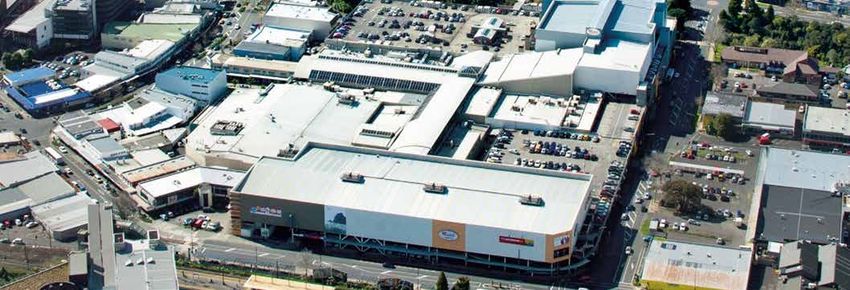
Macarthur Square, Sydney NSW Source: Colliers Edge, ABS
Retail valuation on behalf of GPT Funds Management
Retail | Research & Forecast Report | First Half 2017 5
see average Australian shopping centre yields compressing just         Australian insolvency cases have come down from a recent high
eight basis points on average over the next 12 months, although        of 214 in June 2015 to a low of 124 in the most recent December
this is likely to be higher in Regional centres where yields could     2016 release. Disruption will be accompanied by successes as
reduce 16 basis points on average. We anticipate this compression      select retailers manage to defend their customer proposition
will be facilitated by a lift in transaction volumes as institutions   through product differentiation, experience, service or expertise.
take advantage of the current market pricing conditions and rotate     There has been an unprecedented level of hype surrounding
out of profitable positions.                                           Amazon’s entrance to Australia, and while consumers appear
                                                                       to be eager adopters, this may vary across product categories
                                                                       with under 10 per cent of respondents to a recent Neilson
Disruption will also bring opportunity                                 survey indicating they would purchase fresh produce from the
Disruption within the retail sector is gaining momentum as             online provider. Some goods may simply not become available
the likes of Amazon and Kaufland establish operations on our           to consumers via Amazon such as those that are literally too big
shores and recent arrivals such as Topshop and Topman launch           or cumbersome to ship (bulky goods) or those that are strongly
e-commerce platforms for Australian consumers. Unsurprisingly,         branded such as luxury items.
this has created headwinds for some domestic retail organisations
where outdated strategies have failed to keep up with the
                                                                       Landlords have their eyes wide open
increasingly competitive environment and rising consumer
                                                                       Australia’s shopping centre landlords are well aware of the
expectations. We expect there will be more pain to come, and
                                                                       challenges faced in the retail industry, and have been quick to
lending institutions will no doubt be monitoring the loan covenants
                                                                       adapt. While they may not be able to compete with new online
of domestic organisations operating within these disrupted retail
                                                                       entrants on price alone, they can differentiate on experience,
sectors. However we also note that amidst this upheaval, the
                                                                       service and atmosphere which explains their very deliberate move
number of retail organisations entering external administration
                                                                       into high end food offerings and lifestyle orientated services.
has actually been declining steadily. ASIC data indicates that

Park Ridge Town Centre, Park Ridge QLD
Retail leasing on behalf of RG Property Three Pty Ltd

6
Regional centre owners and managers have been successful in Internet Usage (% of population - 2015)
curating an optimal tenant mix and providing an environment that 100
90
can be experienced exclusively in-store. We acknowledge that 80
70
specialty sales growth has been moderating across the listed 60
50
landlords, however in some instances growth has shifted to other 40
categories such as mini-majors or hospitality offerings. Meanwhile 30
20
vacancy levels have been trending lower across the board, and we 10
0
expect that landlords will continue to innovate in order to remain
relevant to surrounding communities.
The consumer wins Source: World Bank
Interestingly, it’s the consumer that looks to benefit most, as
disruption drives down prices and bricks and mortar retailers Australian Sentiment
look to improve experience and services. New platforms such as 104 16
14
102
Amazon Marketplace will provide more depth to the current online 12
100 10
offering available to Australian consumers, while also delivering 98 8
end to end online sales infrastructure that was previously out of 96
6
4
reach for many small to medium size domestic retailers. Excessive 94 2
0
profit margins that were previously exploited by incumbent 92
-2
90
Australian retailers will now be eroded, as pricing structures and -4
Sep-14
Sep-16
Nov-14
Sep-15
Nov-15
Nov-16
May-14
May-15
Mar-14
Mar-15
May-16
Mar-16
Mar-17
Jul-14
Jul-15
Jul-16
Jan-15
Jan-16
Jan-17
margins become more harmonized with global benchmarks.
Consumer sentiment Business conditions (RHS)
The Australian consumer remains quite healthy, which explains
Source: NAB, Westpac-MI
why so many offshore retailers have been executing entry
strategies over the past few years. We have a high income Australian Retail Sales (% change YoY)
population which is concentrated within a relatively small 7%
number of capital cities, and that population is growing. Internet 6%
5%
penetration is also high, and many Australians are well travelled
4%
with a strong appetite to adopt global brands and fashion.
3%
Sentiment levels have been remarkably resilient in the wake of 2%
several recent geopolitical events and the composition of the 1%
labour market has been improving in recent data releases. Price 0%
Apr-14
Jun-14
Aug-14
Oct-14
Dec-14
Apr-15
Jun-15
Oct-15
Feb-14
Dec-15
Apr-16
Jun-16
Oct-16
Aug-15
Aug-16
Feb-15
Feb-16
Dec-16
Feb-17
increases of major items such as food and fuel have also been
subdued. Total 10Y AVE
Source: ABS
Some headwinds do exist for retail spending, with Australia’s
wage growth inflation hovering around two per cent. The Australian Employment Change (‘000)
wealth effect delivered through the housing market looks to 100
80
be tempering as regulators attempt to contain price growth in
60
residential markets. Retail sales figures have been trending lower 40
over the past three years, although much of this trend can be 20
explained through supermarket wars, turnaround strategies within 0
-20
department stores and corporate failures within the household
-40
goods sector. -60
Jan-2017 Feb-2017 Mar-2017
Part Time Full Time Net
Source: Colliers Edge, ABS
Retail | Research & Forecast Report | First Half 2017 7
Research &
Forecast Report

NEW ZEALAND
Retail | First Half 2017

By Leo Lee                                                             Steady and confident
Manager | Research & Consulting
leo.lee@colliers.com                                                   New Zealand’s consumer confidence remains bouyant, increasing
                                                                       to 121.7 in April 2017 from 120.0 a year ago, according to the
                                                                       latest ANZ-Roy Morgan consumer confidence survey. This level
    MARKET HIGHLIGHTS                                                  of consumer confidence remains robust and in line with economic
                                                                       momentum driven by positive net migration and growth in the
    Increasing house values, booming tourism and strong
                                                                       tourism market.
    population growth, especially in Auckland, continue to drive
    retail spending and keep New Zealand retailers positive.           Expectations around the economy’s future prospects and
                                                                       consumer’s current situation have stayed constant in comparison
                                                                       to 12 months ago, with those believing it is a good time to buy a
    Prime retail locations are highly sought after, highlighting the
                                                                       major household item remaining unchanged at a positive 56.
    importance of branding for many major retailers, with low
    vacancy across Auckland and Wellington.
                                                                       DIY outpacing spending in other categories
                                                                       Rising confidence is loosening the purse strings with hardware,
    Interest rates are on the rise with yields expected to be
                                                                       building and garden supplies at the top of consumers’ wish list.
    relatively flat over the medium term.
                                                                       Retail spending for bulky goods - which includes categories
                                                                       such as the DIY sector, homeware, hardware and furniture - has
Retailers rejoice                                                      outpaced spending in other categories, with annual growth in
                                                                       national spending of 8.4 per cent in the year to quarter four 2016.
Increasing population remains one of the key drivers of the
                                                                       Over the past four years, Auckland’s share of retail spending has
retail sector in New Zealand, underpinned by record high net
                                                                       increased from 35 per cent up to 38 per cent, making up for the
migration of 71,900 migrants in the year to March 2017. This
                                                                       decline in Waikato, Wellington and Christchurch. The remaining
is welcome news to retailers, as more demand for goods and
                                                                       regions around the country stayed relatively constant.
services translates to more money in the till. Housing growth
has been particularly buoyant in Auckland, encouraging some job        Prime space in hot demand
seekers and retirees to buy instead in other cities in New Zealand,
                                                                       Prime retail space is in hot demand in Auckland and Wellington,
particularly in Hamilton and Tauranga, boosting population and
                                                                       pushing vacancy to its lowest level in several years. Auckland’s
regional retail activity.
                                                                       CBD retail vacancy rate was 2.4 per cent in December 2016, the
Other parts of the New Zealand economy are also in good shape.         lowest it has been since 2008, with approximately 2,700 sqm of
Continued growth in the tourism sector has seen visitor arrivals       available space. Wellington has had a resurgence of retail activity
increase 8.9 per cent in the year to March 2017. Visitors are also     along its premier retail strip, Lambton Quay, reducing to 3.3 per
staying in New Zealand longer with over 610,000 visitors here for      cent from four per cent a year ago in December 2015.
22 days and over, up 5.6 per cent from a year ago.
                                                                       More retailers are looking to expand into New Zealand. Last year,
The retail environment remains challenging for some with               David Jones opened its first New Zealand store taking occupation
David Lawrence, Marcs, Shanton and Valley Girl being the latest        of approximately 6,400 sqm on Lambton Quay in Wellington.
casualties over the last year. Amazon’s entry into the Australian      International retail giants H&M and Zara also opened their first
market is set to be a major disruptor to ‘brick and mortar’            stores in the country in Auckland in 2016.
retailers. New Zealand retailers will no doubt have a firm eye on
                                                                       Rents as a result are increasing too, but the CBD rates are ‘leaps
the impact it will have on spending patterns here.

8
and bounds’ above other locations, highlighting the importance of ANZ-Roy Morgan Consumer Confidence Index
branding for many major retailers. Auckland holds the top position 150
for prime net face rents averaging $3,000/sqm. Wellington CBD 140
gross average prime face rents have increased to $1,340/sqm. 130
Rental growth is up 1.7 per cent and 6.7 per cent respectively
Index
120
across those cities. The recent earthquakes in Wellington are likely
110
to push up operating expenses, due to increased insurance costs.
100
Now that inflation is starting to show signs of increasing, reaching
90
2.2 per cent annually in March 2017, this may likely manifest into
higher rents. 80
Apr-15
Apr-17
Apr-10
Apr-11
Apr-12
Apr-13
Apr-14
Apr-16
Apr-02
Apr-03
Apr-04
Apr-05
Apr-06
Apr-07
Apr-08
Apr-09
Interest rates rising Source: ANZ-Roy Morgan, Colliers International Research
Investors remain confident and active in the New Zealand retail
market. Our latest Commercial Property Investor Confidence New Zealand Retail Sales By Category
reached a national net positive of 15.1 per cent (optimists minus Supermarket & Grocery Retail High Street Retail Bulk Retail
pessimists). Although this has reduced from 25.9 per cent 20%
reported in the first quarter of 2016, it is still higher than the long 15%
term average of 11.5 per cent. Annual Percentage Change 10%
5%
Retail property sales for 2016 are set to account for approximately
0%
30 per cent of all property sales activity, up from 22 per cent in
Dec-97
Dec-98
Dec-08
Dec-99
Dec-00
Dec-01
Dec-02
Dec-03
Dec-04
Dec-05
Dec-07
Dec-06
Dec-09
Dec-10
Dec-11
Dec-15
Dec-12
Dec-13
Dec-14
Dec-16
-5%
2015.
-10%
The rate of yield compression experienced in Auckland’s retail -15%
sector continues to provide investors with strong value growth. -20%
Access to quality stock is limited in Wellington, where average CBD
Source: StatsNZ, Colliers International Research
investment yields remained relatively steady over the past year at *Seasonally adjusted
6.9 per cent and Regional Centre yields were at eight
per cent.
Outlook
Notable sales in the first half of 2017 include the WestCity Shopping
Retailers are expected to be upbeat over the medium to long term
Centre for $205 million to Angaet Property Group. The Vendor was
due to positive economic growth forecasts in the main centres and
Scentre Group, who are shifting their focus to expansion of their
regionally. This will keep tenant demand buoyant, and prime retail
existing centres in Newmarket, St Lukes, and Albany.
areas will continue to receive the majority of the enquiry. Rents
Interest rates are rising as banks pass on the cost of their overseas are rising steadily across the precincts and asset classes which
borrowing and seek to attract deposits. Yields are forecasted to be is forecasted to continue. Retail investment activity remains high,
relatively flat over the medium term. however the higher interest rate environment and tighter lending
conditions may become an obstacle this year for investors.
WestCity Shopping Mall, Auckland
Managed on behalf of Angaet Group
Retail | Research & Forecast Report | First Half 2017 9
Research &
Forecast Report

SYDNEY CBD
Retail | First Half 2017

By Daniel Lees                                                         Rail project, demand for space in this precinct is high, pushing our
Director | Research                                                    basket range to $3,750 - $6,750/sqm, up from $3,500 - $6,500/
daniel.lees@colliers.com                                               sqm in the prior quarter. After remaining flat through the end of
                                                                       2016, Pitt Street rents have experienced some uplift on the back
                                                                       of leasing transactions in the food and beverage sector. Average
  MARKET HIGHLIGHTS
                                                                       rents here are now $3,510/sqm, up from $2,823/sqm, while
  We expect that average Sydney CBD retail yields will compress        incentives have simultaneously fallen 100 basis points to 11.5 per
  by 27 basis points to 5.07 per cent by first quarter 2018.           cent. Pitt Street Mall continues to attract the highest gross face
                                                                       rents within the Sydney CBD with an average rate of $14,500/
                                                                       sqm. Meanwhile Pitt Street Mall incentives fell 150 basis points
  Average Sydney CBD gross face rents forecast to increase by
                                                                       over the quarter to an average of six per cent. We have added
  1.9 per cent to $10,966/sqm by first quarter 2018.
                                                                       King Street to our collection basket, with a current rental range
                                                                       of $6,000 - $12,750/sqm, although we expect that leasing activity
  Sydney CBD retail floor space supply will peak at almost 69,000      in the near future will push this range higher. Incentives here are
  sqm in 2020 due to the refurbishment of Harbourside Shopping         currently 8.5 per cent on average. Looking forward we expect that
  Centre.                                                              average Sydney CBD retail gross face rents will increase 1.9 per
                                                                       cent to $10,966/sqm by first quarter 2018, in line with CPI and

Transaction market                                                     Sydney CBD retail employment growth forecasts.

No Sydney CBD transactions have been recorded since August
2016 when 77 Market Street (David Jones) and 66 Hunter Street
                                                                       Tenant moves and
(Rockpool Bar & Grill) sold on yields of 4.5 and 6.33 per cent         development activity
respectively. In the absence of transaction evidence, our Sydney
CBD yield range lies between 4.37 and 6.3 per cent with the            Metro related compulsory acquisitions and withdrawals have
lower bound representing the most recent valuation of Westfield        had a significant impact on Sydney CBD office market, and the
Sydney. Our outlook for the Sydney CBD retail sector is for further    effects have flowed through to the retail sector. The withdrawal
compression in average yields as stock comes to market. Colliers       of 39 Castlereagh Street will see Tiffany & Co and Breitling move
Edge data suggests that the long term historical spread between        to new locations on King Street and Market Street respectively.
the Sydney CBD sector and risk free rates is 96 basis points, far      Additionally the withdrawal of assets on the corner of Pitt and
wider than the current spread of 2.6 per cent. With this in mind,      Park Streets has led to the displacement of retail tenants within
and after factoring in a rise in 10 year bond yields we believe that   the food and beverage sector.
average yields will fall to 5.07 per cent by 31 March 2018.            In terms of other significant tenant moves, we understand that
                                                                       Nike will be establishing a flagship store at 319-321 George

Leasing market                                                         Street while we expect there will be some substantial tenant
                                                                       moves within the Pitt Street Mall precinct to make way for a
Retail assets in Sydney’s CBD attract the highest gross face rents     large international flagship store. At 273 George Street, ING’s
nationally and have grown at a faster pace than any other retail       customer service centre will occupy most of the backfill space
sector. Sydney CBD rents increased 16.32 per cent over the year        left by Max Brenner with a new lobby café taking the remainder.
to an average of $10,760, supported by growth across all major         Oxford clothing will take space within Metcentre with the backfill
precincts. Despite disruption associated with the Sydney Light         refurbished for food and beverage tenancies.

10
Retail development activity for the remainder of 2017 equates to Sydney CBD Retail Yield
5,180sqm, comprised mainly of additional assets in Barangaroo, 10.00%
together with 345 George Street which is expected to attract
8.00%
premium retail tenancies. In 2018, retail floor space supply lifts to
9,668sqm, due to the Carlton House mixed use development. 2019 6.00%
will see supply levels lift sharply to 25,938sqm as developments
4.00%
such as Quay Quarter Sydney, Darling Square and 60 Martin
Place come online. Supply will increase further in 2020 at 2.00%
almost 69,000sqm of floor space, although this mainly due to the 0.00%
redevelopment of Harbourside Shopping Centre (52,000sqm) and
-2.00%
construction of Wynyard Place (7,500sqm).
2010
2015
2011
2012
2013
2014
2016
2017
2018
2019
2020
1995
1996
1997
1998
1999
2000
2001
2002
2003
2004
2005
2006
2007
2008
2009
Spread 10Y Bond Sydney CBD yield
A more sophisticated
Source: Colliers Edge
offering for consumers Sydney CBD Gross Face Rent ($/m²)
$16,000 45%
$14,000 40%
The Sydney CBD office market is in the midst of a significant 35%
$12,000
development phase that commenced with Barangaroo in 2015 $10,000
30%
25%
and will continue out to 2021 and beyond with projects from $8,000
20%
Brookfield, AMP and Lendlease. And as these projects reach $6,000
15%
$4,000
completion, it’s becoming very clear that the standard of retail 10%
$2,000 5%
on offer for consumers is being improved with every iteration. $- 0%
Developers are taking a holistic approach to precinct development, George St Pitt St Pitt St Mall King St CBD
firmly aware that an appealing retail offering whether it be F&B Ave Gross Face Rents % growth YoY
or apparel based, will go a long way to attract the most optimal Source: Colliers Edge
tenants. And while these office and residential tenants are the
most obvious beneficiaries of such projects, the wider consumer Sydney CBD Retail Supply (m²)
population of Sydney also reaps rewards in the form of laneway 80,000
70,000
activation, new brands and more sophisticated dining experiences.
60,000
50,000
40,000
30,000
20,000
10,000
-
2017 2018 2019 2020 2021 2022
New Refurbishment
Source: Colliers Edge
MidCity Centre, Sydney NSW
Sold on behalf of Fortius Funds Management
Retail | Research & Forecast Report | First Half 2017 11Research &
Forecast Report
MELBOURNE CBD
Retail | First Half 2017
By Anika Wong game changer in the footwear industry. Seed Femme, a trend-led
Manager | Research women’s boutique recently introduced their activewear line with
anika.wong@colliers.com many fashion forward brands following suit. As a result of this
trend, designer and dress shoes retailers are pressured to sustain
transaction activity or seek to relocate to cheaper premises.
MARKET HIGHLIGHTS
Footwear retailer RCG Corp - the umbrella group of Hype DC, The
Strong offshore purchaser interest continues to climb Accent Group and The Athletes Foot has also seen stagnating
sales. In reflection of the asset performance of core and non-
core assets, yields are now sitting on a new benchmark where
Tenant demand for central locations drive up prime face rents
compression in core and mid-tier markets of the CBD hit a record
with limited prime grade supply volumes
low on average on a national level.
Established offshore retailers continue to scout the Melbourne
Yields for prime assets sits lowest across the combined
CBD for appropriate retail space with brands such as Massimo
capital cities
Dutti by Zara, Tory Burch, Loewe and Givenchy currently seeking
opportunities for their first foray in the CBD. The rollout of fast
fashion and luxury goods are expected to persist, forcing existing
brands to evolve in order to stay competitive and landlords
Gross face rents in Melbourne CBD have dropped by an average
to reposition their retail presence. Smaller format stores are
of 3.3 per cent to $7,250/sqm over the 12 months to March 2017.
choosing to invest more in their store design and concept to meet
What’s contributed to the average fall are the higher than average
the landscape change and better prepare for new foreign entrants
vacancy levels along Swanston and Little Collins Streets’ strips,
to combat higher rents against sales turnover. In line with this
arcades and laneways. The opening of St Collins Lane and the
growth, we expect to see rental increases, decreasing incentives
beginning of construction of Melbourne Metro Rail have re-
and vacancy rates for super prime spaces to remain low.
directed traffic flow, creating a seamless walkway from Flinders
Street, through to St Collins Lane and Melbourne Central. Gross Other International retailers, such as JD Sports, recently made
face rents for super prime and prime assets however have been its home at Melbourne Central, stocking brands like Nike, Adidas,
trending at the same rate per sqm for the past year. We expect Reebok, Ellesse and North Face. This creates competition with the
this rate to hold steady, as tenants still have appetite for CBD middle-market sport merchants like Rebel Sport and Footlocker,
areas in high foot traffic zones, particularly the super prime who hold stores in the CBD core. Footlocker has also changed
locations of Bourke Street Mall and the Paris end of Collins Street. tenancies to a more sought after location, recently moving their
flagship store from Swanston Street to an annual rent of $1.7
Emerging trends challenge the million on Bourke Street Mall. Another trend to watch in the
leasing market sports apparel and footwear sector is the relocation of retailers
separating their apparel and footwear lines. Adidas for example
Changing demands of the consumer in the fashion world has
targets their training apparel and footwear at their Bourke Street
seen a shift in consumer choice for casual sportswear. The
store whilst their Melbourne Central store is isolated for sports
rise in popularity of activewear has not only put pressure on
fashion.
retailers to create a segment of sports apparel but struck as a
12Landlords are smiling with opportunity to Melbourne CBD Gross Face Rents
re-align tenant mix 8000
7500
Retailers between Swanston and Elizabeth Street are currently 7000
experiencing above average vacancy. Leading Australian fashion 6500
brands David Lawrence and Marcs on 289 Collins Street fell into
6000
$/sqm/pa
5500
administration in February this year as a result of deteriorating 5000
sales, weak cash-flow and tough competition. However landlords 4500
with capacity to take on the wait-and-see approach may look 4000
2007
2008
2009
2020
2010
2011
2012
2013
2014
2015
2016
2017
2018
2019
to reset their tenant calibre off the back of Sandro Paris, Reiss,
Series1 Series2
Maje and Scanlan Theodore currently tenanted in St Collins Lane. Source: Colliers Edge
Vacancy rates in the remaining CBD Core have reduced from
5.20 per cent to 3.85 per cent the lowest it has been in five years Melbourne CBD Gross Incentives
and is expected to remain relatively subdued as Melbourne’s Mar-17 5.50%
diversifying population mix, growth in Asian tourism and the low
Australian dollar prompt off-shore fashion retailers to secure a Mar-16 6.00%
spot in Melbourne’s CBD.
Mar-15 4.00%
Incentives for super prime and prime retail assets remains
the lowest on a national level, decreasing from six per cent in Mar-14 5.00%
December 2016, to now average 5.5 per cent. Landlords have
Mar-13 5.00%
been reducing incentives in areas of strong demand from the Food
and Beverage and Luxury end retailer sectors. In areas of higher Mar-12 1.67%
vacancy, however, incentives can be negotiated at circa 10 per
cent. 0.00%
Melbourne CBD Prime Incentives
According to the City of Melbourne, total annual expenditure in Source: Colliers Edge
the CBD has risen 16 per cent since 2013 to $3.03 billion with
Food and Beverage making up approximately 80 per cent of retail
transactions. The fierce competition among existing players and and workers to shop before and after work or during their lunch
new entrants including supermarket and department store sectors break. This drive in demand is primarily fuelled by growth in CBD-
resulted in a surge in sales as value-hungry consumers are fed based workers and residential population.
the benefits of discounted price points and frequent specials. At a time where Melbourne’s CBD retail investment market is
Consumers are spoilt with choice to shop and eat within short running high, we expect leasing activity to remain elevated and
distance with the food-delivery service boom, 17 new designated attractive on a global scale for buyers seeking a low-volatile
food truck sites and new stores creating convenience for students market and stability in returns.
St. Collins Lane, Melbourne CBD VIC
Retail management on behalf of JP Morgan
Retail | Research & Forecast Report | First Half 2017 13Research &
Forecast Report
BRISBANE CBD & GOLD COAST
Retail | First Half 2017
By Helen Swanson within the city’s centre. Recent refurbishments and additions to
Manager | Research the retail tenancy mix is also providing a renewed ambience and
helen.swanson@colliers.com improved streetscape to Brisbane’s CBD. In particular a mix of
tenancies which attract people in the daytime and in the evening
are resulting in an uplift in patronage in certain precincts of
MARKET HIGHLIGHTS
Brisbane’s CBD particularly in the rejuvenated street of Edward.
Prime grade high street retail gross face rents head The Brisbane City Council has been diligent in its efforts to stretch
northward making the CBD sit as the third most expensive the Edward Street precinct with completion of an $11.8 million
region across Australia. beautification project that included the addition of sub-tropical,
mature trees and improved lighting as well as improved boulevard
pavements.
Improved business conditions, strong population growth and
record tourism numbers are assisting retail trade turnover Some recent additions to the CBD tenancy mix in the Macarthur
across the South East. Central Shopping Centre located on the Corner of Queen and
Edward Streets include:
Yields across all retail categories have tightened over the • Hardy Brothers
past 12 months to March 2017. • Hugo Boss
• NAB
Additionally, Burger Project have also recently committed to
Brisbane 500sqm at 144 Edward Street for a period of ten years.
Leasing market Investment market
Gross face rents in Brisbane’s CBD sit as the third most expensive The outlook for the retail market in Brisbane is positive with
in the country at an average of $4,650/sqm, below that of Sydney improving business conditions, strong population growth and
at $10,760/sqm and Melbourne at $7,250/sqm. On a year on year increased tourist numbers. Yields across all asset classes have
(YoY) basis for March 2017 rents in Brisbane’s CBD recorded the tightened over the 12 months to March 2017. Within the CBD
second highest growth rate of all capital cities at 5.68 per cent. yields for strip retail currently range between 5.5 and seven per
Brisbane CBD has recorded positive and progressively stronger cent and have tightened on average 50 basis points over the last
rental growth for retail tenancies from September Quarter 2016. 24 months. Strengthening rents driven by improved retail trade
This trend was not confined to Brisbane CBD retail, as rents for figures and limited supply of quality investment stock has seen
specialty tenancies within regional and neighbourhood centres yields head south over this period.
also recorded strong growth over the period. Whilst gross face
rents have risen, incentives remain a key feature of the retail The largest retail transaction to take place recently in the inner city
market especially for non-luxury based tenancies which currently region of Brisbane is the sale of Post Office Square in late 2016.
sit at circa 15 per cent. Looking forward we anticipate gross face The retail arcade which is located underground between Queen
rental growth for CBD tenancies to remain in positive territory this and Adelaide Streets sold for $95 million to La Salle Investment
year at between two to three per cent. Management and included a net lettable area of 1,756sqm along
with 29 specialty tenants, six ATM’s and a 316 bay car park. The
Driving rents in Brisbane’s CBD is strong population growth along
recent sale reflects the continued demand for quality retail centres
with increased tourism numbers which is assisting retail trade
by major institutions and global fund managers.
14Gold Coast Brisbane CBD Yields
11%
Significant number of major infrastructure projects along with 10%
strong population growth, record tourist numbers and limited 9%
supply pipeline is seeing strong results both from an investment 8%
and leasing perspective for retail property on the Gold Coast. 7%
A record number of shopping centre sales on the Gold Coast took 6%
place in 2016 and current indicators suggest this trend should 5%
Mar-94
Mar-95
Mar-96
Mar-03
Mar-04
Mar-97
Mar-98
Mar-99
Mar-00
Mar-01
Mar-02
Mar-05
Mar-06
Mar-07
Mar-08
Mar-09
Mar-10
Mar-11
Mar-12
Mar-13
Mar-14
Mar-15
Mar-16
Mar-17
continue on in 2017. Strong demand for assets offering stabilised
income flows located particularly in high pedestrian flow areas Low High
have been fiercely contested by private, individuals, SMSFs and Source: Colliers Edge
syndicates. Limited availability of this stock however has seen
fierce competition by investors to purchase these assets resulting Brisbane Neighbourhood Retail Yields
in yields tightening 50 basis points over the last 12 months to 11%
March 2017. As a result of limited stock of prime grade, long 10%
WALE retail style assets available to purchase, investors have 9%
looked to move up the risk curve and purchase assets with either 8%
a development upside and or those requiring a leasing reposition 7%
strategy. This has consequently seen the gap between prime and 6%
secondary grade retail assets diminish over recent months. 5%
Mar-94
Mar-96
Mar-95
Mar-97
Mar-98
Mar-99
Mar-00
Mar-01
Mar-02
Mar-03
Mar-04
Mar-05
Mar-06
Mar-07
Mar-08
Mar-09
Mar-10
Mar-11
Mar-12
Mar-13
Mar-14
Mar-15
Mar-16
Mar-17
A boom in the construction sector on the Gold Coast is also
seeing strong demand for large format centres with rents seeing Low High
Source: Colliers Edge
some upward movement since last year and yields tightening 25
basis points for the 12 months to March 2017. Further news in
this sector sees three former Masters stores to become enticing and employ up to 150 staff. Tenants will include retailers along the
retail malls by mid to late 2017. Home Consortium, representing likes of JB Hi-Fi, Spotlight, The Good Guys, Super A Mart, Nick
major retail industry interests will operate the malls, at Bundall, Scali, Supercheap Auto, and Fantastic Furniture.
Nerang and Upper Coomera, and each is proposed to have a cafe
1 William Street, Brisbane
Retail leasing on behalf of ISPT and Cbus
Retail | Research & Forecast Report | First Half 2017 15Research &
Forecast Report
ADELAIDE
Retail | First Half 2017
By Kate Gray accounts for nearly 40 per cent of the tenants in the precinct.
Associate Director | Research
Rents however have remained steady at this stage and fall within
kate.gray@colliers.com
a wide band of $1,800/sqm to $3,800/sqm. Incentives have
remained stable at 20 per cent of a lease, but it is expected as
MARKET HIGHLIGHTS vacancy tightens on Rundle Mall that incentives will start to fall
which will result in net effective rental growth.
Sustained Growth in retail sales in South Australia
Citi centre under contract
Vacancy on Rundle Mall falls Citi Centre, 141-159 Rundle Mall is on the corner of Rundle Mall
and Pulteney Street is understood to be under contract at time of
Sales activity driven by private investors writing. This is a mixed use building which has ground floor retail
(2,611 sqm) and office accommodation above (13,750 sqm). This
has frontage to both Rundle Mall and Pulteney Street and there
Retail sales continue to grow above are future opportunities to reposition the retail component of this
national average asset, which is currently configured as retail space facing Rundle
mall and Pulteney Street with a Food Court. This is a leasehold
Retail sales in South Australia have seen a sustained trend of
site which was owned by a Singaporean investor and is expected
above national average growth over the last 12 months with an
to be purchased by a local investor. Sale price has not been
annual growth rate of 3.3 per cent. This has been driven by strong
disclosed at time of writing.
growth in Café and Restaurants, Food and Other retail categories.
Household goods sales growth was slightly below the state Through 2016, $21.8 million of assets exchanged hands in Rundle
average growth. Department store sales have fell by 7.9 per cent Mall, with all of these in the second half. This was over three
and 4.1 per cent respectively. This above average growth in retail assets which include 3 Rundle Mall, 138-140 Rundle Mall and
sales has supported increased enquiry and falling vacancy for 133 Rundle Mall. All of these assets were purchased by private
many prime retail strips and centres. investors. This is well below the activity in 2015 which saw record
volumes, with the two largest assets in the mall exchanging –
Vacancy falls in Rundle Mall the Myer Centre and Rundle Place. Assets in Rundle Mall are
reasonably tightly held and usually when offered to the market
Vacancy in Rundle Mall has fallen to 2.8 per cent down from 4.2
attract strong interest.
per cent in September 2016. This is the lowest level of vacancy
we have seen since mid-2013. There are several new tenants
New development underway in Rundle Mall
which have moved into Rundle Mall over the last half which
included Levi (74 Rundle Mall), Lululemon (98 Rundle Mall) and Construction has commenced in February at 11-13 Rundle Mall
Gong Cha (6 Rundle Mall). Several tenants have moved to a which is the former Katie’s site. This development is a two
different position on Rundle Mall over the last half which included level building which is understood to be leased to Bank SA on
Mazzucchellis, Temt, Hairhouse Warehouse, Pandora, Adidas and completion. This construction is expected to complete in the
Jo Mercer. Demand for retail space on Rundle Mall has lifted over second half of 2017. There have been several refurbishments
the second half which has resulted in vacancy falling. Clothing undertaken the last half with the Levi, Lululemon, Mazzucchellis,
and footwear remains the key tenant type in Rundle Mall which Temt, Hairhouse Warehouse, Pandora, Adidas and Jo Mercer all
having new fit outs as they move into new accommodation.
16Aldi continues to grow
SA Retail Sales (% change YoY)
Aldi has continued to grow in South Australia with the latest store 7%
to open in Hawthorn in early April. This is after the opening of St 6%
Agnes, Mount Barker, Noarlunga, Kilburn and Modbury in March. 5%
4%
With the Hawthorn store opening there are now 14 Aldi stores 3%
in operation. There are a further five stores which have been 2%
1%
announced which are in Aldinga, Berri, Evanston, Victor Harbor
0%
and Kensington Gardens. Aldi plans to open 10 stores in 2017. -1%
Longer term Aldi expect to have a store network of around 50 -2%
stores and will have over half of their store network open by the
end of 2017. SA National retail sales
Source: ABS
Domayne opens their first SA store
Rundle Mall Vacancy
The furniture, bedding and homewares retailer Domayne has
opened their first store in South Australia in March. This store is 5%
located in the large format strip at 919-929 Marion Road, Marion.
4%
This new construction also includes a new store for Plush sofas.
3%
They join other retailers in the precinct such as Freedom, The
Good Guys, Snooze, Nick Scali, Barbeques Galore and the Sofa 2%
Shop. 1%
0%
Source: Colliers Edge
Murray Bridge Marketplace, Murray Bridge SA
Retail management on behalf of SCA Property Group
Retail | Research & Forecast Report | First Half 2017 17Research &
Forecast Report
PERTH
Retail | First Half 2017
By Quyen Quach To avoid being a casualty, major shopping centre owners
Senior Research Analyst | Research have proposed an estimated $3.95 billion in expansions and
quyen.quach@colliers.com improvements over the next five years; seeking to turn these
centres into entertainment, leisure and tourism hubs.
MARKET HIGHLIGHTS The social isolation associated with online shopping generates an
opportunity to attract customers by creating vibrant destinations.
Major centres undertaking works to reposition assets By creating diverse activity centres, where shoppers can interact
and have unique experiences, centre owners hope to defend
Weak housing market continues to impact ‘Household Goods’ themselves from the threat of becoming a retail backwater.
turnover Past centre closures in the US were a function of declining
population and economic activity within catchments, in addition to
CBD rents adjusting as demand softens the e-commerce onslaught.
Perth’s centres face less of this threat. As the population
continues to expand from a relatively small base. Economic
The ‘Amazon Threat’ activity, although sluggish, is expected to improve. Though this
The threat from e-commerce ramped-up late in 2016 following should not instigate complacency amongst centre owners. The
Amazon’s announcement of its impending roll-out in Australia. creation of ‘destination’ complexes by larger shopping centres,
The first ‘fulfilment’ centre is due to open in the eastern states in poses significant risks to less significant centres. With an
the near term with other States to follow. Amazon is also likely increased capacity to attract pedestrians, there is a heightened
to introduce a physical store model in Australia, as a necessary risk traffic and tenants will be detracted from these mid-size
complement to its online business. centres.
Australia’s regional centres, located long distances from capital Current retail market conditions
cities, can generate distribution difficulties for online retailers.
WA’s economic woes continued to cause sluggish retail conditions
Physical stores in these regional centres have the potential to
over the March 2017 quarter. Population growth slowed to 0.97
reduce delivery difficulties and maintain service levels similar to
per cent in September 2016. Consumer confidence remains
capital city offerings.
supressed, as key contributors to this measure, such as
Major retail centre owners move to unemployment, underemployment and income growth, remained
reposition assets soft.
Over the next decade Perth’s retail sector landscape could In line with this, Perth’s ‘Household Goods’ turnover during the
look distinctly different than it does today. The race is now on March 2017 quarter fell 5.25 per cent year on year. Meanwhile,
to ‘Amazon-Proof’ existing centres’ connections with the local online retailing disruption and consumer belt tightening are likely
community, in order to defend market share. behind the 5.12 per cent contraction in ‘Department Stores’
turnover.
A shift in consumer attitudes toward shopping and the rise of
online retailing, has instigated the demise of dozens of shopping Sectors that grew over the year were ‘Café, Restaurants etc.’and
centres in the US over the past decade, with more expected. ‘Food’. Together, these improvements underpinned a 0.46 per
cent total turnover growth.
18Retail spend per capita declined 0.33 per cent to $3,232 in Perth CBD Mall & High Street Average Rents
September 2016. However, this was still 3.04 per cent higher than $4,500
the national rate of $3,137 per person. $4,000
The lacklustre retail turnover results drove retail employment
Average Gross Rate $/m²
$3,500
down 6.5 per cent or 9,500 employees in the year to March 2017. $3,000
The demand for retail space in Perth remains subdued, impacting $2,500
rental growth. CBD mall rents were averaging $3,665/sqm for $2,000
space ranging between 50sqm and 100sqm at the end of March $1,500
2017. This is down from $3,845/sqm at the end of December $1,000
2016.
Sep-05
Sep-09
Mar-10
Sep-10
Mar-11
Sep-11
Mar-12
Sep-12
Mar-13
Sep-13
Mar-14
Sep-14
Sep-15
Mar-05
Mar-06
Sep-06
Sep-07
Sep-08
Mar-07
Mar-08
Mar-09
Mar-15
Mar-16
Sep-16
Mar-17
Neighbourhood centre rents also contracted. The rise in space
Source: Colliers Edge
available for lease over the past year has caused rents to fall to an
average of $555/sqm Western Australia Shopping Centre Supply (sqm)
Notwithstanding this, most major centres maintained strong 250,000
occupancy levels. Major centre owners remain optimistic 200,000
about Perth’s future, and are forging ahead with significant
150,000
redevelopment and expansion plans.
In terms of future supply of shopping centre floor space in the 100,000
Perth metropolitan area, 143,504sqm is scheduled for completion 50,000
in 2017. From here, supply peaks in 2018 at 231,840sqm before
falling steadily over the following years in 2019 (161,701sqm), -
2015 2016 2017 2018 2019 2020 2021
2020 (123,903sqm) and 2021 (19,400sqm).
Source: Colliers Edge
Investment demand
During the December 2016 quarter, the most significant
transaction was Dexus’s $140 million purchase of Carillon City
from Brookfield and Hawaiian. This returned an initial yield of
approximately 5.47 per cent.
Robust investor interest and low interest rates continue to drive
capital towards retail assets with secure cash flow. This has
resulted in tightening yields for assets in prime locations.
However, it is possible yield compression may be starting to
bottom out, as the credit environment appears to be tightening.
The outlook
WA recently voted in a new State Government, delivering more
short-term political certainty. This has generated optimism that
the worst is behind WA. Business confidence received a boost
from announcements of new capital expenditure and job creation
initiatives.
Deloitte Access Economics is forecasting further soft retail
conditions for WA, but are expecting turnover growth to rebound
The Gateway Shopping Precinct, Alkimos Beach
in 2017-18 and surpass the national growth rate.
Leased on behalf of Marmion Network
Retail | Research & Forecast Report | First Half 2017 19Research &
Forecast Report
CENTRES
Retail | First Half 2017
By Daniel Lees In addition to apparel, Colliers International has experienced an
Director | Research uplift in shopping centre tenant enquiry from banking and financial
daniel.lees@colliers.com services together with food and beverage operators seeking
placement within restaurant courts.
MARKET HIGHLIGHTS Supply
Offshore retailer growth strategies will maintain leasing demand During the December 2016 reporting season, listed landlords
within Australian shopping centres. disclosed the attractive development yields being achieved with
Scentre Group and Mirvac delivering yields of 7 to 7.5 per cent.
It is therefore unsurprising that the development pipeline from
The arrival of Amazon will be disruptive but there will be more
the listed sector amounts to just over $6 billion, and the broader
than one winner.
supply of retail floor space is growing.
Shopping centers are striving to provide consumers with The overall supply of retail floor space increases from
unique in-store experiences, hence the substantial development 944,027sqm in 2017 to a peak of 1,491,751sqm in 2018. From
pipeline. this point, supply tapers to 1,198,307sqm in 2019, 752,070sqm
in 2020 and then 471,827sqm in 2021. Supply in all periods is
skewed to shopping centres which is unsurprising given the high
Shopping centres yield on development available to landlords. 2017 shopping centre
supply is weighted to Victoria (192,473sqm) and New South Wales
Leasing demand (175,813sqm). 2018 marks the peak of shopping centre supply,
with a concentrated to Queensland (285,011sqm) and Western
While many of the international retailers have already established Australia (213,840sqm). In 2019, current shopping centre supply
a foothold in the Australian market, growth strategies are still is skewed to New South Wales (213,977sqm) and Queensland
in their infancy ensuring steady demand for floor space within (213,330sqm).
Australian shopping centres. TK Maxx has recently commenced its
store rollout following the acquisition of 35 Trade Secret assets Amagone?
from Gazal Corp in 2015. In addition to the 35 existing sites, TK
Amazon is coming, and as the outgoing CEO of Wesfarmers
Maxx will be aiming to increase its network to at least 50 over
Richard Goyder famously stated, the retail giant is widely
the next 12 months, seeking sites of approximately 2,000sqm
anticipated to “eat all our breakfasts, lunches and dinners”. There
predominantly on the Australian east coast. TK Maxx’s product
is no doubt that Australian retailers are currently experiencing a
mix is broadly comprised of 50 per cent fashion, 30 per cent
period of poor sentiment as news of Amazon’s entry to Australia,
household items or homewares and 20 per cent hard goods such
together with the demise of several high profile retailers in the
as bags and accessories. We also understand that The Foschini
United States hit the news wires. We have already witnessed
Group has entered the Australian marketplace and is also poised
the impact of new entrants on the Australian market, particularly
for growth over the coming 12 months.
amongst incumbent retailers who could not compete on price,
While the above brands and the other large international retailers range or supply chain, and had been applying strategies that were
will increase competitive pressures already hindering sales within simply out of date. While Amazon’s arrival implies there is more
the discount department store sector, it should provide some level pain to come in the retail sector, this probably won’t be isolated to
of comfort to landlords that any vacated floor space will be met by the bricks and mortar sector. Online retail is a very difficult model
steady demand.
20to perfect, evident in the successes, or lack thereof of pure play Regional Centres - 1Q17 Gross Face Rents ($/sqm/pa)
online retailers in the Australian marketplace. Incumbent online
$2,000 10%
players such as ASOS, The Iconic and Surfstitch will now find it 5%
harder to demonstrate a clear customer value proposition given $1,500
0%
they are effectively online aggregators of existing products, which -5%
$1,000
is precisely what Amazon excels at on a global scale. Australian -10%
consumers like to try new things, and the majority of Amazon’s $500
-15%
-20%
offering is expected to be received well. A recent Neilson survey
$0 -25%
suggested that Australian’s will likely be keen adopters of the Sydney Melbourne Brisbane Perth Adelaide
Amazon suite of products, especially categories of electronics, Gross Face Rent % growth YoY
books, clothing and shoes. Meanwhile under ten per cent of
Source: Colliers Edge
respondents to the Neilson survey indicated they would consider
buying fresh meat and vegetables from the online retailer.
Sub regional Centres - 1Q17 Gross face rents ($/sqm/pa)
So while there has been a lot of hype around Amazon Fresh, the
$1,400 8.0%
global retail giant will have the challenging task of overcoming $1,200
6.0%
4.0%
Australian grocery shopping behaviour, together with capturing $1,000 2.0%
market share from Australia’s supermarket duopoly comprised $800 0.0%
-2.0%
of Coles and Woolworths, who have established online grocery $600 -4.0%
$400 -6.0%
capabilities. Pundits are quick to point out the disruption and -8.0%
$200
angst Amazon’s arrival will bring, but there is room for more than -10.0%
$0 -12.0%
one winner. Amazon Marketplace will expand Amazon’s product Sydney Melbourne Brisbane Perth Adelaide
offering and increase competitiveness for existing retailers but it Gross Face Rent % growth YoY
will also provide smaller retailers with an end to end online sales
Source: Colliers Edge
capability that was previously out of reach. Retailers that may have
once only considered eBay, will now be able to outsource online
Neighbourhood Centres - 1Q17 Gross face rents ($/sqm/pa)
sales portals, inventory management systems and supply chain
$1,200 10.0%
management to Amazon.
$1,000 5.0%
A defendable position $800 0.0%
$600 -5.0%
In the face of disruption, shopping centres are becoming far more $400 -10.0%
relevant. It is the role of Australian landlords to build physical
$200 -15.0%
marketplaces where transactions can take place between buyers
$0 -20.0%
and sellers and create an environment where retailers can achieve Sydney Melbourne Brisbane Perth Adelaide
optimal performance. Gross Face Rent % growth YoY
This goes some of the way to explain the significant shopping Source: Colliers Edge
centre development pipeline as landlords invest heavily in
refurbishments, experiences and place making. Essentially So while it is very hard to say that shoppers prefer online over
shopping centres must create a unique customer value proposition bricks and mortar or vice-versa, we can say that consumers enjoy
that can only be experienced in-store, hence the evolution of unique engaging experiences across multiple sales channels, and
restaurant courts and outdoor dining precincts that are now this is exactly the kind of environment Australia’s landlords are
becoming prominent amongst Australia’s premium shopping striving to create for retailers and shoppers alike.
centres.
Shoppers must be engaged whether it be through the tactile
Australian Shopping Centre Productivity
experience of a Tesla display, or the experience of creating a Following the influx of headlines regarding the poor performance
personalised Mon Purse handbag. The attraction of a completely of US shopping malls, we have conducted some analysis on
customised product or experience cannot be under estimated. shopping centre productivity and retail floor space per capita
According to Redbubble CEO Martin Hosking, 67 per cent of his across both US and Australian shopping centres. Looking
organisation’s sales are for items that sell 50 times or less which specifically at the comparable specialty categories of apparel
demonstrates the consumer’s desire for individuality.
Retail | Research & Forecast Report | First Half 2017 21and shoes, furnishings, jewellery and food services, it appears Regional rents have remained static over the quarter at $1,775/
that Australian Regional centres are more productive across all sqm despite gaining 5.1 per cent over an annual period, and have
these categories with the exception of furnishings. Additionally average incentive levels of five per cent. In Perth, Regional centre
between FY2015 and FY2016 the average productivity level rents have continued their path lower, falling -4.3 per cent over
improved across all categories in Australia while deteriorating the quarter and -22.8 per cent over the year to $1,100 according
across apparel and shoes and furnishings in the US. Furthermore to our collection sample. Broadly speaking, retail sector turnover
the analysis suggests that Australia is better placed than the US conditions in Perth are still challenging, and retail turnover per
in terms of retail floor space per capita across the vast majority of capita has been trending lower since 2012. Landlords have
retail assets. resorted to sharper reductions in asking rents to secure tenants,
and hence have not had to lift incentive offerings over the period.
Leasing Market In Adelaide, Regional rents have remained unchanged for the
fifth consecutive quarter at $1,613 while average incentive levels
Shopping centre leasing metrics remain the most favourable remain at 15 per cent.
on Australia’s eastern seaboard, with Sydney, Melbourne and
Brisbane posting year on year gross face rental increases across Sub Regional Centres
all asset classes. This trend has been supported by evidence Australian Sub regional centres are facing the challenge of falling
from the listed market, where almost all landlords reported sales within the Discount Department Store (DDS) space although
positive leasing spreads in the first half FY2017 reporting season we note that not all DDS are suffering. Specialty rents within the
earlier this year. This positive rental growth is occurring against sector have demonstrated resilience over the year, with centres in
a backdrop of moderating like for like specialty sales growth Sydney (+2.9 per cent) and Melbourne (+5.5 per cent) registering
however sales are increasing in other segments such as mini- gains over the year to $1,325/sqm and $1,060/sqm respectively.
majors, particularly across more productive portfolios. Rents within our Brisbane sample remained static over the same
period at $1,110. Conditions in Adelaide (-9.9 per cent) and Perth
Regional Centres (-6.0 per cent) did deteriorate over the year although Adelaide did
Rents within our basket of Regional centres within Sydney have not register any decline over the quarter.
improved marginally over the quarter, with the average lifting
0.74 per cent over the quarter and 4.3 per cent over the year Neighbourhood Centres
to $1,773/sqm. Specialty rents are performing well in centres Generally speaking, Neighbourhood centres have continued to
that have recently undergone refurbishment, although incentive trade well given their weighting to non-discretionary spending
levels were retained at an average of 12.5 per cent. Melbourne and convenience based specialty retail offering. Sydney
Delacombe Town Centre, Ballarat VIC
Retail leasing on behalf of H.Troon
22You can also read