RETAIL Second Half 2018 - Research and Forecast Report - Colliers International
←
→
Page content transcription
If your browser does not render page correctly, please read the page content below
Research and
Forecast Report

                      Accelerating success.

   RETAIL
   Second Half 2018
EXPERTS
IN PROPERTY DATA & INSIGHTS
Colliers Edge is a subscription service developed by our in-house
property research specialists, drawing on the expertise of our
national network of operators.

  DEEPER INSIGHTS               LIMITLESS SUPPORT         FAIRER PRICING
   Largest data set             Analyst not operators   Tailored to your needs
   on market today

Want better insights, faster? Talk to a Colliers Edge expert today
         Anneke Thompson
         National Director | Research
         +61 412 581 647
         anneke.thompson@colliers.com
         colliers.com.au/colliersedge

                                                              Accelerating success.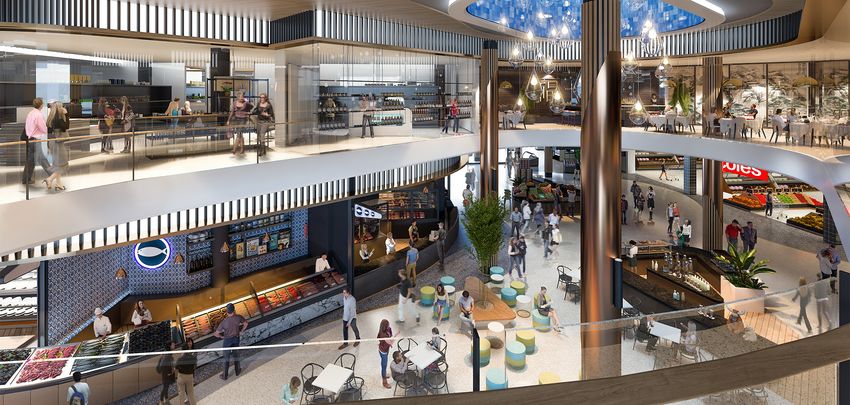
CONTENTS
Retail snapshot                                                                4

National overview		                                                             5

New Zealand                                                                     8

Sydney CBD                                                                     10

Melbourne CBD                                                                  13

Brisbane CBD & Gold Coast                                                      15

Adelaide CBD                                                                   17

Perth CBD                                                                      19

Centres                                                                        21

Large Format Retail                                                            24

Our experience – Retail                                                        26

                      Retail | Research & Forecast Report | Second Half 2018    3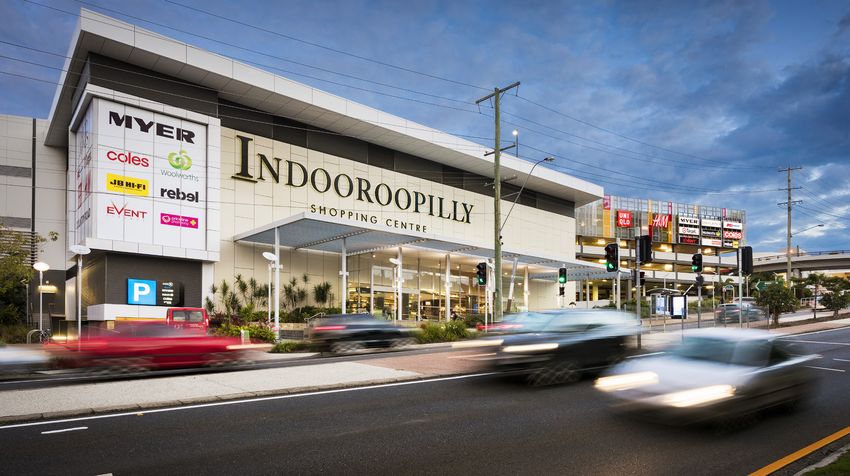
RETAIL
SNAPSHOT
 SEPTEMBER      AVERAGE GROSS                   AVERAGE
                                MOVEMENT YOY               LOWER YIELD   UPPER YIELD   AVERAGE YIELD
    2018          FACE RENT                    INCENTIVE

SYDNEY

CBD                $12,253                       9.4%        3.90%         5.50%          4.70%

Regional           $1,950                       14.0%        4.00%         5.50%          4.75%

Sub regional       $1,275                       17.5%        5.50%         6.85%          6.18%

Neighbourhood      $1,000                       15.5%        5.50%         7.00%          6.25%

Large Format        $492                         8.0%        6.00%         7.25%          6.63%

MELBOURNE

CBD                $7,375                        7.0%        4.10%         5.50%          4.80%

Regional           $1,750                       10.0%        3.75%         5.50%          4.63%

Sub regional       $1,005                       16.0%        5.25%         6.85%          6.05%

Neighbourhood       $765                        15.5%        5.00%         6.75%          5.88%

Large Format        $270                        12.0%        7.00%         8.00%          7.50%

BRISBANE

CBD                $4,175                       17.0%        5.25%         6.00%          5.63%

Regional           $1,550                       15.0%        4.25%         5.75%          5.00%

Sub regional       $1,050                       25.0%        5.50%         7.00%          6.25%

Neighbourhood       $700                        25.0%         5.5%         7.00%          6.25%

Large Format        $355                        15.0%        7.00%         8.00%          7.50%

PERTH

CBD                $3,245                       13.5%        4.85%         5.50%           5.18%

Regional            $995                        15.0%        5.50%         6.00%          5.75%

Sub regional        $763                        15.0%        6.00%         7.00%          6.50%

Neighbourhood       $450                        20.0%        6.20%         7.50%          6.85%

Large Format        $203                        12.5%         7.15%        8.00%          7.58%

ADELAIDE

CBD                $2,650                       15.0%        4.75%         6.00%          5.38%

Regional           $1,425                       20.0%        5.00%         6.25%          5.63%

Sub regional        $675                        30.0%        6.00%         8.00%          7.00%

Neighbourhood       $510                        20.0%        6.50%         8.00%          7.25%

Large Format        $238                        15.0%        7.25%         8.25%          7.75%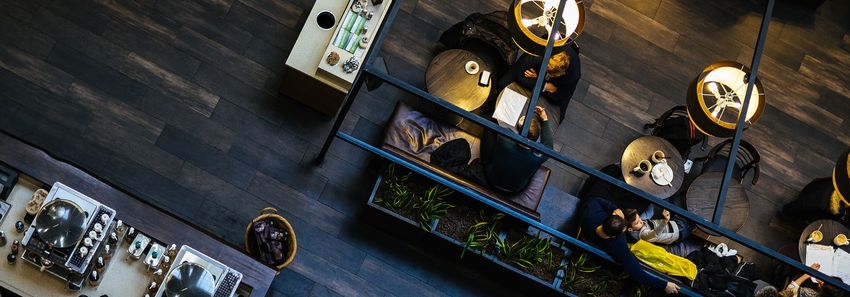
NATIONAL
OVERVIEW
By Alex Pham Australia’s GDP Growth
Director | Research 6%
alex.pham@colliers.com 5%
4% 3.41%
3%
MARKET HIGHLIGHTS 2%
1%
The Australian retail market continues to be supported by strong
0%
population growth and a solid employment market.
-1%
Jun-00
Jun-02
Jun-04
Jun-06
Jun-08
Jun-05
Jun-09
Jun-03
Jun-07
Jun-98
Jun-99
Jun-01
Jun-10
Jun-12
Jun-14
Jun-16
Jun-18
Jun-15
Jun-13
Jun-17
Jun-11
Rising consumer spending on the back of falling savings and low
MoM Growth GDP Growth YoY 30-Year Average
unemployment is indicating a positive outlook for wage growth. Source: Colliers International, ABS
The rise of localism is emerging as an important influence on Job Vacancies (‘000) and Unemployment Rate
consumer preferences and purchasing decisions. 10.0% 250
230
9.0%
210
Retail market fundamentals
8.0%
190
7.0% 170
remained supported 6.0% 150
130
5.0%
110
4.0%
The Australian retail property sector has continued to perform 90
3.0% 70
well, despite a challenging retail environment globally. There are
2000
2002
2004
2006
2008
2005
2009
2003
2007
2001
2010
2012
2014
2016
2018
2015
2013
2017
1998
1999
2011
several factors that underpin the resilience of the retail environment Unemployment rate-LHS Job vacancies*
in Australia and its uniqueness compared to other international Source: Colliers International, ABS
markets. These catalysts include a growing population and strong *Vacancies data not available between Aug-08 and Aug-09
employment conditions in conjunction with sustained household
spending. Australia’s population has surpassed 25 million and is employment rose by 30,000 people YoY. Reflecting the strength
growing by approximately 1.6 per cent per annum, one of the fastest of the employment market, Australian employment increased
rates of growth in the developed world. Over 29 million people will by 29,000 persons in August 2018 and the unemployment rate
be calling Australia home over the next decade, which will provide decreased to 5.3 per cent. Not only there are more jobs the quality
tremendous support for the retail economy. Off the back of the of employment has also improved with full-time jobs increased
strong population growth and improving economic conditions, the by 20,900 in August whilst part-time employment increase by
Australian government is delivering an immense infrastructure 8,000 persons. On an annual basis, total employment increased by
program worth over $75 billion over the next 10 years. As a result, 303,100 persons over the year to August 2018. This represents a
GDP has accelerated by 3.4 per cent over the year to June 2018, growth rate of 2.5 per cent YoY, which was well above the 20-
securing the strongest rate of growth since September 2012 and year average of 2.0 per cent per annum. With the unemployment
exceeding the Reserve Bank’s expectation of 3.0 per cent. rate forecast to dip below 5.0 per cent and participation rate being
maintained at near record high levels, all indicators are pointing
Consumer spending is rising on the back of declining household
towards a gradual pick up in wage growth over the near term.
savings and positive employment outlook. As a result, household
final consumption expenditure has been one of the largest Consumer confidence, as measured by the Westpac Melbourne
contributors to economic growth over the past few quarters, Institute Index of Consumer Sentiment, has risen by 1.0 per cent
increasing by 0.7 percent during the second quarter of 2018 to 101.5 in October from 100.5 in September 2018. Confidence has
and contributing 0.4 percentage points to GDP growth. Housing been maintained in positive territory, with the index trailing above
construction activity remains strong with investment in new 100, for almost a year since December 2017. Income tax cuts,
dwellings jumping 3.6 per cent for the June quarter. The strength of strong economic growth, a solid job market and ongoing recoveries
residential and infrastructure building activities has driven revenue in the resource-based states are the primary pillars of support for
in the construction industry up by 1.9 percent whilst industry consumer confidence over the past year. In a similar vein, business
Retail | Research & Forecast Report | Second Half 2018 5
confidence has also improved in recent months with the Roy                   help improve shoppers’ experience but also extend their stay at
Morgan Business Confidence rating index rising by 1.2 per cent to            the centre and in turn, hopefully, increasing total spending on other
111.5 in September 2018. This is a significant improvement after a           products or services. Food retailing and supermarkets also continue
decline in the previous month due to political instability in the Liberal    to gain footprint across the board. Analysis by Colliers reveals
leadership, which has since been resolved. The business confidence           that the number of food and beverage operators within Australian
index has averaged 116.0 over the year to date, which is the highest         shopping centres have increased by almost 28 per cent over the
yearly average since 2015. Most businesses have are holding                  past 10 years. In 2008, only 20 per cent of all shopping centre
positive views on the Australian economy and planning to grow their          tenancies nationally were food retailers, cafés or restaurants and
operations over the next five years.                                         that proportion has increased to 24 per cent in 2018.

The ongoing tourism boom continues to work in favour of                      The market is also witnessing the rise of innovative retail solutions
Australia’s capital cities and particularly the luxury retailing industry.   talking up more retail spaces and generating additional income for
A record of 9.1 million visitors have arrived in Australia in the year       shopping centre owners. One emerging concept is the “click-and-
ending August 2018, an increase of 5.5 per cent over the previous            collect” locker system that is increasing in popularity. The locker
year. Total spending on local goods and services by international            delivery system is available 24/7 and can be managed online,
travellers increased by 6.0 per cent to $42.3 billion with over half         providing a convenient solution for time-conscious and technology-
of which derived from Chinese tourists. The depreciation of the              savvy consumers. The concept is already being trailed in Australia
Australian dollar and increased direct flight routes to Australia are        by major retailers and shopping centre owners. Another new trend
expected to further boost the inbound tourist number. According to           that is taking shape in Australia is co-retailing. This new retail model
IBISWorld forecasts, the number of international arrivals is expected        allows multiple retailers to trade multiple product lines in the same
to grow by an average of 5.1 per cent per annum on over the next             store on a flexible basis in prime shopping locations. One example
five years, to 11.71 million by 2023.                                        is “My Cube”, which has established four co-retailing stores in
                                                                             Queensland and New South Wales and is looking to roll out more
Emerging retail trends                                                       stores nationally and in CBD locations.

The rise of retail localism                                                  Leveraging on new technologies
As the retail world continues to evolve and consumer behaviours              The rise of new technologies is providing significant opportunities for
change, we are also witnessing the rise of localism within the               shopping centre operators to capture data on their consumers and
Australian retail environment. Originated from a social and economic         help improve operational efficiency. Insights into shopper behaviours
phenomenon, localism is becoming a major influence on consumer               and purchasing patterns will help inform centre owners to better
preferences and purchasing decisions in Australia and globally. This         design their spaces and optimise tenant mixing. The latest tech
means consumers are becoming increasingly attached to the local              trends include facial and biometric recognition technology, magic
ecosystem and more involved with their neighbouring community.               mirrors, smart change rooms, beacon push notifications as well as
This is evidenced by the fact that almost 90 per cent of Australians         the integration of virtual reality and shopping experiences. Despite
prefer to shop regularly at their local stores and the majority are very     the strong growth in online retailing, it’s important to recognise
much interested in local affairs and community events, according to          that about 95 per cent of shopping activity in Australia is still being
surveys by Relationships Australia. More than ever, shopping centres         done at brick-and-mortar stores. However, availability of instore
will have to become more deeply entrenched and connected with                information is pivotal in attracting and retaining shoppers as statistics
the catchment community they serve. Each community will have                 from Google shows that 80 per cent of consumers will shop in store
distinct needs and requirements, while shopping centre owners are            if they know the items they want are available immediately.
to critically embrace an intimate understanding of the catchment             Advances in building management technologies are also helping
population. The rise of localism will also channel increased                 shopping centre owners to improve efficiency and cut costs. The
demand for additional public and community spaces. Furthermore,              focus continues to be on reducing energy consumption in shopping
placemaking initiatives such as community gardens, youth start-up            centres, which is one of the largest cost items for a centre,
or co-working spaces or child care facilities are become more                through the implementation of new technologies such as building
prevalent across the shopping centres in the country.                        automation controls, solar power generation, natural ventilation and
Diversifying tenancy mix                                                     LED lighting. Our anecdotal evidences show that the implementation
                                                                             of innovative and high-performance HVAC systems can help reduce
Another key retail trend that has been apparent for some time and
                                                                             annual energy costs by 30 to 40 per cent and deliver significant
expected to intensify is the increasing prevalence of experiential and
                                                                             uplifts to property values. Additionally, other initiatives such as
lifestyle retailing within shopping centres. Gyms, medical centres,
                                                                             ticketless parking system, smart advertising screens, reverse
entertainment, childcare, schools and showrooms are performing
                                                                             vending machines and activation of underutilised car parking
well and continue to gain popularity. These offerings will not only

6
spaces are being increasingly implemented by owners to generate Retail Sales MAT Growth
ancillary income. These changes are all aiming at making shopping 9.0%
as a leisure and convenient activity for consumers, which is the 8.0%
most important factor driving the retail market going forward. 7.0%
6.0%
Undeterred investor demand 5.0%
4.0%
Despite some crosswinds in the sector, investor demand for 3.0%
2.0%
Australian retail assets has remained sturdy with demand
1.0%
stemming from a diversity of buyers including offshore investors, 0.0%
Aug-08
Feb-09
Aug-09
Feb-10
Aug-10
Feb-12
Aug-12
Feb-14
Aug-14
Feb-16
Aug-16
Feb-18
Aug-18
Feb-15
Aug-15
Feb-13
Aug-13
Feb-17
Aug-17
Feb-11
Aug-11
private syndicates, local institutions and listed groups. Total
investment value amounted to $4.5 billion over the first three Total Non-Discretionary Discretionary
quarters of 2018, in line with the corresponding figure last year. Source: Colliers International, ABS
However, Colliers International anticipates transaction volumes
to ramp up over the last quarter of the year with several major
Exchange Rate and Tourism
portfolio transactions yet to be crystallised into our data. One of
1.20 1.00
the largest portfolio transactions recently was Vicinity Centres’ 0.95
1.10
sale of ten Sub Regional and Neighbourhood shopping centres to 0.90
0.85
SCA Property Group and one Neighbourhood shopping centre to 1.00
0.80
a private investor, for a total consideration of $631.0 million. The 0.90 0.75
0.70
aggregate sale price reflects a weighted average capitalisation 0.80
0.65
rate of 6.9 per cent. Institutional investors have been the most 0.70
0.60
0.55
active purchasers since the beginning of this year accounting for 0.60 0.50
Aug-08
Aug-09
Feb-09
Aug-10
Feb-10
Aug-12
Feb-12
Aug-14
Feb-14
Aug-16
Feb-16
Aug-18
Aug-15
Feb-18
Feb-15
Aug-13
Feb-13
Aug-17
Feb-17
Aug-11
Feb-11
over 40 per cent ($1.8 billion) of total transaction value. They are
followed by private and offshore investors who purchased $1.4 US$ per A$-LHS In/Out Tourism Ratio
billion (32 per cent of total) and $680 million (15 per cent) of Source: Colliers International, ABS
shopping centres respectively.
Indooroopilly Shopping Centre, Indooroopilly QLD
Sold on behalf of Commonwealth Superannuation Corporation (CSC)
Retail | Research & Forecast Report | Second Half 2018 7
Research &
Forecast Report
NEW ZEALAND
Retail | Second Half 2018
By Chris Dibble
Director | Research & Communications
chris.dibble@colliers.com
ANZ-Roy Morgan Consumer Confidence Index
MARKET HIGHLIGHTS
145
The reduction in retailer sentiment is not translating into lower 135
activity as retail spending continues to grow. 125
115
A number of major shopping centre developments are
Index
105
underway in Auckland.
95
Wellington and Christchurch’s retail sector provide a relatively 85
stable rental environment, but for differing reasons. 75
Mar-09
Sep-08
Sep-09
Mar-10
Mar-12
Mar-14
Mar-16
Mar-18
Sep-10
Mar-15
Mar-13
Sep-12
Sep-14
Sep-16
Sep-18
Sep-15
Mar-17
Sep-13
Sep-17
Mar-11
Sep-11
Confidence down, but sales growth remains
Source: ANZ-Roy Morgan, Colliers International Research
Retailer confidence has been hampered by consumers signalling
they are entering a more reserved period of spending due to Retail Vacancy Rate
projections of slower economic growth and a reduction in the 13%
rampant residential capital value growth environment experienced
11%
over the last few years. However, this cautious sentiment has yet to
translate into activity, perhaps a result of rising wage growth, low
Overall Vacancy Rate
9%
unemployment, job security and home loan rates which look set to
7%
remain low due to accommodative monetary policy employed by our
Reserve Bank. 5%
Statistics New Zealand captures the latest positive period of sales 3%
activity with growth in total sales volumes and values recorded in 1%
the June 2018 quarter. While continued growth across the majority
Jun-10
Jun-12
Jun-14
Jun-16
Jun-18
Jun-15
Jun-13
Jun-17
Dec-10
Dec-12
Dec-14
Dec-16
Dec-15
Dec-13
Jun-11
Dec-17
Dec-11
of industries can be seen, the food and beverage industries are still
Auckland Wellington
capturing the lion’s share of retail spend in New Zealand. And, while
still representing a small, but rising proportion of total retail sales Source: Colliers International Research
activity, online retailing continues to influence the bricks and mortar
vacancy to 4.5%, up from 3.3% a year ago. This is primarily driven
sector in New Zealand as it does globally, especially for those
by secondary suburban retail rather than other areas and quality of
not incorporating digital retail technology or trying to sell easily
retail space.
substitutable goods and services.
Solid demand for CBD retail space remains, but naturally, prime
Leasing opportunities up, but not all are ideal space is best in retail. Those facing the biggest challenges in the
Auckland’s overall retail vacancy rate increased to 3.1% in June sector are those located off main pedestrian flows or operating
2018, the highest level of vacancy since June 2011. One of the from stores under ownership with limited appetite to commit capital
major areas of movement was recorded in strip retail, with a rise in expenditure to attract consumers.
8
Strong Auckland retail expansion underway                                 the past eight years, with GDP up 23% to NZD 20.7 billion, mean
                                                                          annual earnings up 26% and jobs growth more than doubling since
The retail supply pipeline is the largest it has been this cycle
                                                                          2010, according to data from Infometrics, StatisticsNZ and MBIE,
with just under 180,000 sqm of space to be built in the next few
                                                                          respectively.
years. Examples of some of the development and expansion
activity includes Scentre Group investing $790 million towards            According to information from ChristchurchNZ, within the four
the redevelopment of Westfield Newmarket. Kiwi Property Group,            avenues there is now a working population of 38,500 and more
owners of Sylvia Park, is going ahead with a $223 million galleria        than 4,300 businesses. With 6,000 residents and a total of 838,000
expansion as well. Precinct Properties’ Commercial Bay retail             guest nights, central city foot traffic is reaching an average of 17
centre continues to evolve after the opening of the four-storey           pedestrians per minute.
flagship H&M store. The remaining 100 or so stores are anticipated        There are now more than 300 retailers in the central city including
to open by September 2019. More developments are proposed                 fashion retailers such as H&M, Max, Barkers, Rodd & Gunn, Seed
across the city, but timeframes are fluid. The developments range         Heritage, Trenery, Witchery, Macpac and more. The opening of new
from smaller neighbourhood centres to more major mall additions           stores has seen Inner CBD retail sales year-on-year growth of 15%
like in Albany. Given the known increases in floor space over a short     between 2012 and 2017 increase to 40% between 2017 and 2018,
period of time with coinciding completion dates, a continued rise in      according to Marketview. The recently opened three-level, NZD
vacancy is likely.                                                        50 million development, Hoyts EntX cinema that offers 900 seats
Rents are stable, but new records will be set                             spread across seven screens, with 13 food outlets signed up also
                                                                          lifts the central city vibe. Around 700 shared electric scooters from
Auckland CBD prime average net face rents remain unchanged
                                                                          San Francisco-based company Lime have also debuted to keep the
at the record rate of $2,775 per sqm. Landlords are expected to
                                                                          city moving.
temper their expectation of rent rises over the short term due to
lower consumer confidence. However, in contrast, new shopping             It is all of these supportive factors, along with more leasing
centres under construction and under expansion are pushing new            opportunities with a 23% vacancy rate, enabling retailers to commit
rental rate benchmarks.                                                   to new business plans in central Christchurch. Assisting in this
                                                                          decision is the relatively flat rental environment in the central retail
Different story in the capital city                                       precinct, typically ranging between $700 per sqm to $1,250 per sqm.
Wellington’s golden mile along Lambton Quay and Willis Street
continues to experience steady occupier demand with limited
availability in prime spots. Further out from the central city,
Shopping Centre mall demand is somewhat back on track after the
completion of refurbishment programmes and sales activity has
risen modestly. However, overall retail conditions have remained
broadly similar in Wellington CBD over recent months. Strip retail
vacancy has edged down slightly to 6.8% from 6.9%, albeit this
is above the two-decade average of 5.8%. Retail vacancy along
Lambton Quay tightened marginally to 4.5%, a decrease of 0.1%
from six months ago.

Limited changes in overall leasing activity has meant that gross face
CBD prime rents in Wellington increased only slightly, now at $1,318
per sqm, up only 1.8% in the past year. Average regional shopping
centre rental growth rates remain relatively flat, like average bulk
retail rents which have remained flat for almost two years. Average
retail yields remained relatively steady albeit a slight softening in
average regional centre yields occurred, now at 8.3%.

Christchurch entering a new era
Positioning itself as the world’s ‘newest’ city, Christchurch is
entering a new era as a compact and modern community centre
with solid economic growth as well as consumer confidence that is
above the national average. Supporting the positive long-term view        Three Kings Café, Auckland
held by Christchurch City Council is the growth experienced over          Sold on behalf of Fletcher Living

                                                                        Retail | Research & Forecast Report | Second Half 2018                 9
Research &
Forecast Report
SYDNEY CBD
Retail | Second Half 2018
By Alex Pham
Director | Research
alex.pham@colliers.com
Sydney CBD Yield Spread
MARKET HIGHLIGHTS 12%
10%
Retail space demand in the CBD is underpinned by strong 8%
growth in luxury and premium retailing 6%
4%
A new wave of international brands are expected to arrive 2%
over the next 12 months 0%
-2%
Retail rents have remained elevated -4%
1998
1999
2000
2001
2002
2003
2004
2005
2006
2007
2008
2009
2010
2011
2012
2013
2014
2015
2016
2017
2018
S Spread 10Y Bond Sydney
Luxury retailers are driving demand for the Source: Colliers Edge
Sydney CBD
The Sydney CBD retail market continues to experience solid tenant 3Q18 Sydney CBD Gross Face Rents ($/sqm/pa)
activity underpinned by the strong performance of luxury and $18,000 25%
$16,450
lifestyle retailers. Rising inbound tourism, particularly from Asia, $16,000
21.37%
20%
remains the primary driver of growth for luxury retail sales in $14,000
$12,710
Sydney. Over the year to March 2018, the harbour city has received $12,000
15%
$9,375
$10,000
a record of 4.1 million international tourists, up by 8.4% from last
$8,000
year. Overseas visitors have spent nearly $9.5 billion during the $6,000
$5,625
10%
$4,260
year ended March 2018. Chinese tourists are not only the largest $4,000 3.73%
5%
source of inbound tourism to Sydney, but also have the strongest $2,000
4.65%
2.86% 0.00%
spending power. Over $3.3 billion worth of merchandise and $0 0%
George St Pitt St Pitt St Mall King St CBD
services were purchased by travellers from Mainland China. On a Ave Gross Face Rents % growth YoY
per capita basis, however, Singaporean tourists were the biggest
Source: Colliers Edge
spenders, splashing out $222 per night, almost double the overall
average spent per tourist. The rapid rise of affluent travellers from
Asia with deep pockets has further bolstered premium retail trade
for Sydney, which is expected to grow by 6.0-8.0% year on year.
10Capitalising on the increased spending and rising demand for Food retailers continue to expand
high-end products, luxury retailers have continued to expand and
Supermarket chains continue to expand their footprints in the
upgrade their flagship stores in the Sydney CBD, whilst more
CBD with a strong focus on small format convenient based stores.
international brands continue to arrive. Louis Vuitton has unveiled
Woolworths has opened another Metro store on Pitt Street Mall in the
a new temporarily flagship store at 345 George Street, while its
basement of Sydney Arcade. This is the forth Woolworth Metro store
King & George Street Maison building undergoes a complete facelift
within the CBD retail core. In response to Woolworths’ aggressive
costing $11 million. ISPT’s retail redevelopment, now known as
expansion in the CBD, Coles has also announced plans for a new
George Place, also welcomes Nespresso and Georg Jensen’s new
range of convenience stores in inner city locations to be rolled
concept stores which are expected to open soon. Tiffany & Co is
out over the next 12 months. Meanwhile, David Jones is spending
still outfitting their newest store at Dexus’ 175 Pitt Street, which
$200 million on the renovation of its flagship Elizabeth Street store
is also going through a significant makeover with completion due
featuring a massive “Food Hall” as the up-market department chain
in mid-2019. Over at the Castlereagh Street precinct, Bvlgari has
launches its own food venture called David Jones Food. In addition
recently revamped its opulent boutique at 64-68 Castlereagh
to the food concept to be opened within their traditional department
Street. Hermes has expanded its retail footprint by moving to the
stores, David Jones is also rolling out a new chain of urban-based
Trust Building at 155-159 King Street. Other high-end brands such
mini-supermarkets across Australian capital cities.
as Cartier, Chanel, Gucci and Valentino are also looking to expand
their operations. As such, demand for high quality retail spaces in A new generation retail concept bank branches continue to emerge
the Sydney is expected to remain solid over the coming 12 months across the Sydney CBD. The latest entry was Bankwest opening its
with Colliers International continuing to assist multiple global luxury new flagship store at the HCF building at 403 George Street. This
retailers to enter the tight Sydney CBD market. follows Suncorp’s opening of the Discovery Store end of last year. So
far, ANZ, Commonwealth Bank, HSBC and NAB have secured their
When automobiles meet haute couture
flagship presence in the Sydney CBD. These trends are expected to
Off the back of the buoyant activity in the luxury retailing sector, continue over the next 12 months with other local and international
the Sydney CBD is about to witness a new breed of luxury retailers banks are on the lookout for prime premises in the city centre.
moving to the CBD; i.e. the luxury car brands. Hyundai’s high-end
offshoot Genesis has entered to an agreement to open its first
Retail rents remain elevated
flagship showroom in Australia at 400 George Street. Genesis’ Gross face rents in the CBD have remained elevated over the past
entry to the Sydney CBD market follows the success of Tesla at 20 six months on the back of limited availability and sustained demand.
Martin Place and mirrors an emerging trend across other global Pitt Street Mall commands the highest level of gross face rents in
cities, where luxury car brands are taking up premium locations in the CBD at $10,000 to $22,900 per sqm commensurate with the
city centres and shopping malls. Following the successful launch of high levels of foot traffic. The adjacent George Street continues
the Mercedes ‘me’ concept store (masquerading as a coffee shop- to achieve strong face rents of $3,000 to $7,500 per sqm despite
of course) at the Rialto complex right in the heart of Melbourne’s the ongoing disruptions from light rail construction, with incentives
‘Parisian’ retail precinct on Collins Street, the German automobile ranging from 10% to 13%. The rental gap between George Street
manufacturer is opening another boutique showroom in the middle and Pitt Street Mall is expected to narrow once the light rail and
of Brisbane’s Golden Triangle at 300 Adelaide Street. With limited pedestrianisation is complete in early 2020. King Street remains
availability, Sydney CBD remains the toughest and most expensive the top location for luxury retailers with gross face rents fetching
market to break in for car showrooms, but Colliers International between $6,000 and $12,750 per sqm. On the other hand, Pitt
believes these trends will continue with other up-market car brands Street remains the most affordable option for retailers in the CBD
such as Audi, Lexus, Porsche, Infiniti and Alfa Romeo, that are all retail core. Gross face rents on Pitt street outside of Pitt Street Mall
planning to raise their profile by setting up high-end showrooms in range around $2,520 and $6,000 with the tenancy mix favouring
city centre locations. food & beverage offerings and entertainment venues catering
for CBD office workers and rising number of local residents.
Additionally, the area has also started to see some discounted
luxury fashion retailers arriving due to the high traffic.
Retail | Research & Forecast Report | Second Half 2018 11Shifting boundaries rooms – 2021). Furthermore, residential development activity in
the Sydney CBD is showing no sign of slowing. Major projects that
A massive influx of investment across a multitude of infrastructure,
are being delivered include Lendlease’s Darling Square (505 units
commercial and residential projects in the Sydney CBD are
– 2019), Greenland Centre (479 units - 2020), 196 Pitt Street
expected to have positive knock-on effects on the CBD retail
(267 units – 2021), Crown Residences (82 units – 2021), 338
market over the coming years. Much like the way the Barangaroo
Pitt Street (660 units – 2021), 201-207 Elizabeth St (262 units
development has revitalised the retail precinct on Sydney’s western
- 2022), 505-523 George Street (588 units – 2024), Yuhu’s One
corridor, the completion of the Sydney CBD Light Rail, Wynyard
Circular Quay (184 units – 2022), 77 Market Street (108 units –
Place and the new retail development at 388 George Street and
2023), amongst others.
No.1 Martin Place amongst others, will be a game changer for the
retail area along George Street and the surrounds of Wynyard Most importantly, as the City of Sydney embraces more mixed-use
Station. Over the medium terms, however, the retail core gravity is and high-density developments, the city centre will be transformed
expected to shift north to Circular Quay, where significant volumes into a multi-functional shopping and entertainment destination
of commercial and mixed-use developments will be activated in catering to a diverse mix of office workers, urban dwellers and
conjunction with the redevelopment of Circular Quay Wharf. New inbound tourists. This continued positive backdrop is driving
mixed-use developments will include AMP’s Quay Quarter Precinct the push by Sydney City Council to extend trading hours in the
(8,000 sqm of retail space to be delivered in H1 2022), Lendlease’s CBD to cater for the vast numbers of tourists and local residents
Circular Quay Tower (2,260 sqm retail- H2 2021), Mirvac’s 55 demanding shopping hours into the evenings throughout the
Pitt Street (800sqm retail- 2022+), Poly’s 210-220 George Street Sydney CBD precinct. This, in turn, will have tremendous positive
(564sqm retail- 2022) and Yuhu’s 1 Alfred Street (5-star hotel benefits for CBD retailers and landlords.
plus luxury residences with ground floor retail). Most importantly,
these multi-functional developments are expected to transform the
area from an office-based retail precinct to a vibrant seven-days-
a-week trading zone further supported by a night time economy.
Further ahead, the future developments at the new Martin Place
Metro Station and Sydney Central Station (from 2024+) will trigger
significant uplifts for the retail precincts in the City Core and the
Southern section of the Sydney CBD.
Outlook
Looking forward, the outlook for the Sydney CBD retail market
remains bullish with space demand being supported by a
broad mix of tenants including luxury retailers, high-end car
showrooms, supermarkets and boutique food and beverage
offerings. Infrastructure, commercial and residential developments
are expected to activate retail trading conditions and increases
in rental values. In addition, the lowering Australian dollar and
increase number of high quality hotels in the CBD will continue
to make Sydney the most visited city in Australia, especially for
affluent travellers from Asia.
A plethora of premium hotel developments in the Sydney CBD that
are under construction include the Meriton Suites Sussex Street
(175 rooms – Q4 2018), Adina Apartment Hotel (175 rooms – Q4
2018), W Hotel & Apartments (402 rooms – 2020), Crowne Plaza
Macarthur Square, GPT NSW
Sydney (152 rooms – 2020) and Crown Hotel Resort Sydney (350 Valued on behalf of GPT Funds Management Limited
12Research &
Forecast Report
MELBOURNE CBD
Retail | Second Half 2018
By Sarah Walker
Manager | Research
sarah.walker@colliers.com
CBD Vacancy
MARKET HIGHLIGHTS 12.00%
10.00%
Retailers preference north and west precincts
8.00%
Landlords upgrading lobbies and retail to compete with new
6.00%
development supply
4.00%
The future Metro Tunnel entices retailers to secure a slice of 2.00%
Swanston Street 0.00%
Dec-16 Mar-17 Jun-17 Sep-17 Dec-17 Mar-18 Jun-18 Sep-18
Leasing market NSW VIC QLD
Source: Colliers Edge
The second half of 2018, gross face rents have remained at
$7,375/sqm where they have been for the last twelve months and Melbourne CBD Retail Yields
are forecast to gradually increase to approximately $7,500/sqm 6.00% forecast
over the next 12 months. Buying and leasing activity has been
5.00%
moving towards the north and west ends of the city. Interest in
4.00%
the west has been driven by the upcoming opening of the Ritz
Carlton at the West Side Place development in Spencer Street, the 3.00%
luxurious St Regis Hotel near Southern Cross Station and the W 2.00%
Hotel along Collins Street in the western core. As these precincts 1.00%
evolve, typically a five day a week trading area, trade will increase
0.00%
throughout the week as it transforms from a working zone to a
Aug-20
Jan-21
Jan-16
Jul-18
Jul-13
Jun-21
Jun-16
Sep-12
Mar-20
Sep-17
Aug-15
Feb-18
Feb-13
Dec-18
Dec-13
Oct-14
Apr-17
Oct-19
Nov-16
Mar-15
May-14
May-19
tourist hub.
Source: Colliers Edge
The Metro Tunnel project has also been a driver of popularity
amongst retailers towards the north of the CBD epicentre. It was
Melbourne CBD Gross Face Rents & Incentives ($/sqm)
initially expected that the project would result in sluggish sales
$8,000 8.00%
and reduced foot traffic however demand and activity along the $7,800 7.00%
strip have been high. Despite construction underway, retailers are $7,600 6.00%
$7,400
swarming to secure a slice of Swanston Street as they look ahead 5.00%
$7,200
4.00%
to the future. Instead of being turned off the area while it undergoes $7,000
3.00%
$6,800
transformation, retailers can see the benefit in being part of the $6,600 2.00%
new-look Swanston Street, which will offer even more foot traffic $6,400 1.00%
$6,200 0.00%
and public transport connectivity.
Jun-14
Jun-16
Jun-15
Jun-18
Sep-14
Sep-16
Sep-15
Sep-18
Jun-17
Sep-13
Sep-17
Dec-14
Dec-16
Dec-15
Dec-13
Dec-17
Mar-14
Mar-16
Mar-15
Mar-18
Mar-17
Average incentives are at 7.0 per cent, the same as the beginning of
the year, the lowest level across the CBD retail precincts nationally. Face Rents Gross Incentives
Source: Colliers Edge
It is expected to remain at this level for the next twelve months.
Retail | Research & Forecast Report | Second Half 2018 13Swanston Street – Retailers shift preference the Melbourne CBD Retail Term was engaged to create a new
to the north of the city ‘Melbourne Laneway’ precinct, bridging the gap between the banks
of the Yarra River on Southbank to Freshwater Place. A strong
Interest has ramped up in the north of the city due to the amount
food and beverage tenancy mix including: Asado (San Telmo team),
of high-density apartments, student accommodation, the Victoria
Old Man Pho, Infinite Wasabi, Thailander, Poked, Workshop Bros,
Market and universities. Scape’s flagship student accommodation
Shanghai Market, Dagwood Deli and 30ML creating a diverse and
at 393 Swanston Street to be home to over 750 students, was
exiting offering for the wider community.
secured by three new tenants at the ground floor retail component.
ChaTime (32 sqm), Ezymart (71 sqm) and Mrs Zans Kitchen Tightly held investments resulting in record
(55sqm) following a strong contest for these spaces towards the demand and compressed yields
northern end of Swanston Street. Rents in this area are being The tightly held strip Bourke Street is a globally recognised
negotiated circa $6,500/ sqm. Demand is coming from both local, destination which has experienced a rapid series of transactions.
national and Asian retailers who are looking to be located in the In the 18 months to Q3 2018, there has been over $500 million
northern end in proximity to new student accommodation which is of investment across approximately a dozen transactions, more
driving up rents. Increased traffic from the future CBD North Metro than any other corridor in Melbourne’s central business district.
station as well as nearby RMIT University and Melbourne Central Most recently,189-191 Bourke Street sold for $13 million fetching
shopping centre has given tenants confidence about the future a strong land rate of $65,657/ sqm. Earlier in the year 274-278
performance of this end of the CBD and Swanston Street more Bourke Street transacted above $40 million after over 200 buyer
broadly. Strength in this precinct is evident in 242 Swanston Street enquiries from investors. The property had not been offered to the
(180sqm) which was leased to Top Tea. The space had over 150 market for over 60 years. Retail rents in the Bourke Street Mall
enquiries and was leased within 4 weeks. are achieving more than $10,000 to $12,000 per square metre net
There are an estimated 10,000 residential dwellings and more which has translated to strong capital growth and driven underlying
than 40 developments that are close to completion or approved for land values within the Mall to more than $200,000 per square
development in the northern corridor. This growing population has metre. Yields along the mall have been as sharp between 3.00 to
created the opportunity for retailers to trade 24 hours a day, seven 4.00 per cent. There are only 13 freehold properties in the Bourke
days a week. Hungry Jacks has repositioned its flagship store from Street Mall, they are highly coveted by specialist investors and major
its former Flinders Street location to a new 500 sqm corner space tenants. Record demand has been from Australian investors as well
at 260 La Trobe Street, with a rent in excess of $700,000 a year. as offshore including Singapore, Malaysia, China, Hong Kong and
latest hotspot Macau.
Rising trend of lobby upgrades and improved
food & beverage options Over the past 6 months, Melbourne CBD retail yields have
compressed only slightly 8 basis points to 4.80 per cent. The recent
A current trend for landlords is refurbishing lobbies and upgrading
transaction of 362 Little Collins Street achieved a yield below 3 per
food and beverage options, to enhance the buildings amenity for its
cent, comprising four levels with a ground retail tenancy to flight
commercial tenants. An example of this being at 367 Collins Street
centre transacting for $14.05 million. The property was purchased
via building owner Mirvac who reactivated their ground floor lobby,
by a joint venture between Brookfield and ISPT reflecting a yield of
lower ground and entrances to engage with tenants in the building
2.80 per cent and $45,032/ sqm of land. Strong population growth in
and passing traffic as well as keeping up with the competitiveness
Melbourne coupled with continued strong tourism is forecasted to see
within the precinct. GPT will overhaul their lobby and create new
prime retail yields compress 60 basis points in the next 12 months.
retail opportunities at 530 Collins Street. Other commercial buildings
with planned major upgrades to their lobbies and foyers include 100
Queen Street, 35 Collins Street and 459 Collins Street as the new
wave of office supply is putting pressure on existing stock. These
upgrades all have a focus on maximising street activation and
improved retail opportunities as well as quality end-of-trip facilities.
Institutional landlords are identifying value by investing within their
retail assets to secure better office tenants at a higher rent and
maximising the return on investment due to currently strong retail
conditions in the CBD.
Across the Yarra River, Mirvac have also just completed
Southbank’s newest dining precinct with the opening of the
Riverside Quay project. As a result of the recently built and Riverside Quay, Southbank VIC
occupied Price Waterhouse Coopers building in Southbank, Leased on behalf of Mirvac
14Research &
Forecast Report
BRISBANE CBD & GOLD COAST
Retail | Second Half 2018
By Anneke Thompson
National Director | Research
anneke.thompson@colliers.com
Retail Sales - QLD (% change MoM)
MARKET HIGHLIGHTS 0.7% 0.65%
0.6%
Interstate migration reaches record highs 0.5%
0.4%
0.3%
Strong migration and tourist arrivals assisting retail trade 0.2%
0.05%
0.04%
growth 0.1%
0.0%
-0.1%
More investor demand than supply for Queensland -0.2%
-0.10%
-0.17% -0.21%
neighbourhood centres -0.3%
Food HH Goods Cloth & Foot Dept Store Other Caf & Rest
MoM % Growth QLD National
Source: Colliers International, ABS 3401
Economic recovery continues, migration and
Retail Sales - QLD (% change month on pcp)
tourism impacting retail demand 6.0%
4.87%
The second half of 2018, gross face rents have remained at 5.0%
4.0%
$7,375/sqm where they have been for the last twelve months and 2.53%
3.0%
are forecast to gradually increase to approximately $7,500/sqm 1.33%
2.0%
over the next 12 months. Buying and leasing activity has been 1.0%
0.53% 0.48%
moving towards the north and west ends of the city. Interest in 0.0%
the west has been driven by the upcoming opening of the Ritz -1.0%
-1.26%
Carlton at the West Side Place development in Spencer Street, the -2.0%
Food HH Goods Cloth & Foot Dept Store Other Caf & Rest
luxurious St Regis Hotel near Southern Cross Station and the W
Annual growth % QLD National
Hotel along Collins Street in the western core. As these precincts
Source: Colliers International, ABS 3401
evolve, typically a five day a week trading area, trade will increase
throughout the week as it transforms from a working zone to a Short term visitor arrivals, 12 month rolling average
tourist hub. 20.0%
15.0%
The economic recovery in Queensland continues, as strong
interstate migration and improving tourism arrivals on the back of a 10.0%
weak Australian dollar continue to drive spending growth. Growth in
y-o -y change
5.0%
short term visitor arrivals to Queensland has expanded throughout 0.0%
2018. On a rolling average measure, Queensland short term visitor
-5.0%
arrivals in August 2018 were up by 6.7 per cent year on year.
-10.0%
Retail trade results for the state are mixed. The ‘café and restaurant’
Aug-2009
Aug-2010
Aug-2012
Aug-2014
Aug-2016
Aug-2018
Aug-2015
Aug-2013
Feb-2010
Feb-2012
Aug-2017
Feb-2014
Feb-2016
Feb-2018
Feb-2015
Feb-2013
Feb-2017
Aug-2011
Feb-2011
sector was the strongest growth sub-category in the ABS’ August
Retail trade update, increasing trade by 0.65 per cent, although over NSW VIC QLD SA WA
an annual timeframe, this category has actually been in decline. Source: Colliers International, ABS 3401
Retail | Research & Forecast Report | Second Half 2018 15This suggests that the café and restaurant industry is in the early Transactions market
stages of a turnaround, and coming in to the summer and holiday
The major transaction to complete over the 6 months to Q3 2018
months, we expect that trend to continue.
was the sale of Soul Boardwalk. The shopping centre at the base
Similar to other states, the apparel and department store sectors of Soul Tower transacted in June 2018 for $90 million on a 7.42
continue to be challenged. The weak Australian dollar is unlikely to per cent capitalisation rate. A private investor from Macau was the
help trade in these sectors in the short term, as imported goods are purchaser. Soul Boardwalk is a circa 7,000sqm three level strata
likely to experience price rises over the coming months. retail complex, located in front of Surfers Paradise beach.
Market remains challenging but landlord Also changing hands on the Gold Coast was Miami One
flexibility the key to deals Shopping Centre, which sold in October 2018 for $31.887 million.
Gross face rents continue to edge down in the Brisbane CBD, as The neighbourhood shopping centre is anchored by a Coles
challenged trade conditions continue to impact most non-food supermarket, and includes 29 specialty stores and 2-5 basement
retailing categories that traditionally occupy CBD core markets. On carparks. The total area for the centre is 4,669sqm. The centre was
an annual basis, gross face rents in the Brisbane CBD are down by 96 per cent occupied at the time of purchase and transacted on a
11.2 per cent, to average $4,175 per sqm, although as with all CBD 6.4 per cent initial yield to the listed SCA Property Group. Private
retail markets, there is a wide spread between rents. Our rental investor Hambros was the vendor. Hambros purchased the asset
range is recorded between $1,600 and $6,750 per sqm. On a more for circa $14 million in 2012.
positive note, vacancy in both the residential and office markets Demand for neighbourhood centres from all purchaser categories
in the Brisbane CBD are trending downwards. This means more continues to be good, and is outstripping supply. Supply of
consumers both living and working in the CBD, and should have an neighbourhood centres for purchased has reduced as fewer
impact on non-discretionary trading sectors over the longer term. developments have completed – a traditional source of supply in the
Prime grade retail space continues to perform better than Queensland market, particularly in the new residential subdivisions
secondary space, and similar to the trend that Sydney and in Brisbane and the Gold Coast. As developers are finding it
Melbourne have experienced over the last three years, high end harder to lease the specialty components of these centres, fewer
retailers are looking to position themselves in the best space in developments are getting out of feasibility stage. This means that
Brisbane’s CBD. neighbourhoods that do come up for sale in Queensland are still
being met with solid demand from buyers.
Post Office Square, Brisbane QLD
Leased on behalf of LaSalle
16Research &
Forecast Report
ADELAIDE
Retail | Second Half 2018
By Kate Gray
Director | Research
kate.gray@colliers.com
Retail Sales (% change month on pcp)
MARKET HIGHLIGHTS 15.0%
Retail sales continue to improve 10.0%
5.0%
Kaufland to open first store in adelaide 0.0%
-5.0%
H&m to open in rundle mall
-10.0%
Food HH Goods Cloth & Foot Dept Store Other Caf & Rest
YoY % Growth SA National
Retail sales improve Source: ABS
Retail sales in South Australia have rebound and have seen a SA Retail Sales (% change month on pcp)
period of above national average growth over the last 12 months. 7%
6%
The annual growth rate in SA was 4.7 per cent in August 2018 5%
compared to the national average of 3.68 per cent. South Australia 4%
has now overtaken NSW There has been strong growth in Food, 3%
2%
Household Goods and Café and Restaurants over the last year. 1%
Department stores have started to reverse the trend of Clothing and 0%
footwear sales continue to lag with an annual fall of 6.9 percent. -1%
-2%
Kaufland and Aldi active 41487 41671 41852 42036 42217 42401 42583 42767 42948 43132 43313
SA National retail sales
Kaufland have been active in the Adelaide market after their first
Source: ABS
purchase of the Lecornu site in Forestville last year. There are
plans for Prospect, Munno Para and negotiations on several other
sites. We understand that a site for Wynn vale has fallen through
Rundle Mall Redevelopments
and Munno Para is likely to be delayed. The plan is for a 20,000 Rundle Mall has several major redevelopments underway. The first
sqm store at Forestville which is due to open in 2019. The entry is the redevelopment of Rundle Mall Plaza which will be the home
of Kaufland will add further competition to the Adelaide grocery to H&M which is a full line format store including clothing and H&M
market. Kaufland is part of the German based Schwarz Group Home. There is also the redevelopment of Citi Centre, which has
which also owns the Lidl supermarket brand. Adelaide has a seen the food court and several retailers close to make way for a new
traditionally strong independent grocery market through the IGA Romeos supermarket. The focus will be on fresh food and higher end
and Foodland brands, and Costco and Aldi are only relatively new prepared food. H&M is due to open on the 2 November ahead of the
entrants to the market. Both Aldi and Costco are much more Christmas trading period. Romeos is expected to open in February
established in the East Coast markets. Aldi is also continuing its 2019. Betty Burgers & Concrete Co have taken space on Rundle
expansion in Adelaide and expect to have up to 50 stores long term Street and are expected to open before Christmas. This is the first
adding further competition to the grocery market. Betty Burgers store in Adelaide with 11 restaurants nation-wide.
Retail | Research & Forecast Report | Second Half 2018 17Rundle Mall rents come under pressure Large new developments planned
Rents along Rundle Mall have fallen by 5.4 percent with the falls There are several large new retail developments in planning stages.
being at the top end of the rental range. The Current band for rents Kings Junction located at Salisbury South, which over several
on Rundle Mall are in the range of $1,800/sqm to $3,500/sqm. This stages is expected to span 75,000 sqm and is being developed
has fallen from $3,800sqm at the top end over the last 12 months. by GIC Australia a local developer. The first stage is in prelease
Incentives have remained stable at 20 per cent of a lease. We with major anchor tenants under negotiation now. This project is
expected vacancy to increase slightly as space is added through expected to complete in 2020 with construction commencing early
the Rundle Plaza redevelopment, and therefore it is likely that rents next year.
and incentives will remain steady over the next 12 months. Overall
Burnside Village is also investigating the opportunities around a
rents across all shopping centres have come under pressure with
future extension to extend the centre with entertainment, dining and
subregional centres seeing the largest falls of 11.1 percent across
more specialty stores. This project is currently in prelease stages
the year.
with no firm construction timeline. Westfield Marion has been
Sales activity earmarked for several years for a major redevelopment, with the
most recent announcement being the expansion of the cinema and
There was only one sale in Rundle Mall which is 101-109 Rundle
restaurant precinct.
Mall which is currently occupied by Connor. This sold for $9.2
million to the Duke group in January. Across Adelaide we have Port Canal Shopping centre is undergoing a $30 million
seen a 50 percent share of Churchill sell ICAM for $44.5 million. redevelopment which commenced in April this year. This will see
Greenacres shopping centre has sold for $10.5 million to PPI Funds the centre expand by 9,163 sqm and includes a new mini major, new
for a yield of 7.3 percent. Gawler Park homemaker centre has also specialties, 24-hour gym, medical centre and a child care centre.
sold for $25 million to a private investor. This project is due to complete in 2020.
Tea Tree Plaza has also undergone a refurbishment to create a new
dining precinct. This opened in late October 2018.
The Grove Shopping Centre, Golden Grove SA
Leased on behalf of Challenger
18Research &
Forecast Report
PERTH
Retail | Second Half 2018
By Quyen Quach
Senior Research Analyst | Research
quyen.quach@colliers.com
Perth Metropolitan Retail Space Supply
MARKET HIGHLIGHTS (Excluding Bulky Goods)
180,000
Perth CBD retail conditions expected to improve alongside CBD Forecast
160,000
worker population numbers 140,000
120,000
Total Area (m 2 )
‘Food’ the only category that’s showing consistent growth 100,000
80,000
60,000
Strong level of investment activity to improve centre offerings
40,000
and attract higher footfall
20,000
0
2006 2007 2008 2009 2010 2011 2012 2013 2014 2015 2016 2017 2018 2019 2020 2021
Current retail market conditions Source: Colliers Edge
The light at the end of the tunnel is starting to appear in the
Perth CBD retail scene. Severely impacted by the decline in CBD Perth CBD Average Retail Yields
employment, that began in 2012-13, Perth CBD retailers may start 9%
to see some improvement in trading conditions over the next 12 8%
months alongside the anticipated rise in CBD office occupancy
levels. The continued migration of suburban and fringe office 7%
tenants into the CBD, in combination with a gradual recovery in 6%
the resources sector, is expected to consolidate the CBD retailers’
customer base, and this is emerging just in time. 5%
There has been a significant volume of capital expenditure in some 4%
of Perth’s major CBD retail assets. Charter Hall is spending $200 3%
million repositioning its Raine Square asset which includes a re-
Mar-09
Sep-08
Sep-09
Mar-10
Mar-12
Mar-14
Mar-16
Mar-18
Mar-15
Sep-10
Mar-13
Sep-12
Sep-14
Mar-17
Sep-16
Sep-18
Sep-15
Sep-13
Sep-17
Mar-11
Sep-11
opening of the Coles supermarket and new retail attractions, such
as a Rebel Sports and a 12-screen cinema to complement its new Source: Colliers Edge
dining precinct. Stage one is complete and opened in September.
ISPT is also well advanced in its $110 million revamp of Forrest
Notwithstanding the improving outlook for the CBD retail scene,
Chase with stage one expected to begin trading before Christmas
general trading conditions across WA remained weak. According
2018 and the remaining three stages to be completed in 2019.
to the Australian Bureau of Statistics, nominal seasonally adjusted
The $6.5 million upgrade of Plaza Arcade was completed in August retail turnover declined 0.35 per cent year-on-year in June 2018
and re-opened alongside the launch of Perth’s first Uniqlo store, quarter. This was only the second time financial year retail data
which now occupies a two-storey tenancy at Plaza Arcade’s Murray returned a negative reading since 1983; the previous time was in
Street entrance. the year ending June 2001.
Retail | Research & Forecast Report | Second Half 2018 19The weak WA residential building sector, in combination with In 2019, 109,145sqm of space is scheduled to be added, with the
low established dwelling transactions, has continued to impact vast majority (70,910sqm) in the expansion of regional centres.
household goods turnover. Household goods turnover contracted A further 18,610sqm will come from expansion of major regional
of 7.67 per cent year-on-year in the June 2018 quarter, an shopping centres.
acceleration on the 4.85 per cent contraction recorded in June
2017.
Investment Activity
The improved population growth will likely continue to buoy food So far in 2018, 13 major retail investment transactions were
retailing, which grew 1.4 per cent year-on-year in June 2018. This executed in Perth, totalling $378 million. This follows 13 transactions
increase in population, alongside a gradual economic recovery, valued at $406 million in 2017. With further transactions pending,
is likely to flow through to improving conditions in other sectors, it’s likely 2018 will be a stronger year.
particularly clothing and soft goods and cafes and restaurants. Neighbourhood centre transactions made up a significant $166
Demand for CBD retail space remained subdued during the year to million of the 2018 total while sub-regional centres accounted for
September 2018, as weak real retail turnover conditions persisted. $184 million. The most recent neighbourhood centre sales were
In general, CBD mall rents moderated 5.4 per cent over the year Kalamunda Central Shopping Centre ($41.5 million), Flinders Square
to September 2018 to average $3,245/sqm for spaces between in Yokine ($39.5 million) and Woolworths Aveley ($26.9 million). The
50sqm and 100sqm. Colliers is anticipating a stabilisation of CBD major sub-regional centre transactions were Warnbro Centre and
rents in 2019 as the economy and population growth further Currambine Central, which transacted for $92.9 million and $91.9
improves. million respectively.
Tech and the second hand economy The outlook
It’s a growing part of the economy and millennials are leading the Consumer and business confidence has lifted alongside the
charge. The tech sector is underpinning the rise with applications improving economic outlook, and the downturn in private sector
that are increasingly connecting people in a peer-to-peer investment appears to be bottoming. Improvements in commodity
environment. A recent report published by Gumtree – Gumtree prices have also led to a resurgence in new exploration and
Second Hand Economy Report 2018, estimates the Australian investment activity announcements. Although the recovery in
second hand economy is worth $34 billion, with 56 per cent of investment is certainly positive for WA’s economy and the labour
Australians having sold a second hand item in the past year. market, we don’t expect activity to bounce back to boom period
levels; rather, we expect a gradual improvement in these metrics.
Millennials were the biggest spenders averaging $2,721 per
person, with Baby Boomers second at $2,091 per person. Gumtree We expect trading conditions for Perth CBD retail to improve as
estimates that 88 per cent of those selling second hand items sold the office vacancy declines on-the-back of improving white collar
them online and 31 per cent of Australians had preferred to buy employment growth in the CBD and West Perth. In addition, the
home décor and furniture second hand. This could be a contributing recovery in economic conditions and overall employment across the
factor to lower household goods turnover in WA with some cost Perth metro area will likely assist a revival in retail turnover in WA
conscience buyers opting for quality second hand items instead of over the next couple of years.
new.
Facebook’s Marketplace app is also rising in popularity since its
relaunch in October 2016. Colliers believes Marketplace has been
a significant contributor to the growth in the second hand economy
by drawing in new participants through Facebook’s large user base.
This increase in second hand trading through online sites and social
media apps could impact future growth in durable goods retailing.
Retail supply update
There was 145,785sqm of retail space scheduled to be completed
in 2018. To date 116,110sqm has been completed (excluding large
format retail). The space added was mostly in major regional,
regional and sub-regional shopping centres with 47,110sqm,
24,780sqm and 56,595sqm added respectively. Currently
1,675sqm of retail space is under construction and due to be The Village, Australind WA
completed in Q4 2018. Sold on behalf of private syndicator
20You can also read