Retail sector in the UK - BRIEFING PAPER - UK Parliament
←
→
Page content transcription
If your browser does not render page correctly, please read the page content below
BRIEFING PAPER
        Number SN06186, 25 May 2021

        Retail sector in the UK                                                         By Georgina Hutton

                                                                                        Contents:
                                                                                        1. The retail sector in the UK:
                                                                                           definition and statistics
                                                                                        2. Retail sales in Great Britain
                                                                                        3. Pressures on the retail sector

www.parliament.uk/commons-library | intranet.parliament.uk/commons-library | papers@parliament.uk | @commonslibrary
2 Retail sector in the UK
Contents
Summary 3
1. The retail sector in the UK: definition and statistics 5
1.1 Definition of the retail sector 5
1.2 Economic contribution of the retail sector 5
1.3 Employment 6
1.4 Businesses 7
2. Retail sales in Great Britain 9
Coronavirus pandemic: impact on sales 10
3. Pressures on the retail sector 12
3.1 Coronavirus pandemic 12
3.2 Internet retailing 13
3.3 Shop closures 15
Empty shops 16
3.4 Changing consumer behaviour 19
3.5 Changing supermarket environment 22
3.6 Economic factors 20
Contributing Authors: Chris Rhodes
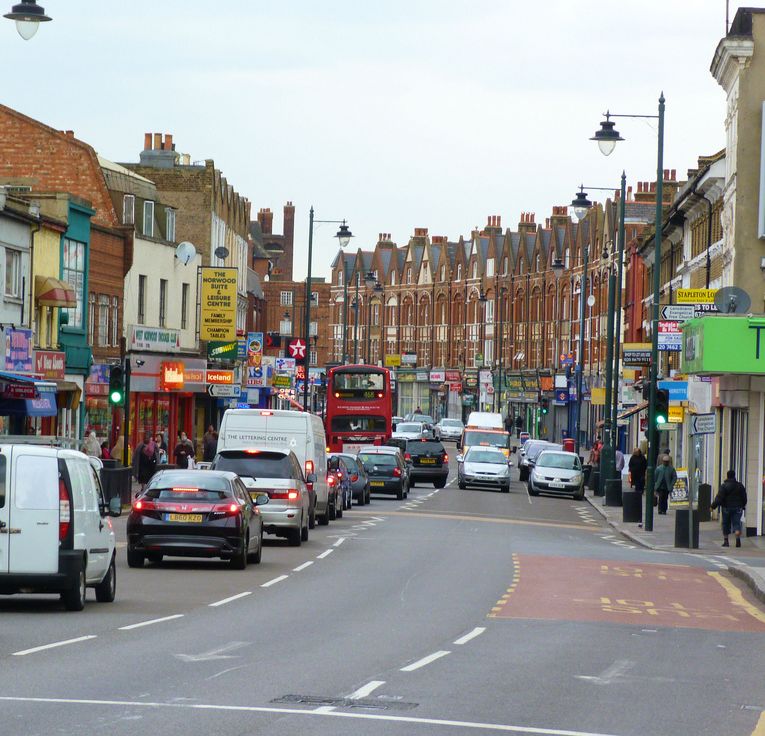
Cover page image copyright High Street Again by Duncan Brown (Cradlehall).
Licensed under CC BY 2.0 / image cropped.3 Commons Library Briefing, 25 May 2021
Summary
The retail sector is going through a prolonged period of upheaval. Factors such as
changing consumer behaviour, increased internet shopping and challenging economic
conditions are changing the way retailers operate and engage with their customers. The
coronavirus pandemic has added to these challenges accelerating trends such as increased
online shopping and adding economic challenges through lockdown restrictions.
This briefing paper describes the current state of the retail sector in the UK using data and
recent reports on the industry. Sometimes due to data availability, data refers to Great
Britain only. This briefing covers the retail sector only (not the wholesale sector) and does
not provide information on government policy in the retail sector.
Key figures
• Retail sector economic output was £97.0 billion in 2020, 5.2% of the UK’s total
economic output and a 2.5% fall on 2019.
• There were 3.0 million jobs in the retail sector in 2019.
• There were 310,000 retail businesses as of 1 January 2020
In 2020, retail sales in the Great Britain were worth £437 billion, down 0.6% on 2019. For
every pound spent in 2020:
• 41 pence was spent in food shops – a 7% rise on 2019
• 9 pence was spent in clothing shops (including textiles and footwear) – a 25% fall
on 2019
• 8 pence was spent on automotive fuel – a 25% fall on 2019
• 8 pence was spent in household goods shops (including electronics and furniture
stores) – a 1% rise on 2019
Impact of the pandemic on retail sales
At the onset of the Covid-19 pandemic in March 2020, retail sales fell dramatically as
lockdown restrictions closed non-essential retail stores. Retail sales as a whole recovered
to pre-pandemic levels by June 2020 before falling slightly again as non-essential retail
closed over the winter. Sales recovered strongly in April 2021 with the reopening of non-
essential retail.
Different types of retail stores have had very different experiences during the pandemic,
with sales in clothing stores and fuel seeing the most significant falls during 2020.
Internet sales
Internet sales have been rising since 2008 (when ONS data began) reaching around 20%
of all retail sales in Great Britain in 2019. Online sales rose sharply at the onset of the
pandemic as physical stores were closed and have remained over 28% of all sales since.
Store closures
In 2020, 54 retail companies with multiple stores ceased trading, affecting 5,214 stores
and 109,407 jobs according to the Centre for Retail Research (note that this should not be
interpreted to mean that this many jobs have been lost). This is the highest number of
store closures since 2008 and 2009 following the financial crisis.4 Retail sector in the UK
The Local Data Company found that 15% of retail premises in Great Britain were vacant
in the second half of 2020, up from 13% in the second half of 2019. This was the biggest
rise in store vacancies since 2013.5 Commons Library Briefing, 25 May 2021
1. The retail sector in the UK:
definition and statistics
1.1 Definition of the retail sector
The retail sector includes any business or individual involved with selling
products directly to consumers. The retail sector includes shops,
department stores, supermarkets, market stalls, door-to-door sales
people and internet retailers.
Related sectors include the wholesale sector (which supplies retailers),
the logistics sector (which connects wholesalers and producers with
retailers), and the manufacturing sector (which produces the products
sold by retailers). This briefing paper focuses on the retail sector only. 1
Retail stores are an important part of high streets and town centres.
However, it is important to note that the retail industry is broader than
just sales on the high street. The statistics in this briefing represent the
whole retail sector including in shopping centres, retail parks and online
sales.
For further discussion about high streets, see our briefing: Town centre
regeneration (21 May 2021).
1.2 Economic contribution of the retail sector
Summary:
• Retail sector economic output was £97.0 billion in 2020, 5.0% of
the UK’s total economic output and a 2.5% fall on 2019.2
• There were 3.0 million jobs in the retail sector in 2019.3
• There were 310,000 retail businesses as of 1 January 2020.4
Economic output
The economic output of the retail sector in 2020 was £97.0 billion,
which was 5.2% of the UK’s total economic output. 5
Retail sector economic output fell by 2.5% in 2020 compared to 2019
following the impact of the coronavirus pandemic.
The economic output of the sector returned to pre-pandemic levels by
the end of 2020. Output fell again in the first quarter (Q1) of 2021 to
1
The retail sector is defined as Standard Industrial Classification (SIC) code 47:
businesses engaged in the sale without transformation of new and used goods
mainly to the general public for personal or household consumption or utilisation.
2
In terms of Gross Value Added (GVA). ONS, GDP low level aggregates data, 31
March 2021 (Gross value added, current prices, series KK7F, KKP5)
3
ONS and NISRA, Business register and employment survey, 2019
4
Businesses: BEIS, Business population estimates 2020 (data as of 1 January 2020).
5
In terms of Gross Value Added (GVA). GVA is a measure of economic activity similar
to GDP. Briefly, GVA is the contribution of part of the economy, minus costs
incurred in production. Source: ONS, GDP low level aggregates data, March 2021
(Gross value added, current prices, KK7F).6 Retail sector in the UK
2.8% below Q1 2019. The pandemic however has had very different
impacts across different types of retail stores – discussed further in
section 2.
Retail sector economic output
% change in GVA on previous year, quarterly data, UK
10%
Retail
5% sector
0%
-5%
-10%
-15%
Whole
economy
-20%
-25%
2006 2008 2010 2012 2014 2016 2018 2020
Source: ONS, GDP Output approach – low level aggregates, 31 March 2021,
retrieved 6 May 2021. Series: KLA8, KL74
Over the past ten years, the retail sector’s economic output has largely
followed a similar path to the whole economy.
The retail sector saw a fall in economic output and then weak growth
following the financial crisis and subsequent recession of 2008, until
late 2012. In 2013, the sector began to recover and grew strongly from
2014 until late 2016.
1.3 Employment
Employment in the retail sector in the UK was around 3.0 million in
2019, 9.3% of the UK total. This was a fall of 11,100 (0.4%) compared
to 2018 (over the same period, total employment in the UK grew by
1%). 6
Employment in the retail sector is fairly evenly distributed across most
regions and countries of the UK, shown in the following chart.
London had the lowest proportion of retail employment in 2019 (7.5%
of jobs in London were in retail) and Northern Ireland had the highest
(11.5%). The South West and North East also had around 11% of
employment in retail.
6
ONS, Business register and employment survey, 2019, UK data tables.7 Commons Library Briefing, 25 May 2021
Retail employment in the UK
% of total region/country employment, 2019
London 7.5%
West Midlands 8.6%
Scotland 9.0%
East 9.1%
UK 9.3%
East Midlands 9.3%
Wales 9.5%
South East 9.7%
Yorks & Humber 9.8%
North West 9.9%
South West 10.6%
North East 10.7%
Northern Ireland 11.5%
Note: Employment estimates includes employees and self-employed workers
registered for PAYE or VAT. Northern Ireland includes only employee jobs.
Source: ONS and NISRA, Business register and employment survey: 2019,
accessed 6 May 2021.
Impact of the pandemic on retail employment
According to the Centre for Retail Research, an academic-led research
institute, 109,407 retail jobs could be affected by retail companies
going into administration in 2020.7 This figure is higher than the Centre
reported for 2008 following the financial crisis. The Guardian also kept
track of job losses announced across a number of high street brands
during the course of 2020, the largest being 13,000 redundancies
across Arcadia (brands such as Top Shop, Dorothy Perkins and Miss
Selfidge) and 12,000 redundancies at Debenhams. 8
As of 31 March 2021, 536,300 retail jobs were on furlough under the
Coronavirus Job Retention Scheme, which makes 19% of eligible jobs in
the sector. 9 Over half of these (56%) were in ‘other specialised stores’
which includes clothing and footwear stores.
1.4 Businesses
There were 310,120 retail businesses in UK retail sector as of 1 January
2020, 5.2% of all businesses.10
7
Centre for Retail Research, Who’s gone bust?, accessed 25 May2021.. Note that
some of the business that went into receivership may have recovered, been sold as
going concerns but changed their name, or ceased to exist. Therefore, these figures
should be used cautiously.
8
Antonio Voce, Ashley Kirk and Richard Partington, UK coronavirus job losses: the
latest data on redundancies and furloughs, The Guardian, last updated 1 December
2020, accessed 6 April 2021.
9
HMRC, Coronavirus Job Retention Scheme Statistics: 6 May 2021, accessed 18 May
2021.
10
BEIS, Business population estimates, 2020, Table 68 Retail sector in the UK
In common with most other sectors in the economy, small and medium
sized enterprises (SMEs) made up over 99% of retail businesses.
However, the retail sector and the whole economy had differing
proportions of businesses in other business size categories.
• 59% of businesses in the retail sector had 0 employees (single
person-led business), compared with 76% in the economy as a
whole.
• 35% of businesses in the retail sector had between 1 and 10
employees, compared with 19% in the whole economy
• 6% of retail businesses had between 10 and 100 employees,
compared with 4% of all businesses.
Businesses by size
% businesses in retail sector and whole economy by size, UK, 2020
59%
0 employees
76%
1-9 35%
employees
19%
10-99 6%
employees
4%
Retail sector
100+9 Commons Library Briefing, 25 May 2021
2. Retail sales in Great Britain
In 2020, retail sales in the Great Britain were worth £437 billion, down
0.6% on 2019. For every pound spent in 2020:
• 41 pence was spent in food shops – a 7% rise on 2019
• 9 pence was spent in clothing shops (including textiles and
footwear) – a 25% fall on 2019
• 8 pence was spent on automotive fuel – a 25% fall on 2019
• 8 pence was spent in household goods shops (including
electronics and furniture stores) – a 1% rise on 2019
The remainder was spent in other types of shops, non-specialist shops,
or in non-store retailing, such as market stores, catalogues and online-
only retailers. 11
Prior to the coronavirus pandemic, the volume of retail sales had been
increasing year-on-year since 2013. This followed a period of stalled
growth in sales following the financial crisis, between 2008 and 2013.
The following chart shows how the volume of retail sales has changed
over the last two decades (that is, sales adjusted for inflation). 12 Only
rarely have retail sales fallen in volume terms compared to the previous
year since 1997. Average growth in rolling three month periods
compared to the previous year was 2.0% between 1997 and 2021.
Retail sales have increased steadily since 2013
Volume of sales, index 2018=100
Seasonally adjusted, Great Britain
110
100
90
80
70
60
50
1997 1999 2001 2003 2005 2007 2009 2011 2013 2015 2017 2019 2021
Source: ONS, series J5EK.
11
ONS, Retail sales, pounds data, value, seasonally adjusted data.
12
ONS, All retail sales including fuel, volume, seasonally adjusted, series J5EK and
J5EH.10 Retail sector in the UK
Coronavirus pandemic: impact on sales
At the onset of the Covid-19 pandemic in March 2020, retail sales fell
dramatically as lockdown restrictions closed non-essential retail stores.
Retail sales as a whole recovered to pre-pandemic levels by June 2020 –
relatively quickly compared to other sectors such as hospitality and
entertainment. 13 Sales fell again in January and February 2021 when
non-essential retail shut again, however the fall was much less
significant than early 2020, suggesting that retailers and consumers had
adapted to restrictions.
Although retail sales overall have broadly returned to pre-pandemic
levels, there has been a big difference between the impact on different
store types, shown in the chart below.
Clothing stores have been the hardest hit by the pandemic
Volume of sales, seasonally adjusted, Great Britain
Index, February 2020 = 100
120
100
80
60
40
20
0
Feb Mar Apr May Jun Jul Aug Sep Oct Nov Dec Jan Feb Mar Apr
Notes: all retail includes sale of fuel.
Source: ONS, Retail Sales Index, Series J5EK, EAPT, EAPX, EAPY, J5DZ, accessed 21 May
2021.
Food stores have maintained a steady level of sales throughout the
pandemic, with sales increasing during lockdown periods as consumers
relied on groceries rather than eating out, for example. Household
goods stores saw sales increase above pre-pandemic levels during the
summer of 2020, thought to be driven by sales of DIY products for
home improvements. 14 Clothing stores have been the hardest hit during
the pandemic. Sales in clothing stores remained below pre-pandemic
levels throughout 2020 and early 2021. Sales in clothing stores
recovered to pre-pandemic levels in April 2021, following strong growth
as non-essential retail re-opened that month.
13
See Commons Library briefing Coronavirus: economic impact, section 3.5 (CBP
8866, 9 April 2021).
14
ONS, Retail Sales Bulletin: February 2021, Section 4, 26 March 2021.11 Commons Library Briefing, 25 May 2021
Chief executive of the British Retail Consortium, Helen Dickinson said
that fashion sales in knit and outerwear were particularly strong in April
as customers prepared to meet friends and family outdoors. 15 She said
that although April sales were strong and a “step in the right direction”
demand remained fragile with footfall in stores still below pre-pandemic
levels and staff remaining on furlough (see section 1.3). 16
Non-store and online sales
Non-store sales increased rapidly at the onset of the pandemic and have
remained high ever since: as of April 2021, non-store sales were 53%
above pre-pandemic levels. Non-store sales mean retail without a
physical store presence; 82% of this category is online-only retail and
the remainder market stalls, catalogue-order retail, pop-up stores etc.
Similarly, the proportion of all retail sales happening online increased
significantly in March 2020, shown in the chart below. These figures
include all online retail sales including for retailers with physical stores,
such as online supermarket orders for example. Internet sales have been
above 28% of all sales since April 2020, up from 20% before the
pandemic. February 2021 saw a record high for internet sales, forming
36% of all retail sales. Online sales fell as a proportion of all retail in
April 2021 but remained high at 29% of all retail sales even as non-
essential stores opened. Online retail is discussed further in section 3.2
of this briefing.
Internet sales as a proportion of all retail sales
%, seasonally adjusted, Great Britain
40
35
30
25
20
15
10
5
0
2008 2010 2012 2014 2016 2018 2020
Source: ONS, series MS6Y (all sales excluding fuel) retrieved 24 May 2021
15
BRC, Retail on the long road to recovery, 21 May 2021, accessed 24 May 2021.
16
BRC, Retail on the long road to recovery, 21 May 2021, accessed 24 May 2021.12 Retail sector in the UK
3. Pressures on the retail sector
The retail sector has changed radically in recent years. Factors driving
these changes include internet retailing, store closures and other
changes on the high street, and an increasing consumer preference for
large multi-purpose malls.
This section includes a discussion of challenges facing the retail sector.
For a discussion of wider challenges facing high streets and town
centres, including on business rates, see the Commons Library briefing:
Town centre regeneration (21 May 2021).
3.1 Coronavirus pandemic
The coronavirus pandemic has caused huge challenges for the retail
industry. Section 2 covers the impact of the pandemic on sales, showing
the different experiences of different retail sectors during the pandemic
and section 3.3 below covers store closures.
Even stores that have seen sales remain strong or increase, such as food
stores, have had new challenges due to social distancing requirements
and the costs of implementing Covid-secure measures. The sector has
benefited from a number of Government financial support schemes
during the pandemic (Box 1).
Box 1: Support for the retail sector during the pandemic
The retail sector has benefited from Government support schemes during the pandemic, including:
• Coronavirus Job Retention Scheme (CJRS): up to 31 March 2021, employers in the wholesale and
retail sector had claimed £11.27 billion under the (CJRS). 17
• Government-backed business loans: wholesale and retail sector businesses were offered loans
worth £10.95 billion in total, 18% of the total loaned across all sectors. Wholesale and retail
businesses represent 9% of the total business population.18
• Business rates relief: retail businesses in England received 100% business rates relief in 2020/21.
The business rates holiday will continue to 30 June 2021 and will then be replaced with 66%
relief from 1 July to 31 March 2022 (with a cap depending on whether the business could open
during the winter lockdown). 19 The devolved administrations also have business rates relief
schemes. 20
• A series of small business grants. As one example, in 2021/22 in England, qualifying non-
essential retail businesses may receive restart grants up to £6,000 per premises. 21 The devolved
administrations have separate grant schemes. 22
For a summary of all Government support schemes, see our briefing, Coronavirus: economic impact
(section 4.3).
17
Including sales of motor vehicles; figure provisional for claims made in March.
Source: HRMC, Coronavirus Job Retention Scheme statistics: 6 May 2021. See
further, Library briefing, Coronavirus job retention scheme: statistics.
18
British Business Bank, 18 January 2021. For comparison to other sectors, see Library
briefing, Coronavirus business support schemes: statistics (section 7).
19
Gov.uk Business rates relief [accessed 25 May 2021]
20
See: Scottish Government, Coronavirus in Scotland; Welsh Government, Business
and employers: coronavirus; NI Direct, Coronavirus (COVID-19): Support for
businesses.
21
Gov.uk, Check if you're eligible for a coronavirus Restart Grant (grants available
from 1 April 2021), 19 March 2021
22
See footnote 17 above.13 Commons Library Briefing, 25 May 2021
The pandemic has also accelerated some pre-existing trends and
challenges facing the retail sector discussed further in this section, such
as increased online shopping.
New challenges and opportunities have also emerged due to new
behaviours during the lockdown, such as from increased home working
and restrictions on travel. For example, the Local Data Company, PwC
and others suggested a trend towards local shopping emerged during
the pandemic, with local stores and smaller villages/towns seeing better
footfall performance compared to city centres (see section 1.4 of our
briefing, Town centre regeneration for further discussion).
Chief executive of the British Retail Consortium, Helen Dickinson said
that although April 2021 sales were strong, consumer demand and the
continued recovery of the sector remained fragile.23 She described
pointed to facing the sector going forward, in particular the end of
business rates relief (see Box 1).
Another major concern facing the sector following the pandemic is
accumulated rent debt. 24 The Government introduced a moratorium on
evictions due to non-payment of rent for business tenancies (in England)
that is due to expire on 30 June 2021.25 Section 11 of the Commons
Library briefing Coronavirus: Support for businesses provides further
information.
3.2 Internet retailing
Shopping on the internet has become increasingly popular and this is
transforming the retail sector.
As shown in section 2 above, online retail sales have increased from
around 5% of all retail sales in 2008 (when the ONS data series began)
to around 20% in 2019. At the onset of the coronavirus pandemic,
online sales have increased to over 28% since March 2020.
The popularity of buying goods via the internet varies by type of shop,
shown in the chart below. Department stores and clothing stores have a
higher proportion of online sales compared to food stores.
All store types saw big increases in online orders in 2020. The
proportions of internet sales had been previously increasing year-on-
year to 2020 but to a smaller degree.
Michael Saunders, a member of the Bank of England’s Monetary Policy
Committee reported that small retailers (with employment less than 100
people) have a relatively high market share in online sales and have seen
a larger increase in online sales compared to larger retailers, at 17.4%
year-on-year growth in Q4 2020 compared to 1.7% growth for larger
retailers. 26
23
BRC, Retail on the long road to recovery, 21 May 2021, accessed 24 May 2021.
24
UK retailers set out plan to tackle £3bn in rent arrears, Jonathan Eley and George
Hammond, Financial Times [subs only], 6 May 2021, [accessed 24 May 2021].
25
MHCLG, Further support for commercial and residential tenants, 10 March 2021
26
Speech by Michael Saunders, External Member of Bank of England Monetary Policy
Committee, Supply and demand during and after the pandemic (PDF), 26 March
2021, page 9.14 Retail sector in the UK
Online sales increased in all sectors in 2020
Online sales as a % of all sales by sector, Great Britain
40%
2018 2019 2020
30%
20%
10%
0%
All retail Mainly food Department Clothing Household Other non-
stores stores stores stores food
Notes: includes sales for stores with a physical presence only. Non-store sales
such as in online-only retailers are not shown.
Department stores includes all non-specialised non-food stores.
Source: ONS, Retail sales index: Internet sales, accessed 10 May 2021.
Internet retailing is more popular in the UK than other European
countries, shown in the chart below.27 In the UK 90% of residents made
at least one online purchase in 2020. Denmark, the Netherlands,
Norway, Sweden, Germany and Iceland also had over 80% of residents
making online sales in 2020.
% of residents who made online purchases in last 12 months
2020
100%
90%
80%
70%
60%
50%
40%
30%
20%
10%
0%
Norway
France
Spain
Cyprus
Slovakia
Lithuania
Italy
Romania
Latvia
Luxembourg
Estonia
Switzerland
UK
Sweden
Germany
Denmark
Malta
Slovenia
Greece
Iceland
Finland
Ireland
Austria
Croatia
Belgium
Hungary
Bulgaria
Portugal
Netherlands
Poland
Source: Eurostat, E-commerce statistics for individuals, 2020.
27
Eurostat, E-commerce statistics for individuals, 2020, accessed 10 May 2021.15 Commons Library Briefing, 25 May 2021
3.3 Shop closures
In 2020, 54 retail companies with multiple stores ceased trading,
affecting 5,214 stores and 109,407 jobs according to the Centre for
Retail Research. 28 This is the highest number of store closures reported
by the Centre since 2008 and 2009 following the financial crisis.
The Centre described the period 2020–2021 as “one of the worst
periods for bricks-and-mortar retailing since the 1970s”, predicting
further store closures and 200,000 job losses for the sector in 2021.29
Further information on the companies in administration is provided on
the Centre’s website. The Guardian also kept track of job losses
announced across a number high street brands during the course of
2020. 30
Stores affected by retail company failures
7,000
6,000
5,000
4,000
3,000
2,000
1,000
0
2007 2009 2011 2013 2015 2017 2019 2021
(to April)
Source: Centre for Retail Research, Who's gone bust in retail; *up to April 2021
Prior to the pandemic the sector was already experiencing challenges
from store closures. From 2008 to the end of 2019, the retail sector
with the most stores affected by company failures has been the clothing
sector, accounting for 27% of all stores affected. Off licences accounted
for 15% of stores affected. Footwear stores and DVD music and video
game rental stores each accounted for 12% of stores affected. 31
The Centre summarised the challenges in the retail sector leading to
store closures as follows:
28
Centre for Retail Research, Who’s gone bust?, accessed 11 May 2021. Note that
some of the business that went into receivership may have recovered, been sold as
going concerns but changed their name, or ceased to exist. Therefore, these figures
should be used cautiously. They should not be interpreted to mean that this many
jobs have been lost.
29
Retail Research Centre, The Crisis in Retailing: Closures and Job Losses, accessed 6
April 2021.
30
Antonio Voce, Ashley Kirk and Richard Partington, UK coronavirus job losses: the
latest data on redundancies and furloughs, The Guardian, last updated 1 December
2020, accessed 6 April 2021.
31
Centre for Retail Research, Who’s gone bust? – analysis, attached list of retail
failures, accessed 11 May 2021.16 Retail sector in the UK
• The high costs of running retail outlets, including rents,
business rates and high labour costs;
• Low profitability caused by high costs, slow growth in sales,
squeezed profit margins and heavy price competition;
• The rapid growth of online competition such that by 2018
online sales accounted for around 18.4% of total retail
merchandise sales, with much of online growth achieved at
the expense of bricks-and-mortar retailers.
• Lack of preparation: low investment in stores and weak
forward planning to meet the challenges of the new
retailing. 32
The Centre described the coronavirus lockdowns and ongoing social
distancing costs as “trumping all the above”.
Empty shops
The Local Data Company (LDC, a retail and leisure data company)
collects information on retail and leisure businesses in town centres in
Great Britain. The LDC reported that the rate of vacant retail units has
increased from 12% to 15% from 2018 to 2020.33
The year of 2020 saw the biggest increase in retail vacancies since 2013.
The Local Data Company has forecast that vacancy rates will continue to
rise in high streets, shopping centres and retail parks in 2021 as the full
impact of the pandemic has not yet been seen.34
15% of retail units were vacant in late 2020
Percent of total retail and leisure units vacant by location, Great Britain
16%
14%
12%
10%
8%
6%
4%
2%
0%
2013 2014 2015 2016 2017 2018 2019 2020
Source: Local Data Company, Retail and Leisure Analysis: Full year 2020 report, March
2021.
Vacancy rates vary considerably depending on the type of retail location.
Vacancy rates on high streets are close to the national average, however
32
Centre for Retail Research, The Crisis in Retailing: Closures and Job Losses, accessed
11 May 2021.
33
Retail and leisure units include restaurants, bars, hairdressers and personal care,
gyms and other leisure services and facilities. Local Data Company, Retail and Leisure
Analysis: Full year 2020 report, March 2021
34
Local Data Company, Retail and Leisure Analysis: Full year 2020 report, March 2021.17 Commons Library Briefing, 25 May 2021
vacancies in shopping centres are much higher and vacancies in retail
parks are much lower. 35
Retail parks have been the most resilient to store closures during the
pandemic, thought to be due to outdoor environments and accessibility
by car as well as a higher presence of essential retailers at these
locations. Shopping centres have been the most impacted by the
pandemic in terms of store closures, thought to be due to indoor
environments and low proportions of essential retail compared to retail
parks and high streets. 36 Shopping centres have the highest proportion
of long-term vacancies, with 5% of units vacant for more than three
years, compared to 4.2% on high streets and 1.9% in retail parks. 37
Vacancy rates by region
The following chart shows retail and leisure vacancies by region in 2019
and 2020 as reported by the Local Data Company. The chart includes
vacancies in shopping centres, high streets and retail parks. Leisure units
include restaurants, bars, gyms, hairdressers etc.
London had the lowest rate of vacancies, with 10% of retail and leisure
properties vacant in 2020. The North East had the highest proportion of
vacant units in 2020 (20%). Wales saw the biggest change in the
number of vacant units, with vacancy rates rising 2.6% between 2019–
2020.
Retail and leisure vacancy rates by region
2019 and 2020, Great Britain
Greater London 10% 2019 2020
South East 12%
Scotland 12%
East of England 13%
South West 14%
East Midlands 15%
West Midlands 16%
North West 17%
Yorks & The Humber 17%
Wales 19%
North East 20%
0% 5% 10% 15% 20%
Note: includes vacancies across all locations: high streets, shopping centres and retail
parks.
Source: Local Data Company, Retail and Leisure Analysis: Full year 2020 report, March
2021.
35
Local Data Company, Retail and Leisure Analysis: Full year 2020 report, March 2021.
36
Local Data Company, Retail and Leisure Analysis: Full year 2020 report, March 2021,
page 20. The LDC reported that on average, only 15.4% of units in shopping
centres are classified as ‘essential’ compared to 28.7% for retail parks and that
shopping centres have a higher proportion of comparison goods stores compared to
the average high street location.
37
Local Data Company, Retail and Leisure Analysis: Full year 2020 report, March 2021,
page 22.18 Retail sector in the UK
Vacancy rate by type of store: independent vs chain businesses
In terms of types of store, comparison goods stores (this means stores
selling fashion and household items for example, as opposed to
groceries and convenience stores) have consistently had far higher rates
of vacancies compared to other types of stores. 38
Chain stores (brands with more than 5 outlets) have had a consistently
higher vacancy rate than independent stores and have seen a higher
rate of closures during the pandemic, shown in the chart below. 39
The Local Data Company and PwC reported that in 2020, chain
businesses had a 29% fall in the number of occupied units (net loss of
9,877 units), driven largely by very low numbers of new openings. For
independents on the other hand, 2020 saw a slowing of store closures;
the number of occupied units increased by 5% in 2020, although still
representing a net loss of 1,422 units. 40 The LDC said this suggests that
the government support schemes (see Box 1) have been more effective
in supporting smaller businesses rather than larger chains, which have
moved to rationalise. 41
Net change in stores occupied
Store openings minus closures, Great Britain, 2014-2020
236 263
831
-126 -241 -1483 -1013
-601 -1521 -1442
-4010
-6537
-7648
Chain businesses
Independent businesses
-9877
2014 2015 2016 2017 2018 2019 2020
Source: Local Data Company, Retail and Leisure Analysis: Full year 2020 report, March
2021.
The LDC forecasts these trends to continue in 2021 as some high-profile
store closures announced in 2020 (such as the Debenhams and Arcadia
brands) are not captured in the figures. Neither are stores temporarily
38
Local Data Company, Retail and Leisure Analysis: Full year 2020 report, March 2021.
39
Local Data Company, Independent retail market remains resilient in 2020 due to
Governments support schemes, 24 March 2021, accessed 6 April 2021. PwC, Store
openings and closures – 2021, accessed 10 May 2021. Data is for retail and leisure
units.
40
Local Data Company, Independent retail market remains resilient in 2020 due to
Governments support schemes, 24 March 2021, accessed 6 April 2021. Figures are
for all locations (shopping centres, retail parks and high streets). Chain businesses
are those with 5 or more outlets.
41
Emma Simpson and Daniele Palumbo Pandemic impact 'yet to be felt' on High
Streets, , BBC News, 14 March 2021.19 Commons Library Briefing, 25 May 2021
closed during lockdown that may never reopen. That is, the full extent
of the impact of the pandemic on store closures is yet to be seen.
An interactive display of store openings and closures for chain
businesses by region is provided on the PwC website: store openings
and closures 2021.
3.4 Changing consumer behaviour
Physical shops, high streets and shopping centres have adapted to the
rise of internet retailing by changing the experiences and services that
they offer to customers. This can be seen in several broad trends.
Click and collect and omnichannel retailing has grown. Online
retailing has not resulted in a simple substitution of physical shopping
for online shopping, although this has happened to some extent.
Instead, successful physical stores have developed online services that
are complimentary to their physical presence. Modifications include
offering customers the option to browse goods in the store and then
order them online, or pick up goods they have bought online in physical
stores. 42
The growth of online retail following the pandemic is forcing retailers to
reconsider the value and purpose of their physical stores even further. 43
Commentators point to evidence that consumers are becoming less
brand-driven and more price-driven, with consumers not necessarily
sticking to their favoured brands when moving online.44 For example,
prior to the pandemic, John Lewis estimated that their physical stores
contributed around £6 of every £10 spent online; since the pandemic
that has been reassessed to on average around £3.45 Retailers are
increasingly moving towards shops that provide experiences and services
that cannot be sourced online (such as stylists, repairs, cafes) rather than
simply browsing space.46 Larger stores are moving to ‘inventory-less’
small-format stores. 47 For example, John Lewis is trialling featuring John
Lewis shopping areas in Waitrose stores and smaller, neighbourhood
shop formats.48
The increasing popularity of beauty or personal service shops further
highlights this trend, signalling the type of service that customers value
that is not found online. The Local Data Company reports that in 2017,
most retail sectors saw a net fall in the number of units across the
country. But barbers, beauty salons and nail bars all saw net increases in
the number of units.49 In 2020, barbers again saw the highest number
42
Wrigley N., and Lambiri D. (University of Southampton), British High Street: from
crisis to recovery: a comprehensive review of the evidence, 2015, p65
43
PwC, Retail & Consumer Briefing 2021 – Highlights, accessed 11 May 2021.
44
Why John Lewis tells us this retail crisis is just beginning, Helen Thomas Financial
Times, 17 March 2021 [accessed 11 May 2021].
45
John Lewis Partnership, Annual report and accounts 2021 (PDF), accessed 11 May
2021, page 12 and 34.
46
Centre for Retail Research, Store of the Future, accessed 11 May 2021.
47
How retail giants could thrive on the post-pandemic high street, Tamsin McLaren,
The Conversation, 17 March 2021 [accessed 11 May 2021]
48
John Lewis, John Lewis partnership plans not to reopen eight John Lewis shops from
lockdown as it rebalances store estate, 24 March 2021 [accessed 4 May 2021]
49
Local Data Company, Retail and leisure trends report H2 2017, May 2018, p520 Retail sector in the UK
of new openings for the 4th consecutive year despite the impact of the
pandemic. 50
Convenience stores also made the top 10 list of growing stores in 2020
(growth by net change in the number of units) after 4 years of decline,
reflecting local shopping behaviours during the pandemic and their
status as ‘essential’ stores. 51 Gyms also made the top-10 despite
pandemic closures, largely due to the number of independents in this
category and coinciding with a growing focus on health and
wellbeing.52
There has been growth in mixed use malls which include shops,
cinemas and food and drink outlets. It has been argued that consumers
should not be analysed in terms of discreet purchases, but rather by the
trip they make to the shopping area.53 This is because increasingly, what
attracts people to the town centre or shopping mall is no longer just the
shops (which have often been substituted by online vendors), but rather
the leisure facilities that they can access there, such as cafes,
restaurants, cinemas and children’s activities. 54 Shopping centres
however have been hardest hit during the pandemic in terms of store
vacancies (see section 3.3 above). 55
Retailers must also adapt to new consumer trends such as interest in
ethical and environmental sustainability of products and supply chains. 56
3.5 Economic factors
In the decade following the financial crisis of 2008/09, average earnings
have been subdued and disposable income has barely grown. These
factors have affected confidence in the retail sector and contributed to
some of the recent trends in retailing mentioned above.
For much of the past decade since the financial crisis, earnings growth
has been below inflation, leading to a long period of stagnating wages
in real terms. 57 In conjunction, household disposable income has also
grown far more slowly than in previous decades, shown in the chart
below. Household disposable income means income after tax; it
includes wages as well as other sources of household income such as
pensions and investment.
Between 1955 and 2007, the average annual growth in real disposable
household income per head was 2.6% a year. Between 2008 and 2011
50
Local Data Company, Retail and Leisure Analysis: Full year 2020 report, March 2021,
page 32.
51
The Library briefing, Town centre regeneration discusses trends in local shopping
further, see section 1.4.
52
Local Data Company, Retail and Leisure Analysis: Full year 2020 report, March 2021,
page 32.
53
Howard, E., New shopping centres: is leisure the answer?, International Journal of
Retail & Distribution Management, 2013
54
Deloitte, Passion for leisure: a view of the UK leisure consumer, 2017, p9
55
Local Data Company, Retail and Leisure Analysis: Full year 2020 report, March 2021,
page 19–20.
56
PwC, Retail & Consumer Briefing 2021 – Highlights, accessed 11 May 2021; Centre
for Retail Research, Ethical consumer, the Green Shopper, accessed 11 May 2021.
57
See: Library Insight, Slowing economic growth, Brexit and the productivity challenge,
15 January 2020; and Library Key Economic Indicator, Average Earnings.21 Commons Library Briefing, 25 May 2021
disposable income fell by 0.2%. Between 2012 and 2020 growth in
income recovered but at a slower rate (1.4% average annual growth). 58
Household disposable income per head
£, real terms
20,000
15,000
10,000
5,000
0
1960 1970 1980 1990 2000 2010 2020
Source: ONS, series CRXW. Reference year 2016, UK.
These factors have fed into weak consumer confidence, particularly in
the five years following the financial crisis. 59
Unsurprisingly consumer confidence fell at the onset of the pandemic in
March 2020. Confidence began to recover in early 2021 with the
vaccine programme accelerating and lockdown restrictions easing,
reaching pre-pandemic levels in May 2021.
Consumer confidence index
% balance expecting improvement/deterioration
20
10
0
-10
-20
-30
-40
-50
1988 1991 1994 1997 2000 2003 2006 2009 2012 2015 2018 2021
Source: GfK NOP consumer confidence survey, monthly data.
The pandemic has also led to accumulated household savings
(concentrated in higher income households) as spending on many
services has been restricted. 60 Together with rebounding consumer
58
ONS series, CRXW
59
GfK NOP, Consumer Confidence Index
60
See Commons Library briefing, Coronavirus: Impact on household savings and debt,
13 January 2021.22 Retail sector in the UK
confidence this has supported optimism that consumer spending may
recover strongly in 2021.61 Commons Library briefing Coronavirus:
economic impact (section 3.5) provides further discussion.
3.6 Changing supermarket environment
Supermarkets are a fundamental component of the retail landscape in
the UK. They are where many people buy their food and other essential
items, they are innovative businesses that have transformed the retail
environment and, in some cases, they are also significant global brands.
But their role and position in the retail landscape has changed in recent
years.
The decade to 2012 was a period of rapid expansion for the big four
supermarkets (Tesco, Sainsbury, Asda and Morrison). These stores’
market share in groceries grew from around two thirds in 2000 to over
three quarters in 2011. This growth was accompanied by a number of
other features: broadening product ranges, more and larger stores
which were often located out of town, and increased multi-channel
retailing (including home delivery and click-and-collect). 62
The five years since 2012 have seen many of these trends reversed. The
market share of the big four supermarkets has fallen from 77% in 2011
to 68% in 2018.63 The major supermarkets have also altered the profile
of their estates, with a concerted move away from out of town stores
towards town centre convenience stores and ‘small supermarkets’. In
2014, Sainsbury’s announced that it had more convenience stores than
supermarkets; Tesco, the UK’s largest retailer, announced that its
convenience stores outnumber its supermarkets in 2013.64
This decline in the market share of the big four was accompanied by the
rapid rise of the lower costs, “no frill” competitors: Lidl and Aldi. In
2008, the combined market share of Lidl and Aldi in the Great Britain
groceries market was 5%. In 2018 it was 13%.65 These stores are
characterised by a smaller range of goods and generally lower prices,
compared to the big four supermarkets.
Changing consumer behaviour has also affected the big four
supermarkets. In recent years, consumers have begun to make more
frequent, smaller value shopping trips. Consumer preference has shifted
in favour of single item purchases, rather than ‘multi-buys’. And, the
trend towards increased online purchasing means that a large stock
selection in store is no longer crucially important. 66
61
Bank of England, Monetary Policy Report: May 2021, 6 May 2021; Easing of
restrictions lifts UK consumer confidence to pre-pandemic level, Valentina Romei,
Financial Times, 24 May 2021.
62
Bank of England, David vs Goliath: the supermarket’s battle for the consumer (via
the Bank Underground blog), 8 September 2017
63
Kantar World Panel, Great Britain grocery market share, 7 October 2018
64
BBC, The rise, fall and rise of the mini-supermarket, January 2014
65
Kantar World Panel, Great Britain grocery market share, 7 October 2018
66
Bank of England, David vs Goliath: the supermarket’s battle for the consumer (via
the Bank Underground blog), 8 September 2017About the Library
The House of Commons Library research service provides MPs and their staff
with the impartial briefing and evidence base they need to do their work in
scrutinising Government, proposing legislation, and supporting constituents.
As well as providing MPs with a confidential service we publish open briefing
papers, which are available on the Parliament website.
Every effort is made to ensure that the information contained in these publicly
available research briefings is correct at the time of publication. Readers should
be aware however that briefings are not necessarily updated or otherwise
amended to reflect subsequent changes.
If you have any comments on our briefings please email papers@parliament.uk.
Authors are available to discuss the content of this briefing only with Members
and their staff.
If you have any general questions about the work of the House of Commons
you can email hcenquiries@parliament.uk.
Disclaimer
This information is provided to Members of Parliament in support of their
parliamentary duties. It is a general briefing only and should not be relied on as
a substitute for specific advice. The House of Commons or the author(s) shall
not be liable for any errors or omissions, or for any loss or damage of any kind
arising from its use, and may remove, vary or amend any information at any
time without prior notice.
The House of Commons accepts no responsibility for any references or links to,
BRIEFING PAPER or the content of, information maintained by third parties. This information is
Number SN06186
provided subject to the conditions of the Open Parliament Licence.
25 May 2021You can also read