Ride-sharing Profitable or not? - bank DBS
←
→
Page content transcription
If your browser does not render page correctly, please read the page content below

75
 SECTOR BRIEFING
number

 DBS Asian Insights
  DBS Group Research • May 2019

                                  Ride-sharing
                                    Profitable or not?
DBS Asian Insights
SECTOR BRIEFING 75
 02

Ride-sharing
Profitable or not?

Sachin MITTAL
Equity Analyst
DBS Group Research
sachinmittal@dbs.com

Produced by:
Asian Insights Office • DBS Group Research

   go.dbs.com/research
   @dbsinsights
   asianinsights@dbs.com

Wen Nan Tan          Editor
Martin Tacchi        Art Editor

DBS Asian Insights
                                             SECTOR BRIEFING 75
                                                                   03

04   Executive Summary
     Can ride-sharing be a profitable model?
09   What is ride-sharing?
     Market size
     Different ride-sharing models in play
     Ride-sharers expanding beyond simple-taxi offerings
     Safety is another key appeal of ride-sharing
     SoftBank’s role in mediating ride-sharing industry
     competition
13   Is ride-sharing a profitable business model?
     Understanding the key elements driving profitability
     of ride-sharers
     Path to profitability of ride-sharers – Line by Line
     analysis

17   What does it take to become profitable in
     the ride-sharing business?
     Confronting arguments against the profitability of
     ride-sharing
27   Playbook for smaller ride-sharing operators
30   Regulations: The biggest overhang for ride-
     sharers
32   Drawing insights from E-commerce to ride-
     sharing
40   Appendix
     Key ride-sharers around the world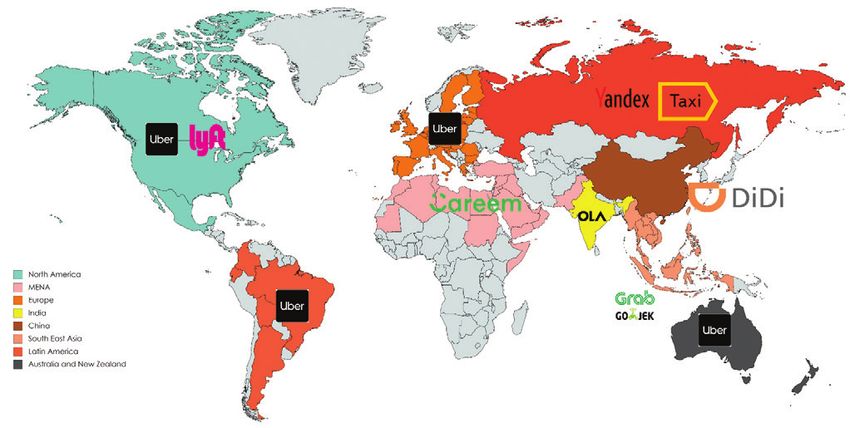
DBS Asian Insights
SECTOR BRIEFING 75
04

Executive Summary
                     Can ride-sharing be a profitable model?

                     From our analysis into the operations of ride-sharers, we found that dominance and scale
                     are the two key drivers for profitability. Dominance in key cities allows ride-sharers to ease
                     spending on rider incentives and marketing expenses, without major driver or rider churn.

                     Scale may entail lower revenue per ride due to expansion outside the major cities but leads to
                     superior gross margins. Key benefits of scale are lower insurance costs, payment processing
                     fee and fixed platform operating costs as a percentage of revenue. We believe that ride-
                     sharers with > 60% market share in their respective countries, including key metropolitans,
                     should reap benefits of their dominance.

                     Our key finding is that a region cannot have more than one profitable ride-sharing player.
                     Ride-sharers operating in the South East Asian region may start to realise scale benefits at
                     US$1.3-1.7b revenues. This is provided, their expansion plans which typically lead to delays
                     in reaching profitability, are minimal.

                                                    What does it take to build
                                                    a profitable ride-sharing
                                                            business?

                            Dominance                                                        Scale
                      Dominance in key markets                                        Scale allows bigger
                       keeps sales & marketing                                         players to reduce
                         expenses and rider                                       insurance, payment and
                         incentives in check                                       fixed operating fee as a
                                                                                    percentage of revenue

                                                                                                      Source: DBS Bank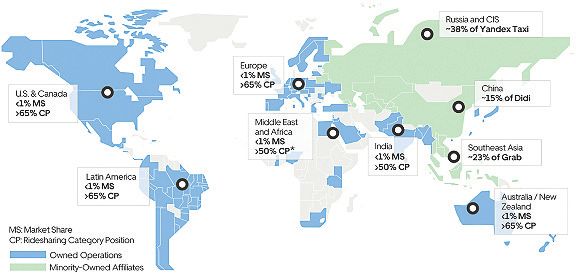
DBS Asian Insights
                                                                                        SECTOR BRIEFING 75
                                                                                                                      05

                           Does this mean that smaller operators should just pack up
                           and leave?

                           Whilst the path towards profitability for smaller operators remains rocky, we believe smaller
                           players can co-exist with market leaders with the right strategies in place.

                           We outline three distinct strategies that smaller players can pursue that could set them on
                           a path towards profitability:

                           1. Focus on niche market segments that are typically underserved by bigger operators (Eg.
                              Ola for Auto-rickshaws)

                           2. Focus on specific regions / cities to limit competitive play with bigger players to drive
                              down incentives and marketing expenses

                           3. Develop an ecosystem of more profitable services leveraging the ride-sharing platform
                              and the digital follower base

                                             Playbook for smaller
                                                  operators

Niche segmental play                      Selective regional play                          Ecosystem play
  Dominate niche sub-                     Dominate smaller cities/                    Leverage the ride-sharing
segments in ride-sharing                   regions underserved by                     platform and user base to
 underserved by market                       leading ride-sharers                     diversify and venture into
        leaders                                                                       other profitable segments

                                                                                                           Source: DBS Bank
DBS Asian Insights
SECTOR BRIEFING 75
06
Key financial and operational metrics of ride-sharers around the globe
Grab Go-Jek Uber Lyft Ola
Annual rides (in m) 2,409 1,200 5,220 619 1,000
Active Users (in m) N/A 25 91 18.6 N/A
Active Drivers (in m) 2.8 1.0 3.9 1.9 1.0
Annual Revenue (FY19 for Grab) 2,000 N/A 11,270 2,157 318
(in US$m)
Valuation (based on latest 14,000 9,500 85,000 20,696 6,000
funding rounds and latest
market cap for Lyft) (in US$m)
EV/Revenue 7.0 N/A 7.5 9.6 18.9
Total funds raised (in US$m) 8,800 2,000 24,200 4,900 3,800
Source: DBS Bank, Various media reports
Growth in gross bookings likely to remain in mid double
digits for ride-sharers
We are of the view that Ride-sharing is likely to witness a growth trajectory akin to that of
E-commerce in its early days, though profitability is likely to be lower. With penetration of ride-
sharing services still hovering below 1% of total passenger vehicle trips of less than 30 miles,
there is ample headroom for double-digit growth for ride-sharers over the medium term.
Gross bookings and GMV growth comparisons
Source: Companies, DBS BankDBS Asian Insights
SECTOR BRIEFING 75
07
However, the long term profitability of ride-sharers is likely to be lower than that of
E-commerce marketplaces in our view. This is mainly due to:
1. Regulatory concerns about lowly paid drivers may lead to slower growth or even declines
in the take rate of ride-sharers, adversely impacting profitability
2. Lower margin profiles of ride-sharers, given that sales and marketing expenses are borne
by ride-sharers. Ecommerce marketplaces, on the other hand, incur minimal sales and
marketing expenses as most of these expenses are incurred by sellers on their platform
3. Quantum of revenue that can be derived regionally is lower in comparison to E-commerce
as there is a physical limitation on the number of drivers and riders in a region. E-commerce,
on the other hand, holds a much higher ceiling given the ease of scaling up the number
of product and service offerings in a given region
Regulations could Take rates for ride sharers vs. E-commerce
limit any further
improvements in the
high take rates of
ride-sharers
Source: Companies, DBS Bank
Sales and marketing Sales and marketing expense as a percentage of revenue
expense substantial for
ride-sharers but not for
ecommerce players
Source: Companies, DBS BankDBS Asian Insights
SECTOR BRIEFING 75
08
Can Automated Vehicles (AVs) increase the take rate of
ride-sharers?
The take rate of a ride-sharing business is expected to increase significantly when AVs
become common since driver pay is the most expensive element of a ride at present,
accounting for c. 75% of the total fare of a ride. All major ride sharers are in the process
of developing and testing AVs. However, the likes of Waymo (Alphabet’s self-driving arm)
and Cruise (General Motors), that lead the AV race are already trialing ride-sharing services
with their self-driving technologies, which could present a threat to existing ride-sharers.
Automobile manufacturers like Tesla have also expressed an interest in offering ride sharing
services through its vehicles as announced recently.DBS Asian Insights
SECTOR BRIEFING 75
09
What is Ride-sharing?
M
ost of us have hailed a cab at least once in our lives. Ride-sharing refers to
the same arrangement, except the “hailing” takes place via digital means
– either via a smartphone application or a website browser. Drivers are also
often freelancers and not dedicated drivers of taxis. Ride-sharing allows users
to hail an array of transportation options, ranking from Limousines, black cars and choppers
to auto rickshaws and motor bikes.
Ride-sharing involves the provision of a taxi-like service via the use of Global Positioning
System (GPS) enabled software, linking drivers and passengers directly without the need
for a dispatch centre. The platforms are account-based, with payments being automatically
processed via the subscriber’s credit card or manually at the end of the trip. Different service
options are typically available, ranging from shared rides with other passengers through to
rides in luxury limousines.
Market size
Ride-sharers primarily target short passenger trips, often of less than 10 miles. Their focus
greatly lies in metropolitan cities of the world, where frequency of rides is usually high and
distance travelled short. According to Uber, ride-sharers can target a market that is worth
as much as US$5.7 trillion in 175 countries across the globe. This is based on 11.9 trillion
miles travelled per year in passenger vehicles, including public transportation miles in all
countries globally.
Potential size of the market up for grabs for ride-sharers
Total Addressable market (175 countries)
All passenger vehicle and public transport trips – 11.9t Miles
Valued at - US$ 5.7t
Trips in public transport– 4.4t Miles
Valued at - US$ 1.0t
Trips in passenger vehicles
– 7.5t Miles
Valued at - US$ 4.7t
Source: UberDBS Asian Insights
SECTOR BRIEFING 75
10
Major ride-sharers around the globe
Source: Mapchart, DBS
Different Ride-sharing models in play
Ride-sharing companies have come up with different models of service offerings to cater to
the requirements of various user groups, targeting high-end, mid-market and budget users
separately.
For instance, Uber, the biggest ride-sharing platform globally, offers premium services through
its service offerings such as Uber Black, Black SUVs and Uber Select. The vehicles offered via
these services are usually black in color, sometimes equipped with personal chauffeurs and
target business customers and high net worth individuals.
Lyft also caters to the premium market through Lyft Lux, Lux Black, and Lux Black XL, where
drivers with qualifying vehicles have the opportunity to earn more by listing their vehicles
under those ranges.
Uber’s mid-market range offerings include UberX and UberXL, which offer everyday rides at
affordable prices. Lyft caters the mid-market through brands Lyft and Lyft XL. These models
target regular customers seeking convenience at affordable prices.
Both Uber and Lyft cater to budget customers. UberPool and Lyft Shared are some of
the examples in this category. Here, drivers cater to multiple customers, who share
destinations that are in close proximity to each other, simultaneously, with a cheaper rate
offered to each customer.DBS Asian Insights
SECTOR BRIEFING 75
11
Ride-sharers expanding beyond simple-taxi offerings
Ride-sharing services have grown rapidly worldwide over the last five years, with companies
such as Uber, Didi Chuxing (Didi), Grab and Ola rising to be among the most prominent. With
ride-sharing turning out to be such a successful venture, most of the ride-sharers are now
expanding beyond ride-sharing, into other adjacent segments like bike-sharing and scooter
sharing, logistics and autonomous driving.
Specifically, Lyft offers an expanded suite of transportation including shared bikes and scooters
for shorter rides and first-mile and last-mile legs of multimodal trips. Lyft has also added
information on nearby public transit routes in selected cities to offer riders a robust view of
transportation options. This multimodal platform better enables Transportation as a Service
(TaaS), which is a viable alternative to car ownership.
Through its New Mobility Solutions offerings, Uber also caters to consumers with access to
rides through a variety of modes, including dockless e-bikes and e-scooters. Uber expanded
into logistics in 2017, introducing “Uber Freight”, connecting shippers with drivers and small
fleets hauling freight via a load-matching mobile app. Furthermore, Uber, Lyft and Didi are all
piloting self-driving projects alongside with manufacturers of automobiles.
Safety is a key appeal of ride-sharing
Ride-sharing services have also instilled confidence in drivers and riders since there is more
transparency and trust through the rating system, where both riders and drivers get the
opportunity to rate their experience on the ride. The two way system holds both riders and
drivers accountable for their behaviour during the ride. Consistently lower ratings could even
result in a ban from the usage of the ride-sharer’s services. Furthermore, in-app safety features
allowing riders and drivers to notify authorities and their friends of any incidents, share their
live location with other users, 24/7 incident reporting and phone number anonymization have
boosted the confidence of riders and drivers to utilise the service even further. This is not to
say that ride-sharing is perfectly safe. Three female passengers using the services of Didi have
been murdered by their drivers over the 2016-2018 period, signifying safety is still a concern in
ride-sharing. However, ride-sharers have utilised technology tools at their best to offer a much
better sense of safety than their traditional taxi-counterparts.
SoftBank’s role in mediating ride-sharing
industry competition
Prominent Japanese investor, SoftBank, has built a stronghold in the ride-sharing market
worldwide, placing the firm within the ranks of the largest investors in all the leading
ride-sharing platforms. Its investments in the ride-sharing industry include Uber (US), GrabDBS Asian Insights
SECTOR BRIEFING 75
12
(Singapore), Didi (China), Ola (India) and Brazil’s 99 (which was later acquired by Didi).
Softbank’s influence on each ride-sharing company is significant. For example, following its
investment into Uber, SoftBank expanded Uber’s board from 11 to 17 members (including two
directors representing SoftBank’s interest), reduced the voting power of early shareholders,
and limited the influence held by Uber co-founder and former Chief Executive Travis Kalanick.
Softbank’s ambitious plans for the ride-sharing industry was laid out in May 2018 when Chief
Executive Masayoshi Son shared his plans to establish a Visionary Fund to consolidate all its
ride-sharing companies. In total, the Japanese entrepreneur has placed a US$60 bn bet in
more than 40 companies in a bid to steer the US$3 tn global automotive industry1. SoftBank
is now poised to use its influence to broker deals between ride-sharing companies that might
otherwise battle indefinitely, bringing about industry consolidation, as in the case of Grab
acquiring Uber’s South East Asian operations in 2018. This, we believe could fare well for the
bigger ride-sharing operators globally, as Softbank could mediate to limit instances where
bigger players cross paths with each other.
However, the SoftBank portfolio is not without risks, particularly for companies dependent
on the Japanese firm for financial sustenance for years to come. SoftBank faces financial
pressures, including an obligation to pay an annual 7% dividend on a portion of the invested
capital and the firm has already burnt through a significant portion of the Vision Fund. Whilst
this may impose pressure on Softbank’s future investments in the industry, Softbank has
already made its mark as the leader of the ride-sharing industry globally and would be a key
mediator driving rational competition within the industry.DBS Asian Insights
SECTOR BRIEFING 75
13
Is Ride-sharing a profitable
business model?
W
e look into the unit economics of ride-sharing operators, basing our analysis
on recent Initial Public Offering (IPO) filings of Uber and Lyft in a bid to
understand the per-ride profitability of ride-sharing operators on a pure-direct
cost basis at present.
Uber’s ride-sharing business, on a pure-direct cost basis turned positive in 2018
Uber - Ride Sharing (US$) Per Ride Lyft - Ride Sharing (US$) Per Ride
2016 2017 2018 2016 2017 2018
Gross booking per ride 10.78 8.40 7.95 Gross bookings per ride 11.73 12.21 13.00
Driver fees and incentives (8.84) (6.56) (6.19) Driver Incentives (1.46) (1.02) (0.87)
Revenue 1.94 1.84 1.76 Driver Pay (8.15) (8.37) (8.65)
Excess driver incentive (0.26) (0.12) (0.13) Driver pay and incentives (9.61) (9.39) (9.52)
Other cost of revenue (0.87) (0.83) (0.70)
Contribution 0.82 0.89 0.93 Revenue 2.11 2.82 3.48
Operations and support (0.45) (0.31) (0.24) Cost of revenue (1.72) (1.76) (2.01)
Sales and marketing (0.41) (0.32) (0.25) Other adjustments 0.11 0.00 0.01
Driver referrals (0.08) (0.05) (0.02) Contribution 0.50 1.07 1.49
Rider Incentives (0.31) (0.22) (0.22) Operations and Support (0.60) (0.49) (0.55)
Operating Profit/loss before (0.43) (0.01) 0.20 Sales and Marketing (1.47) (1.10) (0.82)
corporate charges Rider incentives (1.20) (0.41) (0.48)
Operating Profit/loss before (2.77) (0.93) (0.36)
As a % of revenue corporate charges
Take rate as a % of gross 18% 22% 22%
bookings As a % of revenue
Excess driver incentive 13% 7% 7% Take rate as a % of gross 18% 23% 27%
Other cost of revenue 45% 45% 40% bookings
Gross Profit Margin 42% 48% 53% Cost of Revenue 76% 62% 57%
Operations and support 23% 17% 13% Gross Profit Margin 24% 38% 43%
Sales and marketing 21% 17% 14% Operations and Support 29% 17% 16%
Driver referrals 4% 3% 1% Sales and Marketing 70% 39% 24%
Rider Incentives 16% 12% 12% Rider incentives 57% 15% 14%
Operating Profit/loss before -22% 0% 11% Operating Profit/loss before -131% -33% -10%
corporate charges corporate charges
Source: Uber, Lyft, DBS Bank
As Uber does not breakdown costs attributable to each of Uber’s segments (namely: Ride-sharing, Uber Eats and Uber Freight),
we have apportioned total costs on the basis of revenue contribution to perform our analysis on profitability per ride. Ride-
sharing accounted for 92%, 87% and 81% of Uber’s topline over 2016, 2017 and 2018 respectively. On a consolidated basis,
Uber generated a profit of US$980m, before corporate charges and depreciation and amortization in 2018. Uber reported
US$3.03b in operating losses over 2018 (vs. US$4.08 in 2017).DBS Asian Insights
SECTOR BRIEFING 75
14
Understanding the key elements driving
profitability of ride-sharers
“I’ve earned US$2on this ride - Uber”
Revenue of ride-sharing companies
is gross bookings less driver fees/
incentives and taxes
“I have US$2 off, so I will pay US$8” “Your fare is US$10”
Incentives are provided to Referred to as “Gross bookings”
riders to improve frequency of this is the total value of all rides
rides and loyalty. This is one of taken through a ride-sharing
thekeydeterminantsofprofitability platform
as rider incentives account for a
significant portion of expenses of ride-
sharing companies and is discretionary
Key operating expenses
Cost of revenue
Includes platform running expenses, insurance and
payment processing fees
Operations and support
Costs involved in providing rider support, driver on-
boarding, driver background checks
Sales and Marketing
One of the biggest line items. Includes advertising and
promotional expenses
Source: DBS Bank
Gross Bookings
Akin to Gross Merchandise Value (GMV) of E-commerce players, Gross bookings refer to the
total value of all rides taken through a ride-sharing platform. This includes the fare of the
ride, applicable taxes, driver fees, tolls, etc. Gross bookings are driven by a combination of
fare set by the ride-sharing company, number of active riders on the platform (penetration
of ride-sharing services) and frequency of use by active riders.DBS Asian Insights
SECTOR BRIEFING 75
15
Revenue and Take Rate
Revenue is defined as the net proceeds realized by ride-sharing companies once the gross
bookings are adjusted for fees and incentives paid to drivers and taxes. Take rate is the
percentage of revenue realized through total bookings.
Cost of Revenue
Direct costs of revenue largely comprises of insurance expenses (coverage by typical auto-
insurance products cease when passenger vehicles are used for ride-sharing. Hence ride-
sharing companies are required by regional laws to provide insurance coverage to riders/
drivers during service), payment processing fees and platform operating expenses (data
centre hosting and colocation, mobile device and service charges).
Contribution
Gross profit of ride-sharing business after accounting for attributable direct costs.
Operations and support
Expenses involved in providing operational support to riders and drivers, driver onboarding
expenses and expenses related to conducting background checks on drivers.
Rider Incentives
Discounts and promotions offered to riders to keep them on the platform, improve
frequency of rides and attract new riders. Rider incentives are classified under sales and
marketing expenses. Rider incentives typically depend on the competitiveness of the
ride-sharing marketplace and are a key determinant driving profitability of ride-sharing
operators. This is so as rider incentives account for a significant portion of expenses of ride-
sharing companies and is discretionary with ample room to be curtailed depending on the
competitiveness of the marketplace.
Sales and Marketing
Other advertising and promotional expenses involved in promoting ride-sharing services.
The appeal of ride-sharing as a business model is quite clear – the business generates c.
50% gross margins. However, c. 40-50% of revenue is attributed to other direct costs below
the gross margin level with sales and marketing, and rider incentives accounting for the
lion’s share.
Going by the example of Uber, which yielded an operating profit before corporate expenses,
it is evident that once expenses below the gross margin level (particularly sales and
marketing, and rider incentives) are controlled, ride-sharing can turn out to be a profitable
business model.DBS Asian Insights
SECTOR BRIEFING 75
16
Path to profitability of ride-sharers – Line by
Line analysis
Increase gross booking per ride Ride-sharer (US$) 2018 Improving take rate
Fare increases, market share and This would be unsustainable
penetration gains could drive as a higher take rate translates
Gross Bookings 400%
gross bookings up. However, this to lower pay for the drivers,
may require higher S&M and rider Driver pay and 300% which could a). Increase driver
incentives
incentives. Revenue 100%
churn and b). Cause regulatory
concerns
Cost of Revenue 52%
Reduce cost of revenue Lower Ops and Support
There is room to reduce in platform Contribution 48% One of the more feasible
related expenses with economies Operations and 15% ways of improving margins,
of scale, while better negotiated support as with improving volumes
Sales and marketing 20%
contracts with insurance providers and potential digitisation
and payment processors could Rider incentives 13% of customer support, driver
drivedown costs of revenue. Operating Profit/ 0.0% background checks etc, Ops
loss before corporate and support expenses as a %
charges
of revenue has room to come
Lower Sales and Marketing and down.
rider incentives
Most feasible way of arriving
at profitability. However, this
would largely depend on the
competitiveness of the market
place and the market position of
the ride-sharing operator. Lowering
S&M and incentives could also
have a knock on effect on Gross
bookings as frequency of usage
and penetration of ride-sharing
could edge lower once the
incentives are taken out. Source: Uber, Lyft, DBS BankDBS Asian Insights
SECTOR BRIEFING 75
17
What does it take to become
profitable in the ride-sharing
business?
T
he ride-sharing business model is banking on two macro-economic trends: greater
penetration of autonomous vehicles (AV) on the road and lower car ownership to
reach profitability. These two trends go hand-in-hand.
It is estimated that within 10 years of regulatory approval of fully autonomous vehicles (or by
2030) , c. 95% of all US passenger miles will be served by TaaS providers who will own and
operate fleets of AVs resulting in private car ownership estimated to drop by c. 80%2.
The cost of operating a ride-sharing business is expected to dramatically decrease when AVs
become common. This is due to:
1. Currently, the driver is the most expensive element of a ride
2. Autonomous car utilisation could be as efficient as 50%
3. AVs are expected to be able to minimise the number of accidents, which would
decrease repair and insurance costs
The demand for private car ownership is also expected to take an additional hit as the
younger generations are more familiar with subscription services and their disregard for car
ownership as a status symbol. The advent of AVs could create major shifts in the ride-sharing
market, paving way for much better prospects of earnings in the ride-sharing industry.
Drilling down to a more micro-level, we draw cues from our analysis of Lyft and Uber ,
the only ride-sharing companies that have disclosed financial and operational information
publicly. Drawing insights from Uber, the only profitable ride-sharing operation we know of,
we identify a few key elements that could help ride-sharing operators become profitable.DBS Asian Insights
SECTOR BRIEFING 75
18
What does it take to build
a profitable ride-sharing
business?
Dominance Scale
Dominance in key markets Scale allows bigger
keeps sales & marketing players to reduce
expenses and rider insurance, payment and
incentives in check fixed operating fee as a
percentage of revenue
Source: DBS Bank
Market Dominance
A business is said to be enjoying a “network effect” when the product or service it offers
becomes more valuable as more users start using said product / service. Most tech giants in
the world like Amazon, Google and Facebook cite their user networks as the key source of
their competitive strength. This further signifies the importance of the “network effect” for
tech companies.
Ride-sharing heavily benefits from indirect-networking effect. Getting more riders onboard
may not necessarily be beneficial for the riders, as there could be instances where riders
crowd out each other (recall your experience of trying to hail a taxi on a stormy day).
However, the more riders a ride-sharing facilitator has on its platform, the better its ability
to attract a greater proportion of drivers. With more drivers, the user experience of the
rider improves with lower waiting times and limited chances of crowding each other out,
or encountering surge pricing (surge pricing is when the normal fare is adjusted upwards
to reflect the gap in rider demand and driver supply), allowing the ride-sharing facilitator to
attract more riders to its platform. With more riders, driver earnings on the platform also
edge up as the number of trips improve, attracting more drivers to the platform. Hence, first
mover advantage that allows a player to rake up riders and drivers and dominance in the
market a player operates in can be considered critical success factors for ride-sharing players.DBS Asian Insights
SECTOR BRIEFING 75
19
Network effect of ride-sharing platforms
Liquidity Network Effect
More Driver
5 drivers supply
1
More rides Lower wait
4 per hour and
higher earnings $ More
liquidity
times and
fares 2
potential for
drivers
More
3 riders
Source: Uber
In our view, a dominant position in key ride-sharing markets helps the ride-sharer in
two key ways:
1. Minimise rider incentives
A dominant player can minimise its spending on rider incentives, and sales and
marketing expenses. Instead, it can compensate for the lack of discounts and
promotions through a better rider experience (lower wait times, highly rated drivers
etc), lower fares and reduced probability of encountering surge pricing. Second tier
players on the other hand, have to continuously churn out promotions and discounts to
keep riders on the platform and compensate for a potentially poor rider experience.
2. Minimise driver incentives
With higher earnings derived from the platform supported by a higher rides per hour
ratio, ride-sharing operators can also look into the possibility of easing incentivesDBS Asian Insights
SECTOR BRIEFING 75
20
offered to drivers on the platform. However, this would have to be done carefully and
to a lesser degree than minimising sales and marketing, and rider incentives. This is so
as regulatory issues could pop up if driver pay is trimmed substantially. Smaller players
on the other hand, have to compensate for potentially lower hourly earnings of drivers,
by offering higher driver incentives to prevent drivers from churning, which could
exacerbate the situation of these players even further.
Uber has operations across 700 cities, and is a dominant player in most of the markets
it operates in. According to data shared by the company, Uber controls > 65% of ride-
sharing market share in North America, Latin America, Europe, Australia and New Zealand.
This includes major ride-sharing destinations in these markets such as New York City, San
Francisco, London and other key metropolitans. The company also claims to have > 50%
market share in India and Middle East and North Africa (MENA) regions.
We believe Uber’s dominant position regionally and in some of the biggest ride-sharing
markets globally is one of the key forces driving its path to profitability. For instance, sales
and marketing, and rider incentives accounted for only 28% of Uber’s revenues in 2018, vs.
37% at Lyft. This was based on Uber’s statistics, which states that it controls < 35% of the
North American market (Lyft claims to have a market share of c. 39% in North America).
As Uber has secured a critical mass in its key ride-sharing markets in the US, it can secure
customer loyalty through a better rider experience, availability in most major cities vs. limited
availability of Lyft’s services in certain cities. This in turn allows Uber to start trimming its rider
promotions in selected markets in the US without major user churn.
Uber’s strong network effect can also be seen through its operating statistics. Uber riders
on average completed over c. 57 trips annually, c. 70% higher than the average number of
rides of Lyft users. Uber drivers also completed as many as c. 1,338 trips in 2018, almost as
much as 4 times the number of rides completed by a driver of Lyft on average.
Uber’s network effect is reflected in its operating statistics
in m Uber Lyft
Number of riders 91 18.6
Number of drivers 3.9 1.9
Number of rides 5,220 619
Annually
Rides per driver 1,338 326
Rider per rider 57 33
Riders per driver 23 10
Source: Companies, DBS BankDBS Asian Insights
SECTOR BRIEFING 75
21
Furthermore, we believe that Uber’s decision to divest its operations in China and South East
Asia, where it was a second tier player struggling to secure adequate market share, may
have been motivated by the lack clarity on a path towards sustainable profitability.
Uber dominates the global ride-sharing market
Russia and CIS
~38% of Yandex Taxi
Europe
65% CP China
US & Canada
65% CP
Middle East
and Africa
50% CP
50% CP
Latin America
65% CP Australia/
New Zealand
65% CP
CP: Ride sharing category position
Owned operations
Minority-owned affiliates
Source: Uber
Whilst it’s difficult to define a level of dominance that allows a ride-sharer to become
profitable, we estimate that at > 60% market share in a country, including the key
metropolitan ride-sharing markets, ride-sharers would start to weave the benefits of the
network effect, allowing the ride-sharer to gradually start curtailing its incentives and
heavy advertising expenses, without major loss of market share. Trimming driver incentives
however, would depend on the regulatory background in the region and would need to be
done at a much slower pace than rider incentives.
However, despite the benefits of the network effect, we believe that the path to profitability
of a dominant ride-sharer would greatly depend on the share of rider and driver incentives.
Dominant ride-sharers with a much greater share of driver incentives than rider incentives
are likely to take longer to reaching profitability, given the slower pace of curtailing driver
incentives vis-à-vis rider incentives, to avoid an increase in driver churn.DBS Asian Insights
SECTOR BRIEFING 75
22
Scale advantage
Scale is another key driver, driving the profitability of ride-sharers. Like in any other industry,
scale allows ride-sharers to realise economies of scale and yield better cost efficiencies. This
in turn allows bigger ride-sharers to realise better margin profiles. Uber for example, enjoys
gross margins of 53% vs. 43% at Lyft, largely stemming from Uber’s ability to realise better
cost efficiencies at a gross margin level and a potentially lower cost structure in markets like
Latin America, India and MENA.
A comparison of Uber’s better margin profiles clearly signifies the importance of scale in ride-
sharing. We believe Uber’s better margin profile is derived from three key sources:
1. Insurance expenses
Insurance is one of the biggest cost items for ride-sharers. Uber uses a small number of
insurance providers (Global insurance giant, AXA for example, provides coverage across
UK, Europe, certain MENA regions and Hong Kong) to provide liability insurance across
the globe. Uber also operates its captive subsidiary for insurance underwriting, in a small
number of markets, allowing Uber to trim its insurance costs even further. Given the
global scale of Uber’s operations, Uber is able to negotiate better terms on insurance
contracts with its key insurance providers, allowing Uber to lower its insurance expenses
as a % of revenue. Furthermore, liability insurance by ride-sharers is not a legislated
requirement in some of the markets (especially emerging) that Uber operates in. Whilst,
Uber provides liability insurance coverage in most of its markets, it is likely that in some
markets Uber incurs no insurance expenses. This should allow Uber to improve gross
margins derived from those regions.
2. Lower payment processing fees
Expansions across the globe is likely to have allowed Uber to secure better terms on
payment processing from global payment processing giants given the higher volume of
transactions. Uber also accepts cash as a mode of payment across 130 cities including
India, Latin America and Africa, which to our understanding are not subjected to any
payment processing fees (Uber’s fee on cash rides is deducted from the fare available
to drivers on rides done through digital means, hence Uber does not incur payment
processing fees on cash rides). News articles suggest that cash rides account for c.
65% of rides in India and c. 25% in Brazil, which should allow Uber to lower payment
processing fees on a per ride basis. Lyft on the other hand is 100% cashless.
3. Lower platform related expenses as a % of revenue
Platform related expenses tend to be mostly fixed in nature and hence as operations in
a region expands, platform expenses edge down as a percentage of revenue.DBS Asian Insights
SECTOR BRIEFING 75
23
Uber’s scale allows it Gross Margin and OPS for 2018
to yield better margins
and cost efficiencies
Source: Uber, Lyft, DBS Bank
At what scale would ride-sharers start to see the benefits
of scale?
Uber’s ride-sharing segment attained profitability in 2018, after raking up revenues of c.
US$9.2 bn through c. 5.2 bn rides. Having embarked on an aggressive expansion plan to
expand its reach globally, Uber’s ride-sharing segment is likely to have witnessed delays in
reaching profitability as expansions typically translate to higher sales and marketing, and
operational expenses at the initial stages of entry into new regions. Lyft on the other hand,
is expected to generate an operating profit before corporate expenses from its ride-sharing
segment over the next 2-3 years, with revenues of US$4.5-5 bn, with an annual ride count
of c. 1.1-1.3 bn.
Drawing from our analysis of Uber and Lyft, we believe the scale required to attain
profitability largely depend on two key factors:
1. If the ride-sharer is regional or country specific
2. The expansion strategy of the ride-sharer
Extrapolating from our analysis of Uber and Lyft, we estimate that Ride-sharers operating
in South East Asia may need to generate c. US$1.3-1.7 bn in revenues before reaching
profitability, provided that expansions within the region remain minimal.
In our analysis we assume, to reach profitability outside US, a country-specific operator
would need to rake at least 30 m riders (marginally higher than the rider base of Lyft, when
Lyft is expected to reach profitability), whilst a regional operator may need to secure at leastDBS Asian Insights
SECTOR BRIEFING 75
24
45 m riders (half of the rider base of Uber). We believe that regional operators would need
a higher rider base to reach profitability, as regional expansions remain expensive and such
expansions often tend to encounter greater competitive pressures.
Whilst our analysis is based on a series of assumptions, we do note that Grab, which is on
track to generate revenues of US$2 bn over 2019, is already said to be profitable in certain
mature markets (most mature markets for Grab include Malaysia and Singapore) in the
region in its ride-sharing operations.
Uber’s network effect is reflected in its operating statistics
Scale to profitability Uber Lyft SEA India
Revenue (U$ m) 9,182 4,078 1,729 834
Riders (in m) 91 27 45 30
Rides (in m) 5,220 1,049 1,778 1,192
Revenue per Rider (US$) 101 154 38 28
TAM population(in m) 4,100 328 642 1,339
TAM penetration 2% 8% 7% 2%
Proportion of US fares 25% 18%
Assuming 45m riders to breakeven regionally and 30m riders to breakeven in a given
country. Annual trip count per rider is set at 40.
Source: Companies, DBS Bank
The expansion strategy also comes into play in driving a ride-sharers’ profitability. Typically,
expansions into new cities require heavy marketing and promotional expenses, along with
heavy rider and driver subsidies if the market is already served by a ride-sharing operator.
Operational expenses including insurance and platform related expenses also tend to edge
up at the early stages of entry into new cities. Expanding into new countries tends to be
even more expensive at the initial stages. Whilst expansions and gaining scale is beneficial if
the ride-sharer can secure a dominant position in these new regions, expansions inevitably
would cause delays in the timing of reaching profitability for the ride-sharer.
Confronting arguments against the
profitability of Ride-sharing
Several arguments have been laid out, suggesting that ride-sharing is not a sector prone to
generate sustainable economic profits. We look at some of these arguments in depth and
share our views as to why we think otherwise.DBS Asian Insights
SECTOR BRIEFING 75
25
Multi-homing could lead to a perpetual need for incentives
Multi-homing, refers to a situation in which multiple platforms are simultaneously used
by users, as the cost of switching between platforms remains low or non-existent. For
example, the cost for a rider or a driver of using both Uber and Lyft are bare minimal:
the process is as simple as downloading and registering with the two apps.
Multi-Homing presents a real risk to the platform developer, as users often tend to make
comparisons between the platforms before making their decision of which one to choose.
In ride-sharing this means that riders may choose to go with the platform that gives them
the best discount, while drivers could turn to the platform that allows them to yield the
best hourly pay. When multi-homing is commonly prevalent, it could become challenging
for a platform to generate a profit from its core business as incentives need to be handed
out to platform participants to keep them within the platform.
Whilst, multi-homing remains a reality for ride-sharers, several other industries that
witnessed this effect have successfully transitioned to profitability backed by their
innovative strategies and dominance by a few key players. The E-commerce sector
remains a prime example.
The cost of switching between E-commerce platforms remain as little as searching for
the name of the platform in your web browser. However, Amazon and Alibaba have
managed to emerge as winners in E-commerce regionally, leveraging on their early entry
to the market, dominant network that was hard to be replicated and service innovations
such as “Amazon Prime”, which improved customer loyalty to the platform.
In ride-sharing, the availability of a network itself becomes a key switching cost for
platform participants, allowing the operator with the biggest network to flourish in the
long run. For example, the cost of switching from a first tier ride-sharer to a second tier
ride-sharer for a small discount could be longer wait times or poorly rated drivers, which
may deter users from transitioning between platforms. Ride-sharers have also launched
short-term initiatives such as incentives for drivers that complete a certain number of
trips without cancellations or discounts for riders that complete a certain number of
rides. These could also help ride-sharers improve loyalty and expand on their network
dominance, at which point such incentives can be trimmed down.
Low barriers of entry translate to lower economic profits in
the long run
Ride-sharing industry relies on digital networks where all the core operations are algorithm
driven. The service offering of ride-sharing is also a commodity: The service of taking a
person from point A to point B, and offers little room for key players to differentiate based
on their service offerings. Hence, theoretically a new player with the right algorithm and
enough funds to secure riders and drivers should be able to disrupt the ride-sharing market.DBS Asian Insights
SECTOR BRIEFING 75
26
Why would this not work? Despite the standardized service offering, the network of a ride-
sharer is its key asset and the key barrier to enter the ride-sharing industry. Just like how it
is difficult for a new E-commerce player in China to replicate the buyer / seller networks of
Alibaba, which Alibaba has taken years to develop and invested tons of money in, a new
player would struggle to build a similar network of that of a dominant ride-sharing operator,
making it difficult to compete effectively.DBS Asian Insights
SECTOR BRIEFING 75
27
Playbook for smaller ride-
sharing operators
W
hile dominance and scale remain pivotally important in ride-sharing to attain
profitability, we do believe smaller operators too can share the ride-sharing
pie with bigger operators, with the right strategies in place. In the following
section, we discuss three types of distinct strategies smaller ride-sharing
companies may opt for.
Playbook for smaller
operators
Niche segmental play Selective regional play Ecosystem play
Dominate niche sub- Dominate smaller cities/ Leverage the ride-sharing
segments in ride-sharing regions underserved by platform and user base to
underserved by market leading ride-sharers diversify and venture into
leaders other profitable segments
Source: DBS Bank
Niche segmental play
Smaller operators can gain dominance in niche sub-segments of the ride-sharing market
that are typically underserved by bigger ride-sharing operators. Ola, the leading ride-sharing
player in India, for example, managed to maintain its leading status in India despite Uber’s
entry and disruption in 2013. This is partially so as Ola focused on three-wheelers (Auto-
rickshaws), one of the most commonly used modes of transport in India. Ola also allowedDBS Asian Insights
SECTOR BRIEFING 75
28
users of its platform to pay by cash, a feature that was not available at Uber until two years
after its entry. This has allowed Ola to retain and develop its market share even further
in India where credit card penetration even in major cities remain below c. 15%3. Auto-
rickshaws contributed c. 15% to Ola’s topline in 20174, just three years after its launch and
Ola enjoys a substantial share of the ride-sharing market in India as a result of its focus on
niche market segments.
Selective regional focus
Smaller players can also choose to focus on smaller regions / cities underserved by bigger
players and limit their competitive play only to such areas. This would provide room for
smaller players to curtail sales and marketing, and rider incentives in these regions and
paving way for margin expansion and profitability.
Ecosystem play
Ride-sharers inherently enjoy a few features coveted by many traditional players in today’s
digital world:
1. Customers connect with ride-sharers purely via digital means, allowing ride-sharers to
collect valuable user data
2. Customers of ride-sharing platforms are often the much sought after millennials and
digital natives that are well versed with technology and are willing to try out new digital
innovations
3. Ride-sharing platforms tend to be highly scalable
Data is the future of TaaS, and small ride-sharers too are poised to benefit depending on
how they manage and share data within the mobility ecosystem. These key features offer a
great avenue for ride-sharers with a sizeable following to leverage their platform to venture
into other more profitable segments such as product distribution for traditional sectors,
offering of data analytics as a service etc that could potentially offset losses from their ride-
sharing business.
Prominent ride-sharers like Uber, Grab and Go-Jek have already started to position
themselves as “Platforms” as opposed to simple-ride-sharing apps.
Uber’s ventures into meal-delivery through Uber Eats and logistics through “Uber Freight”
and Grab’s ventures into payments and banking through Grab Pay and micro-loan facilities
are some of the examples of ride-sharers venturing beyond transport in search of better
profitability elsewhere.
Smaller players like Go Jek have gone even further, positioning themselves as “SuperApps”DBS Asian Insights
SECTOR BRIEFING 75
29
catering to an array of different customer demands. Go-Jek for instance allows users to get
maids, personal stylists, personal massage therapist and even auto mechanics on demand
via its app.
Possibilities remain endless for ride-sharers bold enough to venture beyond their traditional
sector, establish partnerships across sectors and explore possibilities of monetizing their
greatest asset base: the ride-sharing platform.DBS Asian Insights
SECTOR BRIEFING 75
30
Regulations: The biggest
overhang for ride-sharers
R
ide-sharers remain highly vulnerable to regulatory changes. With the uptake
of ride-sharing based on digital means, the number of passengers relying on
traditional taxi services (where you get to the street and hail a taxi passing by)
for their transportation requirements would come down. As this is likely to drive
traditional taxi services out of business, drivers are more likely to sign up with digital
platforms like Uber and Lyft.
Under such circumstances, even though drivers are freelancers and not dedicated drivers
of taxis, they rely on the platform enabler as their employer. Earnings from the ride-
sharing platform becomes the sole source of livelihoods for these drivers, which makes
it increasingly difficult for ride-sharers to improve their take rates (realized revenue as a
percentage of gross bookings) as doing so would translate to lower pay for drivers. News
of poor pay offered by ride-sharing services are plentiful in the media which has caught
the attention of regulators around the globe. Regulators are mulling options ranging from
fixating hourly pay/fees per ride for drivers to drawing regulation classifying drivers of ride-
sharing platforms as employees of ride-sharing platforms.DBS Asian Insights
SECTOR BRIEFING 75
31
Regulatory stance on ride-sharing across the globe
Country Rising concerns Regulatory changes
United States • 18% of Uber drivers in New York City • Minimum wage of drivers of ride-
were eligible for food stamps offered sharers was increased to US$ 17.22 an
to low-income households in 2018 hour vs the current average of US$
11.90 in New York City
• 6 driver suicides were reported from • Issuance of new licenses for ride-
2017-18 sharers has been frozen for a period
of one-year as the Taxi and Limousine
Commission studies the ride-sharing
industry.
Indonesia • Several protests in the country against • Fixed rate bands introduced for
poor pay and low-rates charged by ride-sharers for motorbikes and cars.
ride-sharing companies Motorbike ride-sharing rates should
be between IDR 1,850-2,600 per km
(vs. IDR 1,200-1,400 currently) and car
rates set at IDR 3,500 - 6,000 per km
depending on the zone of operation
• “No-Go” zones for ride-sharers – • Rates are to be reviewed every quarter
Drivers of traditional taxis have set
areas where ride-sharing providers are
not allowed to operate in
United Kingdom • Uber drivers in London, Nottingham • Uber was banned in the city of London
and Birmingham staged a protest and by “Transport for London” in 2017
a strike in 2018 demanding a GBP2 following concerns over failure to
per mile increment and reduction in support government initiatives to
commissions charged by Uber battle crimes in the city through
sharing data and lack of corporate
responsibility
China • Three passengers using the services of • Mandated that driver backgrounds
DidiChuxinghave been murdered by and vehicles should meet standards
their drivers between 2016-2018 established by the Chinese Ministry of
Transport
• Commercial license (which has higher
costs attached to it as opposed to
private vehicles) are now mandatory
for drivers signing up with Didi
Several jurisdictions • In several jurisdictions regulators are
mulling if the drivers of ride-sharing
platforms meet the definition of
“Employees” and if not how the
definitions can be altered
Source: DBS Bank, Various media reportsDBS Asian Insights
SECTOR BRIEFING 75
32
Drawing insights from
E-commerce to Ride-sharing
W
e compare the business models of ride-sharing vs. E-commerce, the most
established disruptive industry globally, to draw key insights over the
trajectory of ride-sharers going forward.
Prior to drawing parallels between the two sectors, we wish to highlight a few key
differences between the two sectors at their early stages of growth:
1. E-commerce players benefited from much more diverse streams of revenue
from early on
E-commerce players adopted different business models: marketplace and product,
and generated revenues from a portfolio of service offerings including advertising,
sales commissions, listing fees, data analytics etc. Ride-sharers on the other hand
operate on a more uniform business model and generate revenues primarily through
the taxi fares.
2. TAM for E-commerce is much broader
E-commerce could be extended to most retail product categories ranging from books,
consumer electronics and clothing to fresh produceand groceries. TAM for ride-
sharing however is comparatively limited. As mentioned earlier, ride-sharers primarily
target short-distance private transportation needs of users, of which the TAM is
considerably smaller.
However, despite these differences, we believe insights from the more matured
E-commerce segment, would shed some light on the trajectory of the evolution of the
ride-sharing industry.
In the heydays of E-commerce, dominant players like Amazon and Alibaba reported high
double digit growth in the value of goods transacted through their platforms (GMV)
supported by improving penetration of E-commerce and market share gains from smaller
operators. Dominant players like Alibaba still record growth 25%+ growth on a year-on-
year basis on GMV on its Chinese retail platforms.DBS Asian Insights
SECTOR BRIEFING 75
33
Ride-sharers too have witnessed rapid growth since the start of the ride-sharing model
back in 2010. With the penetration of ride-sharers in most markets still remaining below
1%5 of total passenger vehicle trips of less than 30 miles, we believe ride-sharers are set
on a similar growth trajectory to the growth in GMV E-commerce players witnessed in
their early days.
Growth in gross Gross bookings and GMV growth comparisons
bookings going strong
Source: Companies, DBS Bank
When E-commerce was introduced, it offered customers the convenience of shopping
from home, access to a wide range of products unlikely to be available through a typical
retail store and access to similarly priced, if not cheaper, products. These features were key
drivers behind the uptake of E-commerce that set penetration and GMV of E-commerce
on a trajectory of super fast growth.
Ride-sharing, we believe shares most of these features of E-commerce. Ride-sharing offers
customers the convenience of hailing a ride to their doorstep and allows customers to
choose from a variety of riding options that were previously unavailable (Shared rides or
rentable scooters). Ride-sharing also offers their services at a similar price, if not cheaper
to those of traditional private means of transportation such as taxis. We believe these
features of ride-sharers would continue to drive the penetration of ride-sharing over the
medium term, presenting a steady growth trajectory in gross bookings for ride-sharers.
Rising congestion in metropolitan cities around the world, outdating public transportation
infrastructure in major cities, growing proportion of millennials and digital natives entering
the work force, would further support growth in penetration of ride-sharing as a means
of transport, setting the sector on a trajectory of super-fast growth akin to that of
E-commerce.DBS Asian Insights
SECTOR BRIEFING 75
34
However, the quantum of revenue that can be derived regionally is lower in comparison
for ride-sharers in comparison to E-commerce, as there is a physical limit to the number of
drivers and riders that can provide and use ride-sharing services in a given region and the
ride-sharer’s growth in the region is limited by this. The ceiling for growth for E-commerce
players on the other hand, is much higher, as E-commerce platforms can be easily scaled
up to include more products and services.
Regulatory restrictions to limit take rate growth for ride-
sharers
Ride-sharers enjoy much better take rates than their E-commerce counterparts, as GMV,
comprising of the value of all goods traded through an ecommerce platform, often tends to
be significantly higher than gross bookings, which comprises of fare, taxes and driver pay.
Take rate for ride- Take rates for ride sharers vs. E-commerce
sharers is almost
5x higher than
E-commerce
Source: Companies, DBS Bank
However, going forward we believe there is limited headroom for ride-sharers to improve
their take rates substantially. Unlike E-commerce, which remains laxly regulated with
ample head room to improve its GMV take-rate (take rate of marketplace operators
depend on commissions, and the uptake of other services such as advertising, which
remain less vulnerable to regulations), growth in the take rate of ride-sharers is likely to be
capped by regulations.
In E-commerce, sellers on the platform often maintain a presence both online and
offline, and any attempt by the E-commerce platform to improve its take rate, by way of
increasing commissions or rates on advertising for example, are unlikely to significantly
impact the profitability of sellers on E-commerce platforms. Regulatory environment
surrounding E-commerce also is fairly lax, providing ample head room for E-commerce
players to improve their take rates and profitability if need be.DBS Asian Insights
SECTOR BRIEFING 75
35
Ride-sharing on the contrary is quite different. Most drivers on ride-sharing platforms are
dependent on the earnings made through the ride-sharing platform as their livelihoods.
Any attempt by ride-sharers to improve their take rate substantially would come at the
cost of lower pay for drivers, which at some point could be regulated. News of inadequate
pay made by drivers on ride-sharing platforms are plentiful and has caught the attention
of regulators around the globe, who are mulling fixating driver pay rates or contemplating
the recognition of drivers as employees of ride-sharers. Regulations on driver pay could
cap or even reduce the take rate of ride-sharers, impacting revenues and profitability
adversely. A classification or drivers as employees could be even worse resulting in heavy
staff costs for ride-sharers, substantially impacting profitability.
Can Automated Vehicles (AVs) increase the take rate of
ride-sharers?
The take rate of a ride-sharing business is expected to increase significantly when AVs
become common since driver pay is the most expensive element of a ride at present,
accounting for c. 75% of the total fare of a ride. All major ride sharers are in the process
of developing and testing AVs. However, the likes of Waymo (Alphabet’s self-driving arm)
and Cruise (General Motors), that lead the AV race are already trialing ride-sharing services
with their self-driving technologies, which could present a threat to existing ride-sharers.
Automobile manufacturers like Tesla have also expressed an interest in offering ride
sharing services through its vehicles as announced recently.
Progress in the self-driving space is measured by the average number of miles driven
before a manual override by a human driver is required. Waymo is almost 2x ahead of its
closest competitor by that metric.
Milles per manual intervention
Waymo 11,018
Cruise 5,205
Zoox 1,923
Nuro 1,028
Aurora 82
Toyota 2.54
Benz 1.47
Apple 1.15
Uber 0.35
Source: State of California department of motor vehiclesYou can also read