Ronald Lake Wood Bison Research Program: Applied ...
←
→
Page content transcription
If your browser does not render page correctly, please read the page content below
Ronald Lake Wood Bison Research
              Program:
                      2021 Semi-Annual Report
                            May 1, 2021

Garrett J. Rawleigh1,2, Lee J. Hecker1,2, Lindsey T. Dewart1,2,
         Darren M. Epperson1,2, Mark A. Edwards1,2,
                          and Scott E. Nielsen1
      1
          University of Alberta, Department of Renewable Resources
            2
                Royal Alberta Museum, Department of Mammalogy
Table of Contents
Executive summary                                                                       2
Background                                                                              4
Research progress                                                                       6
  How are wetlands used by bison in the winter? (Knowledge gaps 4a & 4c)                6
  How does spring green-up influence the annual migration? (Knowledge gaps 1d & 3a)     9
  What are the dynamics of wolf predation on bison? (Knowledge gaps 4c & 8e)          133
Conclusion                                                                             17
Acknowledgements                                                                       19
Literature cited                                                                      200

Report authors:
Garrett J. Rawleigh (MSc candidate)
Lee J. Hecker (PhD candidate)
Lindsey T. Dewart (MSc candidate)
Darren M. Epperson (Research Associate)
Mark A. Edwards (Curator of Mammalogy & Adjunct Professor)
Scott E. Nielsen (Professor)

*Cover photo credit to Lee Hecker

                                                                                        2
Executive summary
The Ronald Lake bison herd (RLBH) is a culturally and ecologically significant population of
wood bison (Bison bison athabascae) that is of management concern. The RLBH range is
located on the northern fringe of the Alberta oil-sands region, within an area of historic natural
resource exploration. The RLBH Technical Team, made up of representative members from
regional Indigenous communities, industry, and federal and provincial governments, was formed
to ascertain needed information for the sustainable management of the RLBH and its habitat. As
part of their mandate, the Technical Team identified a series of knowledge gaps related to the
herd’s ecology that would inform management. Starting in 2013, researchers from the University
of Alberta and Royal Alberta Museum were invited to develop a research program to help fill
some of these knowledge gaps. Here, we provide an update on research activities conducted
within this program since December 2020 (see prior year reports for description of previous
work) and describe methodologies related to research activities scheduled for summer 2021.
Specifically, questions related to knowledge gaps we report on here are:
       How are wetlands used by bison in the winter?
       How does spring green-up influence the annual migration?
       What are the dynamics of wolf predation on bison?
Our investigations into these questions yielded several interesting results. Firstly, our
examination of winter wetland forage sites reinforced the bison’s preference for a suite of sedges
(e.g., Carex atherodes C. utriculata, C. aquatilis) as their primary winter forage. Examination of
the herd’s seasonal migration indicates that the timing of migration to the spring range is closely
aligned with the onset and peak of spring, however, bison are not “surfing” the peak of spring
while migrating. Additionally, we found that habitat selection when leaving the spring range is
influenced by the rate of plant green-up and potential predation pressure. Bison represented 15%
of wolves’ winter diet, and predation pressure on bison increased later in the winter season when
snow exceeded 30-cm in depth.
In the spring and summer of 2021, we plan to conduct fieldwork to monitor water dynamics in
wetlands and their influence on bison’s preferred forage. Additionally, analyses will continue to
address knowledge gaps related to the influence of landscape disturbances on bison habitat
selection, possible mechanisms related to changes in wolf predation pressure on bison and
carrying capacity modelling under different scenarios.
Please note that with the COVID-19 pandemic, the fieldwork described here is conditional on
meeting safety precautions outlined by the University of Alberta and in accordance with the
Alberta Health Services protocols and the Government of Alberta.

                                                                                                 3
Background
The Ronald Lake wood bison (Bison bison athabascae) herd (RLBH) is a small (ca. 186
individuals) free-ranging population located in northeastern Alberta, Canada, named after a large
lake at the center of their annual range (Ball et al. 2016). The RLBH has a range that extends
from the southern portion of Wood Buffalo National Park (WBNP), north of current Alberta oil-
sands, east of the Birch Mountains and west of the Athabasca River. In addition to natural
disturbances like wildfire, anthropogenic disturbances related to timber harvesting and oil
exploration are present within the herd’s range. The herd is also thought to have had significant
recreational hunting pressure prior to 2017. A genetic inventory of bison herds in northern
Alberta and Northwest Territories found that the RLBH is distinguishable from neighbouring
herds in WBNP, with less genetic introgression from plains bison (B. b. bison; Ball et al. 2016).
The RLBH is further distinguishable from neighbouring WBNP herds by the lack of diseases
from domestic animals, including brucellosis and bovine tuberculosis (Shury et al.
2015). Additionally, the RLBH has significant ecological and cultural value, being central to the
traditional practices of numerous Indigenous communities. These factors resulted in the herd
receiving Subject Animal status under Alberta’s Wildlife Act (AEP & ACA, 2017). Wood Bison
are designated Special Concern under COSEWIC and Threatened on Schedule 1 of SARA.
The RLBH Technical Team, consisting of representative members from the regional Indigenous
communities, industrial parties, and provincial and federal government agencies, was established
to improve the ecological understanding of the RLBH and their habitat. The efforts of this
collaboration are intended to guide the sustainable management of the herd. The Technical Team
identified several significant ecological knowledge gaps (Table 1) and requested they be
addressed by the University of Alberta and Royal Alberta Museum researchers under a grant
supported by matching funds from industry and the federal government (NSERC). Between 2013
and 2021, Alberta Environment and Parks fitted 78 GPS telemetry radio-collars to 5 male and 69
female bison (4 females were re-collared in 2021). University and Royal Alberta Museum
researchers also collared three wolf packs in the area from 2019–2020 to examine potential wolf
predation of bison. Using data provided by these GPS radio-collars, researchers have
investigated: (1) seasonal/annual bison ranges and wolf territories; (2) bison migration to a
spring range with high quality forage; (3) conditions regulating the herd’s range; (4) mechanisms
influencing bison habitat selection; (5) reactions of bison to anthropogenic disturbances; and (6)
seasonal changes in bison and wolf diet selection and nutrition (Tan et al. 2015, DeMars et al.
2015, DeMars et al. 2016, Belanger et al. 2017, Belanger et al. 2018, DeMars et al. 2020, Hecker
et al. 2019a, Hecker et al. 2019b, Belanger et al. 2020, Dewart et al. 2020, Hecker et al. 2021,
Sheppard et al. 2021). Notable conclusions from this work are that:
   1. The same annual range is used regularly with predictable, seasonal changes;
   2. All female bison do a spring migration to their western range, which is associated with
      their calving period, using two distinct corridors that follow legacy seismic lines;
   3. The spring range contains higher quality forage compared to the rest of their annual
      range;
   4. Summer habitats with high forage biomass have less stable footing and more biting
      insects creating possible trade-offs between forage and predation;

                                                                                                4
5. Females avoid disturbances with ongoing industrial activity (i.e., oil sands exploration
      and forestry), but not those without activity;
   6. The small number of males sampled showed no response to anthropogenic activity;
   7. Movement rates are marginally faster on linear disturbances compared to other habitats
      suggesting the use of these features are mostly for movement and less for forage;
   8. Winter and spring diets are dominated by graminoids, while summer diets include more
      forbs and browse, but only winter diets have a significantly different nutritional content;
   9. Deep snow (>30 cm) decreased bison’s movement rates, while warmer temperatures
      facilitated an increase in their movements; and.
   10. The RLBH herd experienced greater predation pressure from wolves when snow depth
       exceeded 30-cm in depth, and the herd contributed up to 15% of winter wolf diet.
In this semi-annual report, we summarize the research conducted since December 2020 (Dewart
et al. 2020), build on earlier results, and describe the research planned for the remainder of 2021.

Table 1: Knowledge gaps identified by the Ronald Lake Bison Herd Technical Team reported
here, or completed, as conducted by the University of Alberta and Royal Alberta Museum
researchers.

Theme                   Gap #   Project                        Status                  Citation
Bison range             1A      Season & sex-specific ranges   Complete                DeMars et al. 2016
Bison range             1B      Northern extent (limits)       Complete                Hecker et al. 2019b
Bison range             1D      Migration routes               Complete                Hecker et al. 2019b
Habitat - Landcover     2A      Wetlands                       Update in this report   Hecker et al. 2019b
Habitat - Landcover     2D      Natural disturbances (fire)    Complete                DeMars et al. 2016
Forage (bottom-up)      3A      Greenup/phenology              Update in this report   Hecker et al. 2019b
Forage (bottom-up)      3C      Forage quantity/quality        Complete                Dewart et al. 2020
Forage (bottom-up)      3E      Anthropogenic changes          Update in this report   Dewart et al. 2020
Habitat use             4B      Trade-offs (insects/ground)    Complete                Belanger et al. 2020
Habitat use             4C      Winter snow                    Update in this report   Dewart et al. 2020
Popln ecol (top-down)   4C/8E   Wolf predation                 Update in this report   Dewart et al. 2020

                                                                                                              5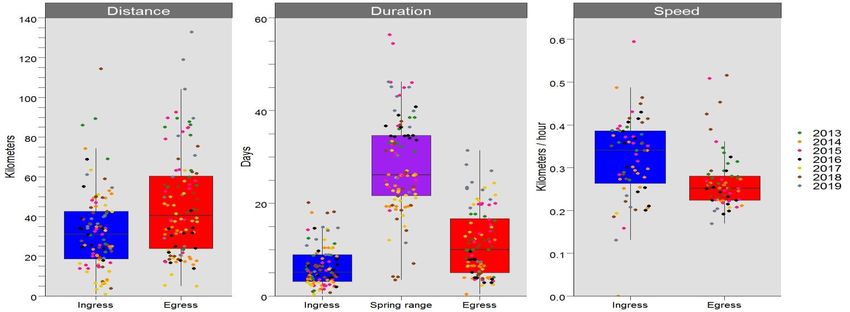
Research progress
How are wetlands used by bison in the winter?
Lead Investigator: Garrett J. Rawleigh
Research objectives
The objective of this work is to understand what environmental factors influence bison use of
wetlands during winter. This is important as wood bison rely almost exclusively on graminoid-
dominated wetlands for sustenance during winter due to a shortage of alternative forage (Strong
and Gates 2009; Jung 2015). Since last reported, we added 132 field plots to our examination of
bison’s winter foraging behaviour and have begun analyzing these data. We are also monitoring
wetlands using water-level loggers deployed in 2020 to quantify the environmental
characteristics that foster communities of preferred forage species, as highlighted in previous
reports (Dewart et al. 2020). Here, we examine how biotic (e.g., forage species) and abiotic
(snow characteristics) influence the selection of wetlands in the winter.
Overview of research methods
To examine winter foraging activity, we visited recently foraged wetland areas using clusters of
GPS locations from collared bison. These areas were selected by examining recent (i.e., less than
seven days old) GPS locations and choosing points accessible by trail or snowmobile. When we
arrived at these locations, we searched for recent craters, areas where bison have pushed snow
aside to access the forage beneath. After locating craters, we measured a suite of environmental
factors to understand how they influence foraging site selection. These factors include snow
characteristics (i.e., depth, density, crust hardness), distance to cover, wetland area, and
vegetation characteristics. We measured snow depth to the nearest 0.5-cm beyond the crater edge
in undisturbed snow, and for large craters, we took the average of up to three snow depth
measurements (Fortin 2005). Using a Snow-metrics snowboard sampler, we recorded snow
density at each site using the same locations as the depth measurements (Snowmetrics 2021).
Snow crust hardness was recorded as the presence or absence of a crust, and when present,
hardness was measured using the hand-hardness test (Höller and Fromm 2010). We visually
identified vegetation at the foraging site to the species level when possible and collected
vegetation clippings to confirm identification in the laboratory. The crater area was also
measured by walking the perimeter of craters with a handheld GPS unit. The crater area is being
tested as a potential response variable to the type of vegetation present. We recorded the foraging
intensity on each species present and assigned a numeric class on a scale of zero to four, with
zero representing no foraging and four representing foraging to the ground level. Foraging
intensity could be related to crater size or preference for specific forage species (Holecheck and
Galt 2000). As a comparison, the same variables were measured at non-use sites located near
each distinct crater.
Progress / results
During winter 2021, we added 132 paired sites to the 82 pairs sampled during winter 2020
(Figure 1). Early patterns suggest that bison prefer to forage on wheat sedge (Carex atherodes),
water sedge (C. aquatillis), and common yellow lake sedge (C. utriculata) despite grass being
the most encountered forage item (Figure 2). Wheat sedge was grazed at the highest average
intensity, showing consistency with previous research (Jung 2015). Further, we are examining

patterns in snow conditions, broader wetland characteristics, and a combination of these factors
to best identify why bison select specific areas within wetlands.
Outstanding/upcoming work
In the summer and fall of 2021, we will retrieve the groundwater level loggers deployed in 2020
and take additional biomass and substrate samples. Data will be used to relate the environmental
characteristics of wetlands to the abundance/biomass of preferred bison forage. We will also
continue to analyze winter forage and site selection to explain why bison select specific foraging
locations during the winter season.

Figure 1: Map of forage locations sampled from the RLBH during the winter seasons of 2020
(red) and 2021 (yellow). Corresponding non-use (available) paired sites were also surveyed near
each point shown.

                                                                                                7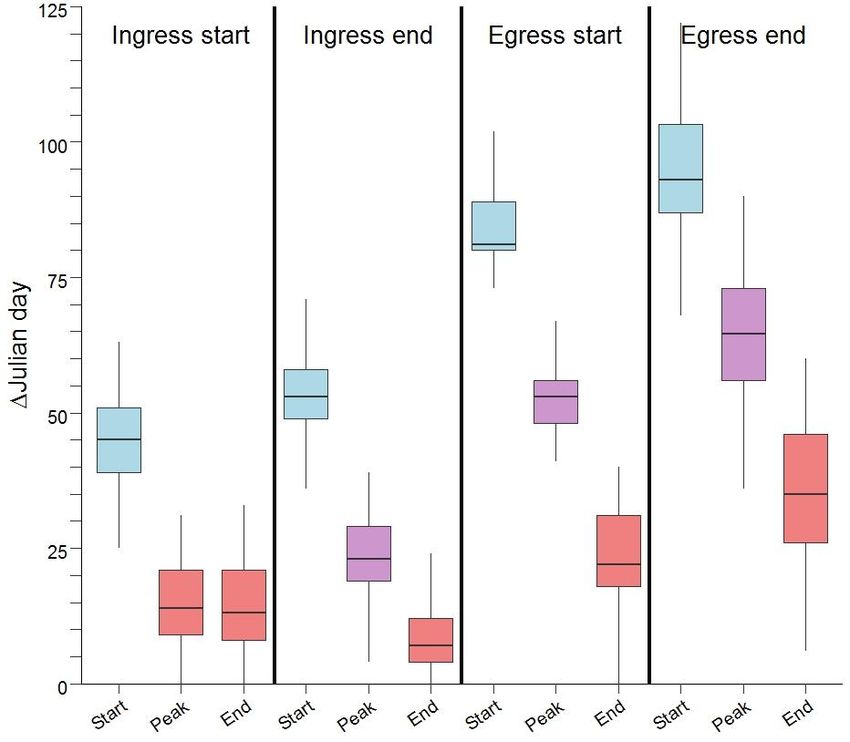
Figure 2: Bar graphs showing: (a) the number of encounters of each forage type in wetland
craters of wood bison (Bison bison athabascae) during the winters of 2020 and 2021 in the
Ronald Lake area, and (b) average grazing intensity of each forage type in a wetland crater of
wood bison in the winter of 2020 and 2021.

                                                                                            8
How does spring green-up influence the annual migration?
Lead Investigator: Lee J. Hecker
Research objectives
Here, we seek to understand the ecological factors influencing the migration of the RLBH during
spring. Annually, all collared females congregate in a spring range centered around an upland
meadow near where the McIvor River exits the Birch Mountains (Tan et al. 2014, Hecker et al.
2019b). By late June, the herd has returned to its core range east of the Birch Mountains and
centered around Ronald Lake. Previous research into this migratory behaviour has identified two
migration corridors that follow legacy seismic lines into the upland meadow. Additionally,
camera traps within the spring range have shown differences in seasonal habitat use by different
mammals, with bison and black bears (Ursus americanus) in greater abundance during May and
June and wolves (Canis lupus) from December through March (Belanger et al. 2017). We also
found that forage quality at bison locations inside the spring range, defined by normalized
difference vegetation index values, was higher than forages in the core range (Hecker et al.
2019b). Our objective here is to quantify the characteristics of this migration (i.e., distance,
duration, speed, strategy), assess the timing of the migration relative to the green-up of
vegetation in spring, and explore the influence of green-up and potential predation pressure on
habitat selection during migration.
Overview of research methods
We used GPS location data provided by 58 collared female bison to assess migration
characteristics from 2013–2019. We determined the migration period and strategy by calculating
net-squared displacement (NSD) using two different starting locations (Bunnefeld et al. 2011).
To determine the start and end dates of ingress (i.e., migration into the spring range) and egress
(i.e., migration out of the spring range), we set the starting location as the centroid of a minimum
convex polygon (MCP) calculated around all locations within the spring range (Tan et al. 2014).
We considered the start of ingress to be the first location of a contiguous set of locations with
decreasing NSD values (lower NSD indicates bison are closer to the spring range) and the end
location as the first location in that set with an NSD value less than 100. Similarly, egress was
defined as the first location of continuously increasing NSD values greater than 100 and the end
of egress to the location with the greatest NSD value in that set. Then, we calculated step length
(the distance in meters between two consecutive locations), duration (number of days between
the start and end of ingress/egress), and speed in km/hr for the migratory periods. For speed
statistics, we eliminated points >30-m apart because we were only interested in points that
represented traveling behaviour (Merkle et al. 2019). To determine migration strategy, we used
the starting location as the first ingress point and the end location as the final egress point and fit
movement models to describe three migration strategies: (1) migration for bison that started and
ended their migration in the same general area, (2) mixed migration, for bison that ended in a
different location than they started, and (3) dispersers, for bison that arrived at the spring range at
least 30 days before any other individual but then left the spring range with the rest of the herd
(Bunnefeld et al. 2011).
We investigated the timing and ecological factors influencing migration using a three-pronged
approach. First, we followed the methods of Bischof et al. (2012) and Merkle et al. (2017) to
determine the start, peak, and end of spring by calculating the instantaneous rate of green-up
(IRG) as the first derivative of the normalized difference vegetation index (NDVI). Then, we

                                                                                                     9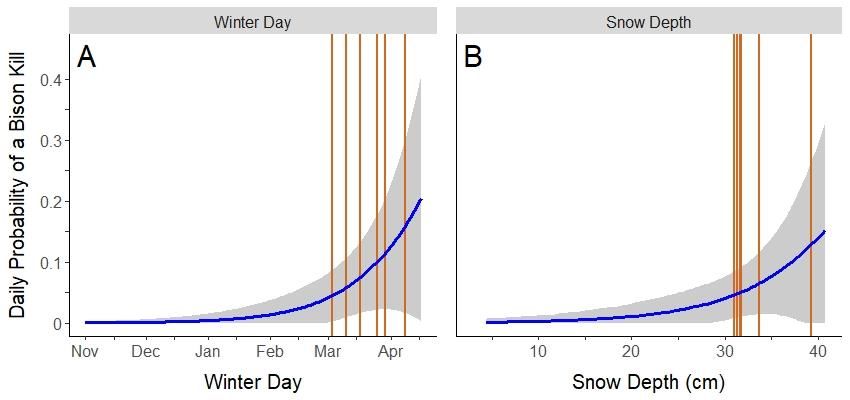
calculated the difference between the Julian day of the start and end of ingress and egress and the
median Julian day for the start, peak, and end of spring for 25 randomly selected points from
within the calving range. Next, to determine if the bison are following, surfing, or leading the
“green-wave” of increasing vegetation quality, we calculated the correlation between the Julian
day that bison occupied a location while migrating and the Julian day of peak IRG at each
location (Geremia et al. 2019). Lastly, to assess the influence of different ecological factors on
migration, we used paired-logistic regressions with individual bison and year as random-effects.
We compared habitat characteristics of bison (i.e., source) locations and 25 randomly placed
available (i.e., target) locations within the mean step-length (275-m) for all bison locations
during migratory periods (Merkle et al. 2017). We then created global models that included all
explanatory variables known to influence bison movements: distance between source and target
locations, landcover type (as defined by Duck’s Unlimited Enhanced Wetland classification and
using Upland Deciduous as the reference landcover type), ground-wetness (calculated using the
compound topographic index) as a proxy for footing, NDVI, integrated NDVI (the sum of all
NDVI values at a location, considered an estimation of biomass), and distance to linear
disturbance (Pettorelli et al. 2005, Merkle et al. 2017, Belanger et al. 2020, DeMars et al. 2020).
Then, using Akaike Information Criterion (AIC) to determine improvement in models, we added
IRG values to the global model to see if the green-wave is a factor influencing migration
(Burnham and Anderson, 2002). In 2019, we had wolves collared in two packs within the bison’s
range during the migration period. Therefore, we analyzed an additional set of models for 2019,
adding predation pressure (calculated as cumulative Brownian bridge movement values; Horne
et al. 2007), IRG, and both as additional predictors to the global model (Horne et al. 2007).
Progress / preliminary results
We found a minimal correlation between bison location Julian day and maximum IRG Julian day
during ingress (Pearson’s correlation = 0.19) and egress (Pearson’s correlation = 0.13) (Figure
5). This result indicates minimal green-wave surfing. During ingress, IRG values did not
improve the global paired-logistic regression model (AIC = 0.64, relative to global model), but
during egress, IRG values did improve the global model (AIC = -42.14). In 2019, the global
model for ingress was also not improved by adding IRG (AIC = 0.88), predation pressure
(AIC = -1.97), or both IRG and predation pressure (AIC = -0.89). However, 2019 egress
global models were improved by the inclusion of predation pressure (AIC = -148.24) and both
IRG and predation pressure (AIC = -148.86), but not IRG (AIC = 0.69). From these models,
we can conclude that IRG and predation pressure have a greater influence on the habitat
selection during egress than ingress.
Outstanding/upcoming work
We consider this the conclusion of our investigation into how spring green-up influences the
annual migration of the RLBH. The green-wave does influence the timing of bison migration,
but only affects habitat selection along migration corridors during egress. We will be testing new
sets of logistic regressions exploring the influence of IRG and predation on migration with
random locations selected from a larger radius (third quantile around mean, upper limited of 95%
confidence interval of mean, and mean, maximum distance moved in 90-min) around the target
location. An update will be provided in the 2021 annual report describing if and how wider
ranging random locations changes model results. Future studies could consider exploring the
social mechanisms influencing the migration, predicting whether or not individuals are pregnant
10based on movement behaviour, or the predation potential of black bears on calves (Belanger et
al. 2017).
Figure 3: Boxplots showing the differences in the timing of various migration events (Ingress
start, Ingress end, Egress start, Egress end) relative to the start, peak, and end of the spring green-
up of vegetation as measured by the instantaneous rate of green-up. Differences were calculated
as the absolute value of the difference in Julian date of the start, peak, and end of spring and the
four Julian dates of the four migration events. Colours indicate boxes that are significantly
different with blue boxes have significantly higher differences, red have significantly lower
differences and purple are significantly different at an intermediate level.
11Figure 4: Summary statistics for migration metrics of distance, duration, and speed. Ingress (red)
is the migration into the spring range (purple), and egress (blue) is the migration out of the spring
range. Each dot represents the total distance travelled, total during of travel, or mean travel speed
for an individual bison within a single year. The colours of each dot represent a single year.
Figure 5: Relationship of Julian day of bison presence at a location and Julian day of the
maximum IRG value at the same location. The top-left (purple) region of the plot indicates bison
locations before the green-wave arrives, the central-diagonal (white) region is bison surfing the
green-wave, and the bottom-right (green) region are bison at locations after the green-wave has
passed. The black, diagonal line indicates a hypothetical perfect green-wave surfer. For
reference: Julian day 100 is April 10, 125 is May 6, 150 is May 30, 175 is Jun 24, 200 is July 19,
and 225 is August 13 (add one to each Julian day for leap years like 2016).
12What are the dynamics of wolf predation on bison?
Lead investigator: Lindsey T. Dewart
Research objectives
To assess potential predation effects on the RLBH, we focused our analysis on wolf predation
pressure. In systems with multiple abundant and accessible prey types, wolves will most often
select for species that will not only offer sufficient biomass to sustain the pack, but that are easier
to catch with relatively low risk of injury (Becker et al. 2008; Mattioli et al. 2011). Wolf prey
selection is dynamic and highly variable in different systems and can often change seasonally
due to changes in abundance, accessibility, and vulnerability (Carbyn et al. 1993; Huggard 2011;
Smith et al. 2000). These drivers of prey selection can also motivate alternative selection within
seasons, such as calving periods or harsh winter conditions. In systems that include bison,
wolves often choose to hunt other prey species but may alter selection toward bison when they
are more vulnerable in late winter (Jaffe 2001; Smith et al. 2000). Our objectives were to
examine the diet of wolf packs whose territories overlapped the RLBH and temporal factors
influencing their predation success on bison. Further, in the winter season, we examine wolf
space use relative to bison by assessing wolf use of areas frequented by bison during times of
varying bison vulnerability.
Overview of research methods
We affixed GPS radio-collars to wolves of three different packs whose territories overlapped the
bison range. Movements of wolves and bison were monitored through the winter to determine
the ranges and overlap of each species using locations and 99% utilization distributions (UDs)
for early (1 November 2019 – 6 February 2020) and late (7 February – 17 April 2020) winter
(Worton 1989). Cluster analysis was used to identify potential kill sites prioritized by handling
time (i.e., continuous-time spent within a 200-m radius; Webb et al. 2008) for field investigation.
Site investigations consisted of systematically searching for prey remains to identify species and
evidence to confirm a wolf kill occurred, such as broken branches, blood, or signs of a struggle.
Winter (1 November 2019 – 17 April 2020) wolf diets were quantified by both the percent
occurrence and biomass of each prey species found at kill sites specific to each wolf pack.
Snow depth, temperature, and stage of the winter season (i.e., days since first snowfall) were
examined separately in generalized linear models used to test for temporal patterns in successful
wolf predatory events of bison. Daily snow depths were measured by averaging the snow depth
recorded from four snow stations placed in different habitat types within the study area. Daily
temperature measures were averaged between the two nearest weather stations to the study area
(Aurora and Mildred Lake; Alberta Agriculture and Forestry 2020).
Progress / preliminary results
Wolf packs included the McIvor (n = 6 adults), Dianne (n = 2 adults), and Southline (n = 9
adults) packs, named for dominant landscape features within their ranges, and a sample of
wolves from each pack were monitored with GPS collars from April 2019 – April 2020. In
winter there were 321 GPS clusters, of which 58 were prioritized and visited on the ground.
Confirmed kill sites of large mammals were discovered at 38 of the 58 sites (66%). Specifically,
we visited 22 Dianne pack, 20 McIvor pack, and 16 Southline pack cluster sites, finding remains
of 14 deer, 13 moose, six bison, three wolves, and two black bears at confirmed kill sites and an
additional three scavenged moose.
13Wolves consumed an average of 14.87 kg of prey biomass/pack/day and 2.69 kg of prey
biomass/wolf/day. The Dianne pack killed the greatest number of prey over winter and
consumed the most biomass per wolf but the least biomass per pack relative to the other packs
(Figure 6). In contrast, the McIvor and Southline packs had a similar number of kills, but with
significantly higher biomass consumed per pack relative to the Dianne pack (Figure 6). Total
prey biomass consumed was variable between the three packs, with the Dianne pack consuming
an estimated 6.29 kg per day in winter, the McIvor pack consuming 12.09 kg, and the Southline
pack consuming 26.23 kg (Figure 6). Moose provided the most biomass of the prey types to the
McIvor (53%) and Southline (60%) packs, while deer provided the most biomass to the Dianne
pack (50%). The Southline pack showed the least diverse diet, with moose comprising an
estimated 60% of their available biomass.
Bison represented 40% of McIvor pack killed biomass, while bison contributed 35% to the
Southline pack total. Bison kills occurred later in winter relative to cervids, with the first record
of a bison kill occurring on 3 March 2020 when snow depths exceeded 30-cm (Figure 7). To
investigate this trend, winter conditions on days that bison kills occurred were compared to
winter conditions over the rest of the winter to reveal possible temporal patterns associated with
successful wolf predation events on bison. The probability of a bison kill on any given day in the
winter season was best supported by the number of days since first snow accumulation (i.e.,
Winter day; ∆ AIC = 0; β = 0.048; S.E. = 0.020, P = 0.015; pseudo R2 = 0.25; Table 2). Results
showed that the probability of wolves killing a bison began to increase in early February and
increased further until mid-April during the initiation of snowmelt (Figure 8). Snow depth was
also a significant predictor of the timing of bison kills (∆ AIC = 5.9; β = 0.150; S.E. = 0.080, P =
0.050; pseudo R2 = 0.14), but was less supported than the number of days since first snow
accumulation (Table 2). Results showed that the probability of wolves killing a bison began to
increase at a 20-cm snow depth and continued to increase beyond 40-cm (Figure 8).
Outstanding/upcoming work
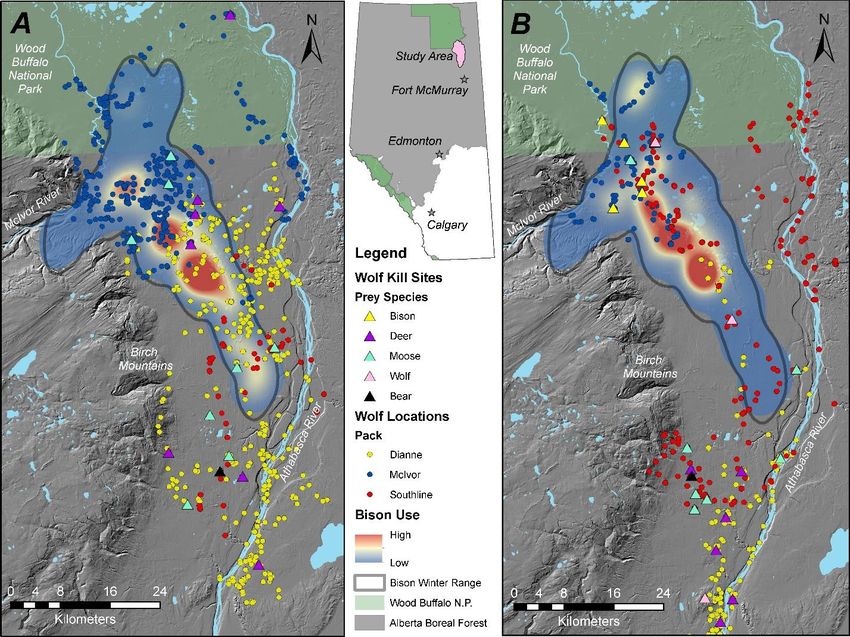
We are currently examining wolf habitat use relative to bison within the bison range (Figure 9)
and testing for significant changes between early (1 November 2019 – 6 February 2020) and late
(7 February – 17 April 2020) winter, when bison predation risk begins to increase. Preliminary
models indicate that although wolves used the RLBH home range more in early winter than late
winter, they used areas of high bison utilization more in late winter when within the RLBH
range.
14Figure 6: Winter (1 November 2019 – 17 April 2020) diet of the Dianne, McIvor, and Southline
wolf packs in the Ronald Lake area of Alberta, Canada, analyzed by biomass consumed per day
of each prey type for pack (coloured) and individual wolf (hashed).
Figure 7: Timing of large prey kills (vertical lines) of the Dianne (top), McIvor (middle) and
Southline (bottom) wolf packs in relation to snow depth (cm, continuous black line), grouped by
prey type through the winter season (1 November 2019 – 17 April 2020) near Ronald Lake,
Alberta, Canada. Grey areas represent the time that wolf packs were not monitored.
15Table 2: Univariate generalized linear models testing the effects of snow depth, temperature, and
winter day (days since first snow accumulation) on bison mortality events from wolves over the
period from 1 November 2019 – 17 April 2020 near Ronald Lake, Alberta, Canada. Akaike
Information Criteria (AIC) was used to rank support of models.
Predictor Variable df AIC ∆ AIC
Winter Day 2 42.7 -
Snow Depth 2 48.6 5.9
Null 1 53.8 11.1
Temperature 2 55.6 12.9
Number of Packs 2 55.8 13.1
Figure 8: Predicted daily probability of a bison kill from wolves over the period 1 November
2019 – 17 April 2020 near Ronald Lake, Alberta, Canada, based on logistic regression models.
(A) The effect of winter day (i.e., days since first snow accumulation); and (B) snow depth. The
grey area and orange lines represent the 95% confidence intervals and bison kill events,
respectively.
16Figure 9: Dianne, McIvor, and Southline wolf pack predation sites and territory overlap with the
bison range represented as 99% utilization distribution near Ronald Lake, Alberta, Canada. Panel
A represents early winter (1 November 2019 – 6 February 2020), and panel B shows late winter
(7 February – 17 April 2020), when the probability of a bison kill begins to increase.
17Conclusion
Since December 2020, we have continued research on a set of selected knowledge gaps set forth
by the RLBH Technical Team. Most recently, we have been investigating the relationship
between bison and wetlands and their winter conditions, the seasonal migration of the RLBH,
and predation pressure on the RLBH by resident wolf packs.
We can see early patterns of bison’s forage preferences, with their selection of various sedge
species as primary winter forage, with wheat sedge holding particular importance. Seasonal
migration occurred in time with the peak onset of spring; however, there is no evidence
suggesting that the RLBH is “surfing” this peak. Wolf predation pressure was shown to increase
later in the winter season, specifically when snow exceeded 30-cm in depth. Also, bison were
found to make up 15% of wolves' total diet.
We will be continuing our research through the spring and summer of 2021. This research
includes monitoring wetland dynamics (i.e., water levels) to understand the vegetation structure
of wetland communities and which environmental conditions are associated with bison’s
preferred winter forage. We will also continue to examine the influence of landscape
disturbances on bison habitat selection and carrying capacity models under different landscape
change scenarios. Finally, we will be finalizing our work on the possible mechanisms
influencing wolf predation pressure on the herd.
18Acknowledgements
There are many people and organizations we would like to thank for making this research
possible. We thank our partners Craig Dockrill, Joann Skilnick and Troy Hegel from Alberta
Environment and Parks, and Karen Halwas and Neil Sandstrom with Teck Resources Limited.
We would like to acknowledge the following local community members and trappers for their
assistance: Roy Ladouceur, Mike Berdinski, and Chuck Shovelup. We are also thankful for all
the field technicians that have helped with data collection: Robert Belanger, Alex Coley, Melissa
Dergousoff, Ashley Hillman, Neal Josephs, Aidan Sheppard, and Adam Scharnau. We are
thankful for the support of the Ronald Lake Bison Herd Technical Team. Further, we are
incredibly grateful to the Treaty 8 First Nations that sit on the Technical Team, including
Athabasca Chipewyan First Nation, Mikisew Cree First Nation, Fort MacMurray First Nation
#468, and Fort McKay First Nation, and for the Métis Indigenous groups that are involved with
the Technical Team, including Fort Chipewyan Métis Local 125, Fort McMurray Métis Local
1935, Fort McKay Métis 63, and Lakeland Métis Local 1909. Finally, we would like to thank
our funders Teck Resources, the Natural Sciences and Engineering Research Council (NSERC),
the Alberta Conservation Association, the Northern Scientific Training Program, and the
University of Alberta’s Northern Research Awards.
19Literature Cited
Alberta Environment and Parks and Alberta Conservation Association. 2017. Status of the
American Bison (Bison bison) in Alberta: Update 2017. Alberta Environment and Parks.
Alberta Wildlife Status Report No. 38 (Update 2017). Edmonton, AB. 134 pp.
Alberta Agriculture and Forestry. 2020. Alberta Climate Information Service (ACIS). Alberta
Government. https://acis.alberta.ca
Ball, M.C., T.L. Fulton, and G.A. Wilson. 2016. Genetic analyses of wild bison in Alberta,
Canada: implications for recovery and disease management. Journal of Mammalogy.
97(6): 1525-1534.
Becker, M.S., R.A. Garrott, P.J. White, C.N. Gower, E.J. Bergman, and R. Jaffe. 2008. Chapter
16 Wolf prey selection in an elk-bison system: choice or circumstance? Terrestrial
Ecology. 3:305-337.
Belanger, R.B., C.A. DeMars, L.J. Hecker, M.A. Edwards, and S.E. Nielsen. 2017. Ronald Lake
wood bison annual report: November 30, 2017. Ronald Lake Bison Report. University of
Alberta, Edmonton, Alberta, Canada T6G 2H1. 76 pp.
Belanger, R.J., L.J. Hecker, L.T. Dewart, S.E. Nielsen, and M.A. Edwards. 2018. Ronald Lake
Wood Bison Research Program: Annual Report 21 December 2018. University of
Alberta, Edmonton, Alberta, Canada T6G 2H1. 30 pp.
Belanger, R.J., M.A. Edwards, L.N. Carbyn, and S.E. Nielsen. 2020. Evaluating trade-offs
between forage, biting flies, and footing on habitat selection by wood bison (Bison bison
athabascae). Canadian Journal of Zoology. 98(4):254-261.
Bischof, R., L. E. Loe, E. L. Meisingset, B. Zimmermann, B. van Moorter, and A. Mysterud.
2012. A migratory northern ungulate in pursuit of spring: Jumping or surfing the green
wave? The American Naturalist, 180(4):407-424.
Bjørneraas, K., B. Van Moorter, C.M. Rolandsen, and I. Herfindal. 2010. Screening global
positions system location data for errors using animal movement characteristics. Journal
of Wildlife Management. 74(6):1361-1366.
Bunnefeld, N., L. Börger, B. van Moorter, C.M. Rolandsen, H. Dettki, E.J. Solberg, and G.
Ericsson. 2011. A model‐driven approach to quantify migration patterns: individual,
regional and yearly differences. Journal of Animal Ecology. 80(2):466-476.
Burnham, K.P., and D.R. Anderson. 2002. Model selection and multi-model inference: a
practical information-theoretic approach, 2nd ed. Springer, New York.
DeMars, C.A., S.E. Nielsen, and M.A. Edwards. 2015. Ronald Lake Bison (Bison bison): Project
Update. University of Alberta, Edmonton, Alberta, Canada T6G 2H1. 26 pp.
DeMars, C.A., S.E. Nielsen, and M.A. Edwards. 2016. Range use, habitat selection and the
influence of natural and human disturbance on wood bison (Bison bison athatbascae) in
the Ronald Lake area of northeastern Alberta. University of Alberta, Edmonton, Alberta,
Canada T6G 2H1. 80 pp.
DeMars, C.A., S.E. Nielsen and M.A. Edwards. 2016. Range use, habitat selection, and the
influence of natural and human disturbance on wood bison (Bison bison athabascae) in
the Ronald Lake area of northeastern Alberta. Technical report prepared for the Ronald
Lake Wood Bison Technical Committee. University of Alberta, Edmonton, AB. 79p.
DeMars, C.A., S.E. Nielsen, and M.A. Edwards. 2019. Effects of linear features on resource
selection and movement rates of wood bison (Bison bison athabascae). Canadian
Journal of Zoology. 98(1):21-31.
20Dewart, L.T., Hecker, L.J. Epperson, D.M., Rawleigh, G., Sheppard, A.H.C., Nielsen, S.E. and
Edwards, M.A. 2020. Ronald Lake Wood Bison Research Program: 2020 Annual Report.
Report to the Ronald Lake Bison Herd Science Technical Team, December 1, 2020.
University of Alberta, Edmonton, Alberta, Canada T6G 2H1, 43 pp.
Ducks Unlimited Canada. March 2016. "Ronald Lake Bison Herd Enhanced Wetland
Classification User's Guide." 69 pp. Ducks Unlimited Canada, Edmonton, Alberta.
Prepared for: Government of Alberta (Alberta Environment and Parks).
Carbyn, L.N., S.M. Oosenbrug, and D.W. Anions. 1993. Wolves, bison, and the dynamics
related to the Peace-Athabasca Delta in Canada’s Wood Buffalo National Park. Journal
of Wildlife Management. 59(1).
Fortin, D. 2005. Elk winter foraging at fine scale in Yellowstone National Park. Oecologia.
145(2):335- 343.
Geremia, C., J.A. Merkle, D.R. Eacker, R.L. Wallen, M. Hebblewhite, and M.J. Kauffman.
2019. Migrating bison engineer the green wave. Proceedings of the National
Academy of Sciences. 116(51):25707-25713.
Hecker, L.J., L.T. Dewart, R.J. Belanger, S.E. Nielsen, and M.A. Edwards. 2019a. Ronald Lake
wood bison research program: Semi-annual progress report 2019. University of Alberta,
Edmonton, Alberta, Canada, T6G 2H1. 19 pp.
Hecker, L.J., L.T. Dewart, D. Epperson, M.A. Edwards, and S.E. Nielsen. 2019b. Ronald Lake
wood bison research program: 2019 annual report. University of Alberta, Edmonton,
Alberta, Canada, T6G 2H1. 46 pp.
Hecker, L.J., L.T. Dewart, D.M. Epperson, G.J. Rawleigh, A.C. Sheppard, S.E. Nielsen, and
M.A. Edwards. 2020a. Ronald Lake wood bison research program: 2020 semi-annual
report. University of Alberta, Edmonton, Alberta, Canada, T6G 2H1. 37 pp.
Hecker, L.J., S.C.P. Coogan, S.E. Nielsen, and M.A. Edwards. 2021. Latitudinal and seasonal
plasticity in American bison Bison bison diets. Mammal Review. 51(2):193-206.
Höller, P., and R. Fromm. 2010. Quantification of the hand hardness test. Annals of
Glaciology. 51(54):39-44.
Horne, J.S., E.O. Garton, S.M. Krone, and J.A. Lewis. 2007. Analyzing animal movements
using Brownian bridges. Ecology. 88(9):2354-2363.
Holecheck JL, Galt D. 2000. Grazing intensity guidelines. Rangelands Archives. 22(3):11-4.
Huggard, D. 2011. Prey selectivity of wolves in Banff National Park. I. Prey species. 2011.
Canadian Journal of Zoology. 71(1):130-139.
Jaffe, R. 2001. Winter wolf predation in an elk-bison system in Yellowstone National Park,
Wyoming. Montana State University, Bozeman, Montana, U.S.A.
Johnson, D.H. 1980. The comparison of usage and availability measurements for evaluating
resource preference. Ecology. 61(1):65-71.
Jung, T.S. 2015. Winter diets of reintroduced bison (Bison bison) in northwestern Canada.
Mammal Research. 60(4):385–391.
Mattioli, L., C. Claudia, A. Gazzola, M. Scandura, and M. Apollonio. 2011. Prey selection and
dietary response by wolves in a high-density multi-species ungulate community.
European Journal of Wildlife Research. 57:909-922.
Merkle, J. A., J. R. Potts, and D. Fortin. 2017. Energy benefits and emergent space use patterns
of an empirically parameterized model of memory-based patch selection. Oikos,
126(2):185-195.
21Merkle, J.A., H. Sawyer, K.L. Monteith, S.P.H. Dwinnell, G.L. Fralick, and M.J. Kauffman.
2019. Spatial memory shapes migration and its benefits: evidence from a large herbivore.
Ecology Letters. 2019(22):1797-1805.
Morellet, N. H. Verheyden, J.M. Angibault, B. Cargnelutti, B. Lourtet, and M.A.J. Hewison.
2007. The effect of capture on ranging behaviour and activity of the European roe deer
Capreolus careuolus. Wildlife Biology. 15(3):278-287.
Pettorelli. N., J. O. Vik , A. Mysterud, J. M. Gaillard, C. J. Tucker, and N. C. Stenseth. 2005.
Using the satellite derived NDVI to assess ecological responses to environmental
change. Trends in Ecology and Evolution, 20(9):503-510.
Sheppard, A.H.C., L.J. Hecker, M.A. Edwards, and S.E. Nielsen. 2021. Determining the
influence of snow and temperature on the movement rates of wood bison (Bison bison
athabascae). Canadian Journal of Zoology. 99(6):489-496.
Shury, T. K., J. S. Nishi, B. T. Elkin, and G. A. Wobeser. 2015. Tuberculosis and brucellosis in
wood bison (Bison bison athabascae) in northern Canada: a renewed need to develop
options for future management. Journal of Wildlife Disease. 51(3)543-554.
Smith, D., D. Mech, M. Meagher, W. Clark, R. Jaffe, M. Phillips, and J. Mack. 2000. Wolf-bison
interactions in Yellowstone National Park. Journal of Mammalogy. 81(4):1128-1135.
Snowmetrics. 2021. Fort Collins, Colorado. https://snowmetrics.com/.
Strong, W.L., and C.C. Gates. 2009. Wood bison population recovery and forage
availability in northwestern Canada. Journal of Environmental Management.
90(1):434-40.
Tan, T., M. A. Edwards, and S. E. Nielsen. 2014. Ronald Lake Bison (Bison bison) March –
December 2013 telemetry data study. University of Alberta, Edmonton, Alberta,
Canada T6G 2H1. 18 pp.
Tan, T., S.E. Nielsen, and M.A. Edwards. 2015. Ronald Lake bison (Bison bison) preliminary
summary report: March 2013 – March 2014 telemetry data study. University of Alberta,
Edmonton, Alberta, Canada T6G 2H1. 55pp.
Webb, N.F., M. Hebblewhite, and E.H. Merrill. 2008. Statistical methods for identifying wolf
kill site using global positioning system locations. Journal of Wildlife Management.
72(3):798-807.
Worton, B.J. 1989. Kernel methods for estimating the utilization distribution in home-range
studies. Ecology. 70(1):164-168.
22You can also read