Rotational invariant speckle scanning ultrasonography through thick bones
←
→
Page content transcription
If your browser does not render page correctly, please read the page content below
www.nature.com/scientificreports
OPEN Rotational‑invariant
speckle‑scanning ultrasonography
through thick bones
Siyi Liang & Lidai Wang*
Ultrasonography is a major medical imaging technique that has been broadly applied in many disease
diagnoses. However, due to strong aberration and scattering in the human skull, high-resolution
transcranial ultrasonic imaging remains a grand challenge. Here, we explore the rotational-invariant
property of ultrasonic speckle and develop high-resolution speckle-scanning ultrasonography to
image sub-millimeter-sized features through thick bones. We experimentally validate the rotational
invariance of ultrasonic speckle. Based on this property, we scan a random ultrasonic speckle pattern
across an object sandwiched between two thick bones so that the object features can be encoded
to the ultrasonic waves. After receiving the transmitted ultrasonic waves, we reconstruct the image
of the object using an iterative phase retrieval algorithm. We successfully demonstrate imaging of
hole and tube features sized as fine as several hundreds of microns between two 0.5 ~ 1-cm-thick
bones. With 2.5-MHz excitation and the third-harmonic detection, we measure the spatial resolution
as 352 µm. Rotational-invariant speckle-scanning ultrasonography offers a new approach to image
through thick bones and paves an avenue towards high-resolution ultrasonic imaging of the human
brain.
Ultrasonography is a major medical imaging technique offering high-resolution anatomical and functional
information. Taking advantage of low cost, label-free, high speed, and deep penetration in soft tissue, ultrasonic
imaging has been widely used in many anatomical sites. However, due to strong aberration/multiple scattering
in the thick skull, ultrasonography has not been extensively applied to the human brain.
Several techniques, such as time-reversal1,2, speckle b
rightness3,4, and pitch-catch m
ethods5, have been devel-
oped based on phase correction towards solving the aberration problem in the skull. The time-reversal technique
can mitigate weak aberration but become ineffective for strong aberration. The speckle brightness method uses
an iterative phase compensation algorithm to improve beamforming quality. The pitch-catch method corrects
skull-induced phase abbreviations in pulse-echo images. Both techniques are restricted to a thin layer of bone
near the transducer. O’Reilly et al.6 employed a passive imaging technique and low ultrasonic frequency to reduce
scattering. The use of low frequency leads to a poor spatial resolution of several m illimeters7. Via choosing a
8
thinner and less aberration region, Lindsey et al. have developed a helmet-like imaging system to reduce aber-
ration at the cost of a compromised resolution. Ultrasonic imaging through the human skull at high resolution
still remains an open challenge. Singular value decomposition (SVD) beamformer is also proposed to correct
aberration effects9.
Some imaging methods utilizing multiple scattering have also been proposed10. These methods exploit coher-
ence along the array response matrix. These authors then term this antidiagonal coherence as ‘memory effect’11.
Here, we explore a rotational-invariant property of ultrasonic speckle. Contrary to ‘memory effect’ in11,
this property is not operated in frequency domain. Our finding may be related to van Cittert-Zernike (VCZ)
theorem12,13. Based on this property, we develop a new imaging technique, named rotational-invariant speckle-
scanning ultrasonography, to acquire high-resolution ultrasonic images through thick bones.
Principle of methods
The rotational-invariant property is described as follows. When an ultrasound wave passes through a strong
acoustic scattering medium, we can obtain a random but stable speckle pattern. Tilting the incident beam by a
small angle causes rotation or translation of the speckle pattern behind the scattering medium, and the speckle
pattern remains almost the same within a certain angular range. Using the rotational-invariant property, we can
scan the random speckle pattern behind strong scatterers.
Department of Biomedical Engineering, City University of Hong Kong, 83 Tat Chee Ave, Kowloon, Hong Kong SAR,
China. *email: lidawang@cityu.edu.hk
Scientific Reports | (2021) 11:14178 | https://doi.org/10.1038/s41598-021-93488-y 1
Vol.:(0123456789)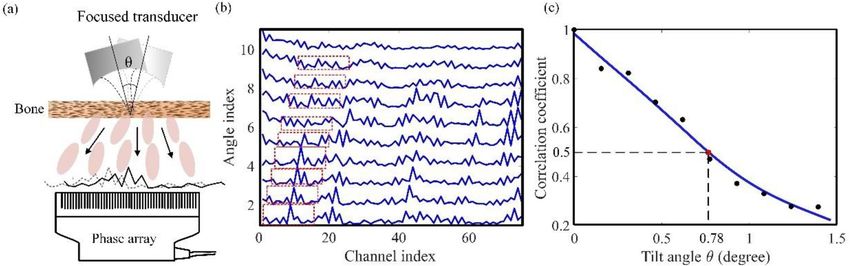
www.nature.com/scientificreports/
When scanning the ultrasonic speckle pattern across an object, we can detect the total backscattered or
transmitted signal I as a function of the incident angle θ as
I(θ ) = ∫ O(r)S(Lθ − r)dr = (O ∗ S)(θ )
where r is the position in the region of interest, L is the distance between the scatterer and the object, O(r) denotes
the object function, and S(Lθ − r) denotes the speckle pattern at the incident angle θ and the distance L, and ∗
denotes the spatial convolution. Taking autocorrelation of the intensity profile I(θ ), we obtain
|I ⋆ I| = |(O ∗ S) ⋆ (O ∗ S)|
where ⋆ denotes autocorrelation operation, |·| denotes ensemble average of different speckle realizations. Accord-
ing to the property of autocorrelation of convolution14, i.e., (a ∗ b) ⋆ (a ∗ b) = (a ⋆ a) ∗ (b ⋆ b), we can obtain
|I ⋆ I| = (O ⋆ O) ∗ |S ⋆ S|
Ensemble averaged autocorrelation of random speckle patterns |S ⋆ S| is a Dirac delta function. Thus, we can
simplify the above equation as
|I ⋆ I| = O ⋆ O
In such a way, we can obtain the autocorrelation function of the original object, from which we can further
recover the image of the object using a Gerchberg–Saxton-type iterative phase retrieval a lgorithm15.
To reconstruct the object function, we calculate Fourier transform of the autocorrelation of the measured
signal I to obtain the magnitude of the object’s power spectrum, i.e. F[O ⋆ O] = F 2 [O], where F denotes the
Fourier transform. The object function can be reconstructed from its magnitude and phase spectra. The phase
spectrum is lost but can be estimated using the phase retrieval algorithm. First, a random pattern Ph0 [O] is
assigned as the initial phase. Then an object function value can be calculated from the magnitude and the phase
spectra. Because the object function value is always real and positive, we can use this constraint to tune the next
phase pattern Phi [O] so that the retrieved object function fulfills the real and positive constraint. Repeating this
process, the retrieved results will gradually converge to the true object function.
Materials and methods
Experiment set‑up. Marrowbone bought from market is cleaned and chopped into the proper size and
ground with sandpaper sheets with 1000 grits (9083NA-20, 3 M) to a desired thickness, animals/humans were
not directly involved in the study. To validate the memory effect for scattered ultrasound: A lab-made 2.5-
MHz focused transducer is connected to a Pulser-Receiver (5072PR, OLYMPUS) and put in a water tank filled
with deionized water, a rotation stage (KSP-606 M, SIGMAKOKI) is fixed at the bottom of the water tank.
Previously made bone is fixed at the axis of rotation. The Pulser-Receiver is also connected to a digital oscillo-
scope (TBS1104, Tektronix). Echoes are observed on the oscilloscope when adjusting the rotation stage. Relative
change of the amplitude should be small otherwise the position between the transducer and bone should be
adjusted. After the tunning is done, the transducer is connected to an arbitrary waveform generator (DG4062,
RIGOL). A phased array transducer (P4-1, ATL) is also fixed at a distance to the bone and make sure they rotate
to the same point/axis. The transducer array is 10.5-cm away from the bone. We rotate the emitting transducer
around its focal point. The rotational step size is 0.23 degrees. At every angle, 5 frames of ultrasound radio fre-
quency (RF) data is collected.
For the 2.5-MHz pulse emission, we set a 300-mV amplitude, 8-cycle number, and a 5-ms duration as the
stimulation signal and the sampling rate is 10 MHz.
The first imaged objects are printed with a Stratasys Fortus 400mc System using photosensitive resin (model
9400). During experiments, it is fixed with the rotation system together with another bone close to the phased
array. A high power amplifier (LZY-22 + , Mini-Circuits) is connected to the arbitrary waveform generator and
then to the focused transducer to ensure the signal-to-noise ratio. The object is kept 10.5-cm away from bone
1 and the scanning step size is 0.116 degrees. During tube imaging experiments, homemade microbubbles are
pumped into a capillary tube using a syringe pump, then the tube is sealed. This capillary tube is kept 4-cm
away from Bone_in. The phased array position is also adjusted to several millimeters away from Bone_out. The
sampling frequency is 24 MHz to acquire the third harmonic signal according to Nyquist Theorem. A digital
band-pass filter centered at 7.5 MHz (40-kHz passband) is applied to the RF data. The scanning step size is
0.0775 degrees.
Signal processing. In the tube imaging experiment, the RF signal collected includes background signal
and harmonic signal, a Matlab-implemented Kaiser-window FIR filter with 40-kHz passband is used to extract
harmonic signal for further processing.
Phase‑retrieval algorithm. The phase-retrieval algorithm was implemented. The object constraints used
were it being real and nonnegative. The algorithms were implemented in Matlab. A single run of the algorithm
(composed of 3000 iterations) takes less than 1 s. The reconstructed results of Fig. 2 are the reconstruction results
after median-filtering with a 3-pixel window.
Scientific Reports | (2021) 11:14178 | https://doi.org/10.1038/s41598-021-93488-y 2
Vol:.(1234567890)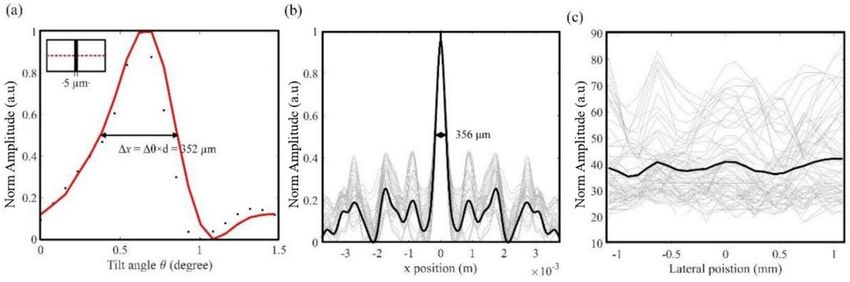
www.nature.com/scientificreports/

                                  Figure 1.  Experimental validation of rotational invariant ultrasonic speckle through bones. (a) Experiment
                                  setup. A single-element ultrasonic transducer focuses on a 1-cm-thick swine trabecular bone. A 96-channel
                                  ultrasound array transducer (P4-1, ATL) measures 1D speckles at 11-cm behind the bone. (b) Speckle patterns
                                  at different tilt angles. The x-axis is the channel index of the array transducer. The angular interval is 0.15
                                  degrees per rotational step. Features in the dashed boxes validate the rotational-invariant property. (c) Cross-
                                  correlation coefficients between the first and other speckle patterns in (b). Data are smoothed by the spline.

                                  Results
                                  We experimentally validate the rotational invariant property of ultrasonic speckles. Figure 1a shows the experi-
                                  ment setup. A customized narrow-band focused transducer emits 2.5-MHz continuous ultrasonic wave. The
                                  transducer has a diameter of 4.1 cm and a focal length of 2.4 cm. A piece of swine trabecular bone (1-cm thick)
                                  is placed in the transducer’s focal plane. Behind the bone, 1D ultrasonic speckle patterns are detected by a
                                  96-channel ultrasonic array transducer (P4-1, ATL). The transducer array is 11-cm away from the bone. We
                                  rotate the emitting transducer around its focal point. The rotational step size is 0.15 degrees. The pitch of the
                                  ultrasonic transducer array is 0.3 mm. Considering the 11-cm distance between the bone and the ultrasonic array,
                                  the 0.15-degree angular step size corresponds to a translational step size of 0.29 mm in the measurement plane.
                                      At each incident angular position, RF data in all channels are recorded for 5 s at a sampling frequency of
                                  6 MHz. The mean square value of the RF data in each channel is calculated as the ultrasonic intensity. The
                                  intensity profile of all 96 channels (1D speckle) is normalized to their maximum value. Ten sets of 1D speckle
                                  patterns obtained at ten rotational angles in a full range of 1.4 degrees are shown in Fig. 1b. These 1D profiles
                                  exhibit obvious invariant patterns during the rotational scanning of the incident ultrasonic beam. Curves in the
                                  dashed box in Fig. 1b is a representative case. The 1D speckle patterns remain almost unchanged within certain
                                  angular range and then gradually decorrelates. Cross-correlation coefficients between the first and the other
                                  speckle patterns are shown in Fig. 1c, validating the rotational invariance. We define the angular range when
                                  the cross-correlation coefficient is no less than 50% to be the rotational-invariant range. Because the rotation in
                                  Fig. 1c is unidirectional, the full rotational-invariant range is twice of the range in Fig. 1c. In this experiment,
                                  the rotational invariant range is ~ 1.6 ± 0.1 degrees (mean and standard error, averaged 30 times). Eventually,
                                  the cross-correlation coefficient drops to ~ 0.2, but not 0. We think the reason is that the transmitted ultrasonic
                                  waves include both ballistic and scattered components, and the ballistic components remain correlated even in
                                  a large angular range.
                                      In imaging experiments, we find that even when the cross-correlation coefficient is less than 0.5 (but greater
                                  0.2), the speckle scanning still allows us to reconstruct the object image. To enlarge the field of view, the minimum
                                  allowed cross-correlation coefficient in the following imaging experiments can be smaller than 0.5 but larger
                                  than 0.2. Moreover, the ballistic acoustic wave is a problem in the imaging experiments.
                                      Based on the rotational-invariant property, we scan the ultrasonic speckle pattern across samples behind
                                  thick bones. The rotational-invariant range is first measured before each imaging experiment. Two small holes
                                  on an 8-mm-thick plate are placed 15.5-cm-away from the bone. The plate is printed with photosensitive resin
                                  (model 9400). The holes allow ultrasonic waves to pass, and a layer of 2-mm-thick sealed air in other areas of
                                  the plate blocks ultrasonic transmission.
                                      For comparison, we first use conventional ultrasonography to image the hole features behind the 1-cm-thick
                                  bone, as shown in Fig. 2a. The ultrasonic array transducer (P4-1, ATL) has a 2.5-MHz central frequency and 73%
                                  bandwidth. Arrows indicate the emitting and receiving highly-scattered ultrasonic waves through the bone. We
                                  acquired B-mode images of two samples with different hole sizes (see supplementary information). To compare
                                  with the true hole features, 1D profiles of the B-mode images at the object positions are plotted in Fig. 2b and c.
                                  True 1D object profiles are plotted as dashed blue lines overlaid on the measured ultrasonic imaging profiles. In
                                  Fig. 2b, the object has two 1-mm-sized holes with a 3-mm center-to-center distance. In Fig. 2c, the object has
                                  two holes. The left one is 1 mm in size; the right one is 2 mm in size. The center-to-center distance is 3.5 mm.
                                  Figure 2b and c show strong variations due to aberrated/scattered ultrasound in the thick bone, and the hole
                                  features are invisible. As expected, conventional ultrasonography cannot image the fine features through the
                                  1-cm-thick bone.
                                      Figure 2d shows the experimental setup for rotational-invariant speckle-scanning ultrasonography. A single-
                                  element focused ultrasonic transducer emits 2.5-MHz continuous wave. The 1-cm-thick swine bone (labeled as
                                  Bone_in in Fig. 2d) is placed on the ultrasonic focus to scatter the ultrasonic wave. The object is placed 15.5-cm

Scientific Reports |   (2021) 11:14178 |               https://doi.org/10.1038/s41598-021-93488-y                                                    3

                                                                                                                                                Vol.:(0123456789)
www.nature.com/scientificreports/
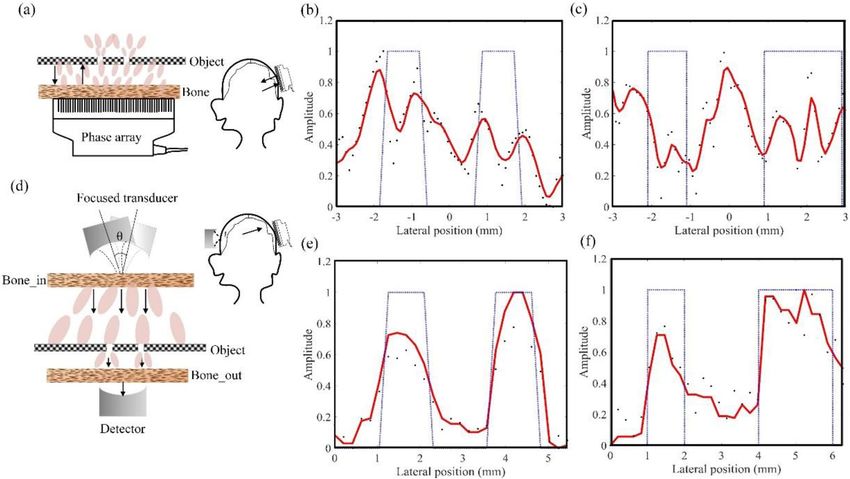
Figure 2. Imaging hole-features behind 1-cm-thick bones with conventional ultrasonography and rotational-
invariant speckle-scanning ultrasonography. (a) Experimental setup for conventional ultrasonography. (b) and
(c) 1D profiles of hole features acquired with conventional ultrasonography. True profiles are plotted as dashed
lines for comparison. The object in (b) has two holes with 1-mm size and a 3-mm center-to-center distance.
The object in (c) has two holes with 1-mm and 2-mm sizes, and a 3.5-mm center-to-center distance. (d)
Experimental setup of rotational-invariant speckle-scanning ultrasonography. In experiment, an array is used as
a detector. (e) and (f) Reconstructed 1D images of hole features and the ground truth. The objects in (e) and (f)
are the same as the ones in (b) and (c).
away from the bone (Bone_in). Another 0.5-cm-thick swine bone (labeled as Bone_out) is placed 2-mm away
from the object. A flat receiving transducer is positioned 2-mm from the Bone_out. The aberrated or scattered
ultrasonic waves transmit through the holes and then are detected by the receiving transducer. We use a 96-chan-
nel array transducer (P4-1, ATL) as the single-element flat transducer by adding all-channel data together without
delay. The objects used here are the same as those in Fig. 2b and c. To image the objects with ultrasonic speckles,
we rotate the emitting ultrasonic transducer around the acoustic focal spot and measure the transmitted ultra-
sonic intensities. The scanning step size is 0.0775 degrees. Ultrasonic intensities at 20 ~ 30 positions are acquired
in each scanning. For ensemble averaging, after each scanning, we rotate the emitting transducer around the
focal spot along the direction normal to the scanning direction to generate different speckle patterns. Then, we
repeat the speckle scanning imaging using the new speckle pattern. We ensemble average the results from three
random speckle realizations. We use the iterative phase retrieval algorithm to reconstruct the images from the
averaged intensity data. Results are smoothed by moving average over three pixels and shown in Fig. 2e and f.
The reconstructed images clearly show the hole features. Figure 2e shows two holes: the left one is 1.27 mm in
full-width-half-maximum (FWHM), and the right one is 1.13 mm in FWHM. The peak-to-peak distance between
them is 2.91 mm. In Fig. 2f, FWHM of the left hole is 1.07 mm, 2.20 mm for the right one. The peak-to-peak
distance of the two holes is 3.77 mm. Compared with the ground truth, rotational-invariant speckle-scanning
ultrasonography can successfully image the hole features. The imaged center-to-center distances (2.91 mm and
3.77 mm) are close to the true values (3 mm and 3.5 mm). In the images, the 2-mm hole is larger than the 1-mm
holes. The imaged hole sizes are consistently larger than their true values by 0.07–0.27 mm.
We quantify the spatial resolution using thin line features. Thin glass tubes filled with microbubble solutions
are placed between two bones. Microbubbles solutions in the tubes generate harmonic signals upon ultrasonic
excitation16,17. In speckle-scanning ultrasonography, we detect the third harmonic signal to reconstruct the micro-
bubble images so that the fundamental-frequency signal from the tube walls and other features can be suppressed.
The experimental setup is the same as the one shown in Fig. 2d. Lab-made lipid-shelled microbubbles have
diameters of 1 ~ 5 µm. The resonate frequency is in the range of ~ 2–5 MHz. Microbubbles are mixed with water
with a concentration of ~109 bubbles per ml. The sampling frequency is 24 MHz to acquire the third harmonic
signal. A digital band-pass filter centered at 7.5 MHz (40-kHz passband) is applied to the RF data. The scanning
step size is 0.0775 degrees. The ultrasonic intensity profiles are averaged over six speckle implementations and
then are used to reconstruct the object. To measure the lateral resolution, we image a capillary tube with 5 µm
inner diameter. The tube is placed at the other side of Bone_out. The distance is between them is 200 µm corre-
spond to the tube wall. The distance between the object and Bone_out should guarantee that all signals received
by the transducer are scattered twice by Bone_in and Bone_out. Currently, we validate the proposed method in
the case when the distance between the object and Bone_out is as close as 200 µm. The reconstructed 1D image
is shown in Fig. 3a. FWHM of the 1D profiles is 352 µm, which represents the lateral resolution.
Scientific Reports | (2021) 11:14178 | https://doi.org/10.1038/s41598-021-93488-y 4
Vol:.(1234567890)www.nature.com/scientificreports/
Figure 3. Speckle-scanning ultrasonography of capillary tubes between two 0.5 ~ 1-cm-thick bones. (a)
Reconstructed image of a 5-µm-diameter tube filled with microbubbles. Full width at half maximum is 352 µm.
(b) Gray: speckle autocorrelations of 20 sets of autocorrelation functions. Black: averaged autocorrelation
function of speckle patterns in the object plane. (c). Conventional ultrasonography of the 5-µm-diameter tube.
Gray: 1D profiles within field-of-interest (FOI). Black: an averaged 1D image. See Supplementary information.
The resolution of speckle-scanning ultrasonography is related to the speckle grain size in the object plane. The
speckle grain size is measured from the FWHM of the averaged autocorrelation functions of the speckle patterns.
In Fig. 3b, the averaged FWHM of the autocorrelation function is 356 ± 2 µm (mean and standard error, the
sample size is 20) and is very close to the measured resolution. With the parameters used in our experiments, we
can estimate the speckle-grain size using an equation i n18,19. The calculated speckle-grain size is 339 µm, which
is close to the measured resolution and speckle size. For comparison, conventional ultrasonography images the
5-µm tube through the 1-cm-thick bone. The conventional ultrasonic imaging result in the object plane is plotted
in Fig. 3c. As expected, conventional ultrasonography cannot image the micro-tube feature through the thick
bone even with the same number of averages.
The field-of-view (FOV) is determined by the angular range of rotational invariance and the distance between
the object and the scatter (Bone_in). In experiments, we show a 6-mm imaging range with 25 effective pixels. To
increase the imaging range and pixel number, further increasing the rotational-invariant range and the scanning
step number is necessary. Optimizing the ultrasonic frequency or selecting a proper site on the skull may be
helpful to further extend the rotational invariant range. Taking advantage of speckle scanning, the resolution of
this technique can reach 352 µm, which overcomes the aberration/scattering issue in thick bones.
At present, we manually scan the ultrasonic transducer, and the time to acquire an image is around one
hour. Automatic scanning or electronic beam steering in the future may dramatically shorten the imaging time.
In addition, the imaging speed depends on the number of ensemble averages and the scanning steps. A fewer
averaging number and a reasonable larger step size may shorten the imaging time.
As proof of concept, we only demonstrate 1D ultrasonic imaging through thick bones. As the speckle is fully
developed, the spatial characteristic is uniform in the horizontal plane(correspond to the scan direction). So
the extension from 1D speckle correlation scenario to 2D scenario is straightforward. This 1D method enables
further development of 2D imaging technique. For instance, if we use the 1D imaging result as one projection,
then we can acquire multiple projections at different angles and reconstruct a 2D image.
Conclusion
We explore the rotational-invariant property of ultrasonic speckle through strong acoustic scatterers. The rota-
tional-invariant angular range can be ~ 1.6 degrees when 2.5 MHz ultrasound penetrates through 1-cm-thick
bones. Based on this property, we develop rotational-invariant speckle-scanning ultrasonography to image objects
sandwiched between two 0.5 ~ 1-cm-thick bones. Speckle-scanning ultrasonography can image hole and line
features that are invisible in conventional ultrasonography. With harmonic signals emitted from microbubbles,
we quantify the lateral resolution as high as 352 µ m. We expect this new technique enables high-resolution
ultrasonography of the human brain.
Received: 24 April 2021; Accepted: 15 June 2021
References
1. Montaldo, G., Tanter, M. & Fink, M. Time reversal of speckle noise. Phys. Rev. Lett. 106, 054301 (2011).
2. Osmanski, B.-F., Montaldo, G., Tanter, M. & Fink, M. Aberration correction by time reversal of moving speckle noise. IEEE Trans.
Ultrason. Ferroelectr. Freq. Control 59, 1575–1583 (2012).
3. Nock, L., Trahey, G. E. & Smith, S. W. Phase aberration correction in medical ultrasound using speckle brightness as a quality
factor. J. Acoust. Soc. Am. 85, 1819–1833 (1989).
4. Ivancevich, N. M., Dahl, J. J., Trahey, G. E. & Smith, S. W. Phase-aberration correction with a 3-D ultrasound scanner: Feasibility
study. IEEE Trans. Ultrasonics Ferroelectrics Freq. Control 53, 432–1439 (2006).
Scientific Reports | (2021) 11:14178 | https://doi.org/10.1038/s41598-021-93488-y 5
Vol.:(0123456789)www.nature.com/scientificreports/
5. Lindsey, B. D. & Smith, S. W. Pitch-catch phase aberration correction of multiple isoplanatic patches for 3-D transcranial ultrasound
imaging. IEEE Trans. Ultrason. Ferroelectr. Freq. Control 60, 463–480 (2013).
6. OˈReilly, M. A. & Hynynen, K. A super‐resolution ultrasound method for brain vascular mapping. Medical physics 40 (2013).
7. O’Reilly, M. A., Jones, R. M. & Hynynen, K. Three-dimensional transcranial ultrasound imaging of microbubble clouds using a
sparse hemispherical array. IEEE Trans. Biomed. Eng. 61, 1285–1294 (2014).
8. Lindsey, B. D. et al. The ultrasound brain helmet: new transducers and volume registration for in vivo simultaneous multi-
transducer 3-D transcranial imaging. IEEE Trans. Ultrason. Ferroelectr. Freq. Control 58, 1189–1202 (2011).
9. Bendjador, H., Deffieux, T. & Tanter, M. The SVD beamformer: Physical principles and application to ultrafast adaptive ultrasound.
IEEE Trans. Med. Imaging 39, 3100–3112 (2020).
10. Aubry, A. & Derode, A. Multiple scattering of ultrasound in weakly inhomogeneous media: Application to human soft tissues. J.
Acoust. Soc. Am. 129, 225–233 (2011).
11. Aubry, A. et al. Recurrent scattering and memory effect at the Anderson localization transition. Phys. Rev. Lett. 112, 043903 (2014).
12. Mallart, R. & Fink, M. The van Cittert-Zernike theorem in pulse echo measurements. J. Acoust. Soc. Am. 90, 2718–2727 (1991).
13. Liu, D.-L. & Waag, R. C. About the application of the van Cittert-Zernike theorem in ultrasonic imaging. IEEE Trans. Ultrason.
Ferroelectr. Freq. Control 42, 590–601 (1995).
14. Labeyrie, A. Attainment of diffraction limited resolution in large telescopes by Fourier analysing speckle patterns in star images.
Astron. Astrophys. 6, 85–87 (1970).
15. Fienup, J. R. Reconstruction of an object from the modulus of its Fourier transform. Opt. Lett. 3, 27–29 (1978).
16. Ferrara, K., Pollard, R. & Borden, M. Ultrasound microbubble contrast agents: fundamentals and application to gene and drug
delivery. Annu. Rev. Biomed. Eng. 9, 415–447 (2007).
17. Simpson, D. H., Chin, C. T. & Burns, P. N. Pulse inversion Doppler: a new method for detecting nonlinear echoes from microbub-
ble contrast agents. IEEE Trans. Ultrason. Ferroelectr. Freq. Control 46, 372–382 (1999).
18. Wagner, R. F. Statistics of speckle in ultrasound B-scans. IEEE Trans. Sonics & Ultrason. 30, 156–163 (1983).
19. Smith, S. & Wagner, R. Ultrasound speckle size and lesion signal to noise ratio: verification of theory. Ultrason. Imag. 6, 174–180
(1984).
Acknowledgements
The authors thank Guohua WEN, Yingying ZHOU, and Yu LU for assistance in experiments. This work is
partially supported by Research Grants Council of the Hong Kong Special Administrative Region (21205016,
11215817, 11101618).
Author contributions
L.W conceived the idea. S.L. and L.W. designed the experiments, S.L conducted the numerical simulations and
experiments, wrote the reconstruction algorithm. S.L. and L.W. analyzed the results and wrote the manuscript.
Competing interests
The authors declare no competing interests.
Additional information
Supplementary Information The online version contains supplementary material available at https://doi.org/
10.1038/s41598-021-93488-y.
Correspondence and requests for materials should be addressed to L.W.
Reprints and permissions information is available at www.nature.com/reprints.
Publisher’s note Springer Nature remains neutral with regard to jurisdictional claims in published maps and
institutional affiliations.
Open Access This article is licensed under a Creative Commons Attribution 4.0 International
License, which permits use, sharing, adaptation, distribution and reproduction in any medium or
format, as long as you give appropriate credit to the original author(s) and the source, provide a link to the
Creative Commons licence, and indicate if changes were made. The images or other third party material in this
article are included in the article’s Creative Commons licence, unless indicated otherwise in a credit line to the
material. If material is not included in the article’s Creative Commons licence and your intended use is not
permitted by statutory regulation or exceeds the permitted use, you will need to obtain permission directly from
the copyright holder. To view a copy of this licence, visit http://creativecommons.org/licenses/by/4.0/.
© The Author(s) 2021
Scientific Reports | (2021) 11:14178 | https://doi.org/10.1038/s41598-021-93488-y 6
Vol:.(1234567890)You can also read