SASSCAL WebSAPI: A Web Scraping Application Programming Interface to Support Access to SASSCAL's Weather Data - Data Science Journal
←
→
Page content transcription
If your browser does not render page correctly, please read the page content below
SASSCAL WebSAPI: A Web
Scraping Application
Programming Interface to
Support Access to SASSCAL’s
Weather Data                                                                             RESEARCH PAPER

TSAONE SWAABOW THAPELO
MOLALETSA NAMOSHE
ODUETSE MATSEBE
TSHIAMO MOTSHEGWA
MARY-JANE MORONGWA BOPAPE
*Author affiliations can be found in the back matter of this article

ABSTRACT                                                                                 CORRESPONDING AUTHOR:
                                                                                         Tsaone Swaabow Thapelo
The Southern African Science Service Centre for Climate and Land Management              Botswana International
(SASSCAL) was initiated to support regional weather monitoring and climate research      University of Science and
in Southern Africa. As a result, several Automatic Weather Stations (AWSs) were          Technology (BIUST), BW
implemented to provide numerical weather data within the collaborating countries.        swaabow@gmail.com
Meanwhile, access to the SASSCAL weather data is limited to a number of records
that are achieved via a series of clicks. Currently, end users can not efficaciously
extract the desired weather values. Thus, the data is not fully utilised by end users.   KEYWORDS:
This work contributes with an open source Web Scraping Application Programming           Web Scraping; Dashboard;
Interface (WebSAPI) through an interactive dashboard. The objective is to extend         Data Visualisation
functionalities of the SASSCAL Weathernet for: data extraction, statistical data
analysis and visualisation. The SASSCAL WebSAPI was developed using the R statistical    TO CITE THIS ARTICLE:
environment. It deploys web scraping and data wrangling techniques to support            Thapelo, TS, Namoshe, M,
access to SASSCAL weather data. This WebSAPI reduces the risk of human error, and        Matsebe, O, Motshegwa, T and
                                                                                         Bopape, M-JM. 2021. SASSCAL
the researcher’s effort of generating desired data sets. The proposed framework for
                                                                                         WebSAPI: A Web Scraping
the SASSCAL WebSAPI can be modified for other weather data banks while taking into       Application Programming
consideration the legality and ethics of the toolkit.                                    Interface to Support Access
                                                                                         to SASSCAL’s Weather Data.
                                                                                         Data Science Journal, 20: 24,
                                                                                         pp. 1–13. DOI: https://doi.
                                                                                         org/10.5334/dsj-2021-024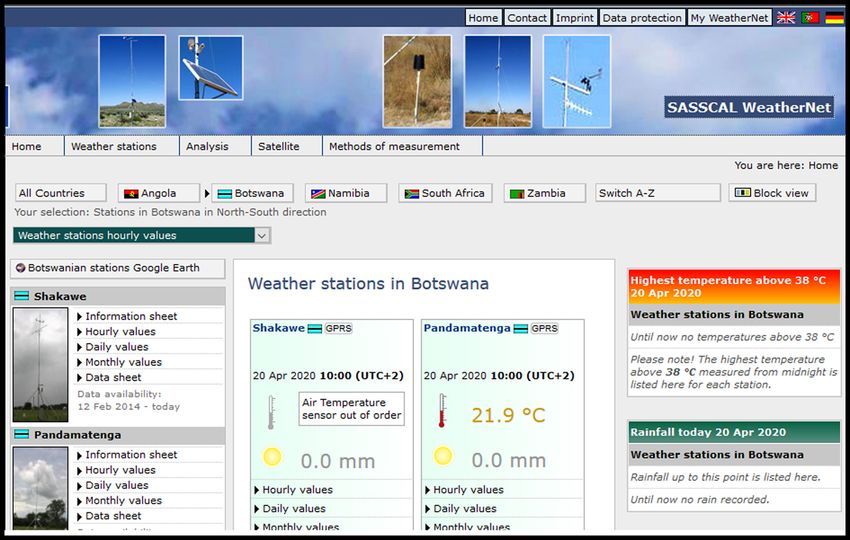
I. INTRODUCTION Thapelo et al.
Data Science Journal
2
DOI: 10.5334/dsj-2021-024
Meteorological weather data are useful in filling information needs in academia and industrial
settings. The information generated from these data at local levels is useful in complementing:
hydrological models (Schuol & Abbaspour 2007), high impact weather predictions models
(Chang et al. 2013), and simulations of heavy rainfall events (Bopape et al. 2021, Molongwane
et al. 2020, Somses et al. 2020) and heatwaves (Moses 2017). Moreover, weather data are
also vital for agro-meteorological operations, as well as in efficacious planning of construction
and recreational activities. Although there is a huge need of weather or climatological data for
Southern Africa, various institutions and enterprises like BIUST, SASSCAL1 and WASCAL2 have
introduced AWSs to monitor weather events at finer intervals.
However, most of AWSs installed in developing countries are underutilized. For instance, the
Botswana Department of Meteorological Services (BDMS)’s mandate is to provide quality
weather, climate information and services to enable informed decision making for sustainable
socio-economic development in scenarios related to weather and climate. Meanwhile, the
BDMS lacks a designated online platform (currently relies on radio stations, television and a
Facebook page) to disseminate weather information to the public.
On a related note, BIUST identified “Climate and Society” as one of its thematic areas3 of focus.
This is geared towards enhancing services related to: climate and impact modeling; early
warning, and disaster management for weather and climate change. In 2016, BIUST installed
an AWS equipped with a local machine running XConnect for data logging of historical weather
data. Likewise, this particular AWS also lacks the backend service layer for dissemination of
weather outputs to end users. All these can be seen as barriers and hence limitations of access
to the generated weather data. For instance, to request data, clients have to go through some
hectic processes. In the case of BIUST, clients have to request data using email, or copy it
from the officers using physical storage devices like memory cards. In case of BDMS, end users
download and complete a form;4 then submit it to BDMS. The service time is three days long.
It is irrefutable that, the demand of climatological data in Southern Africa invites key
stake holders (i.e., researchers and developers) and organisations to implement platforms
that facilitate ease access and visualisation of climate data. As a result, the Southern
African Science Service Centre for Climate and Land Management (SASSCAL) was initiated
(Helmschrot, Jörg and Muche, GERHARD and Hillmann, THOMAS and Kanyanga, JOSEPH and
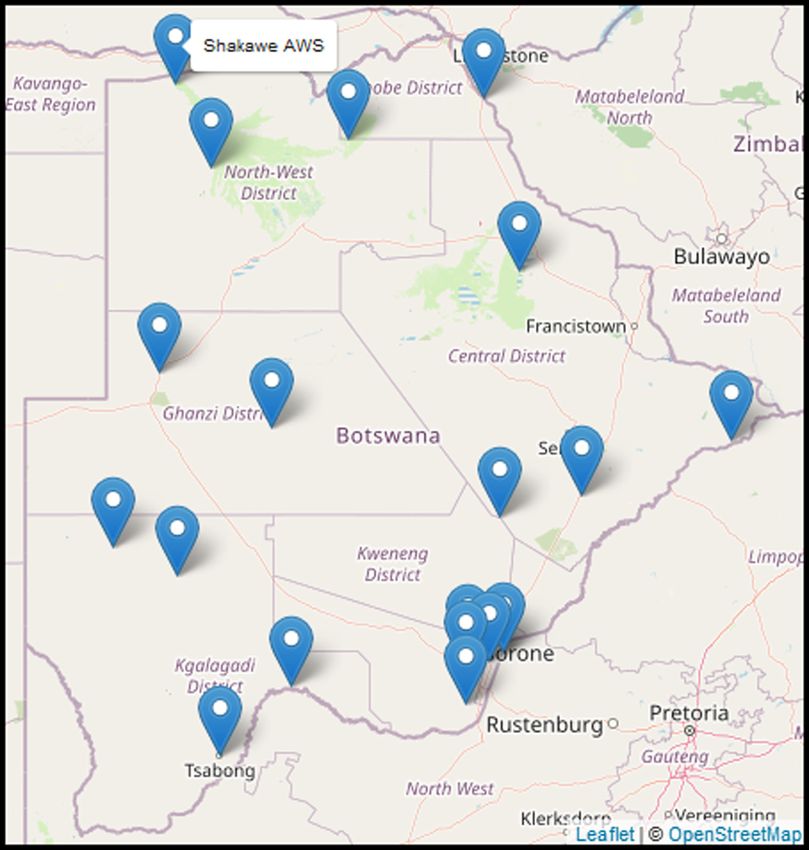
Figure 1 Visualisation of
AWS data via the SASSCAL
Weathernet.
1 https://www.sasscal.org/.
2 https://wascal.org/.
3 www.biust.ac.bw/research/thematic-areas-platforms/.
4 https://www.gov.bw/natural-resources/request-climatological-data.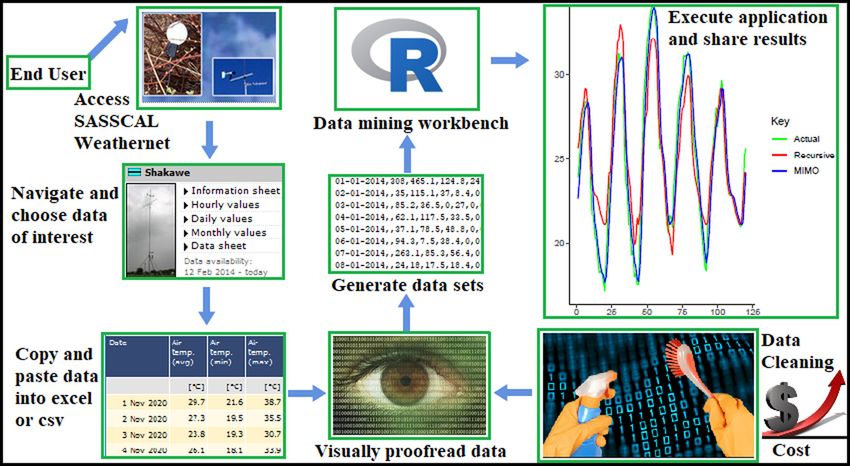
Butale, MOMPATI and Nascimento, DOMINGOS and Kruger, SALOME and Strohbach, B and                      Thapelo et al.                 3
                                                                                                      Data Science Journal
Seely, MARY and Ribeiro, CARLOS and others 2015) to support regional weather monitoring               DOI: 10.5334/dsj-2021-024
and climate research in Southern Africa (Muche, Gerhard and Kruger, Salome and Hillmann,
Thomas and Josenhans, Katrin and Ribeiro, Carlos and Bazibi, Mompati and Seely, Mary and
Nkonde, Edson and de Clercq, Willem and Strohbach, Ben and others 2018). The SASSCAL
Weathernet5 disseminates near to real-time data from AWSs at hourly intervals, including
aggregated daily and monthly data (see Figure 1).

The SASSCAL weather data is reviewed for quality control before dissemination (Kaspar et al.
2015). These data can also be integrated with data from different sources for research purposes.
For instance, Moses et. al. (Oliver & L 2018) merged it with other meteorological data from the
BDMS to analyse effects of solar radiation, wind speed and humidity on evapo-transpiration
around the Okavango Delta. Similarly, predictive data analysis and modeling of temperature
patterns (Thapelo 2014, Thapelo & Jamisola 2019) is vital in the understanding of heatwaves
(Moses 2017); while rainfall values can help in assessing rainfall erosivity (Singh & Singh 2020).

Despite the distinct potential use of the SASSCAL weather data, there is a burden on the end
users to access, download and use such data in research (see Figure 2). First, the user has to
navigate to the SASSCAL Weathernet to identify a country, AWS of interest, and the temporal
resolution of the weather data. The user can then manually copy and paste the whole data to a
storage file for data analysis. There is an option to download the SASSCAL weather data in excel
format only. However, there is no option to only select the desired weather values from AWSs
of interest. Even after downloading the weather data, end users face a challenge of generating
clean data sets containing the desired variables for further use. The situation worsens when
extracting finer temporal data from multiple AWSs across the entire region.

                                                                                                      Figure 2 Manually extracting
                                                                                                      data from the SASSCAL
                                                                                                      Weathernet. This process is
                                                                                                      costly, time consuming and
                                                                                                      error-prone.

This work presents the SASSCAL Web Scraping Application Programming Interface (WebSAPI).
Web scraping (Munzert et al. 2014) is a data science technique that deploys scripts for extraction
of structured data from websites. A script is a computer program that automates a specific
task using some selected programming languages like R or Python. Thus, a WebSAPI can be
seen as an application service that allows access to online data for further use in research
projects. By digitalising the BDMS’ form in 4 for climate data requests, this work will be enabling
end users to efficaciously (1) access and visualise weather data from the SASSCAL Weathernet;
and (2) download desired data for use in data driven projects.

The structure of the work is as follows. Section II provides a brief background information
to this work. Section III presents the approach deployed in the development of the SASSCAL
WebSAPI. Section IV presents results. It also illustrates how the SASSCAL WebSAPI can be used
to support the extraction of weather variables, as well as the visualisation and dissemination of
the generated outputs. Lastly, section V and VI present discussions and conclusions.

5   http://www.sasscalWeathernet.org/.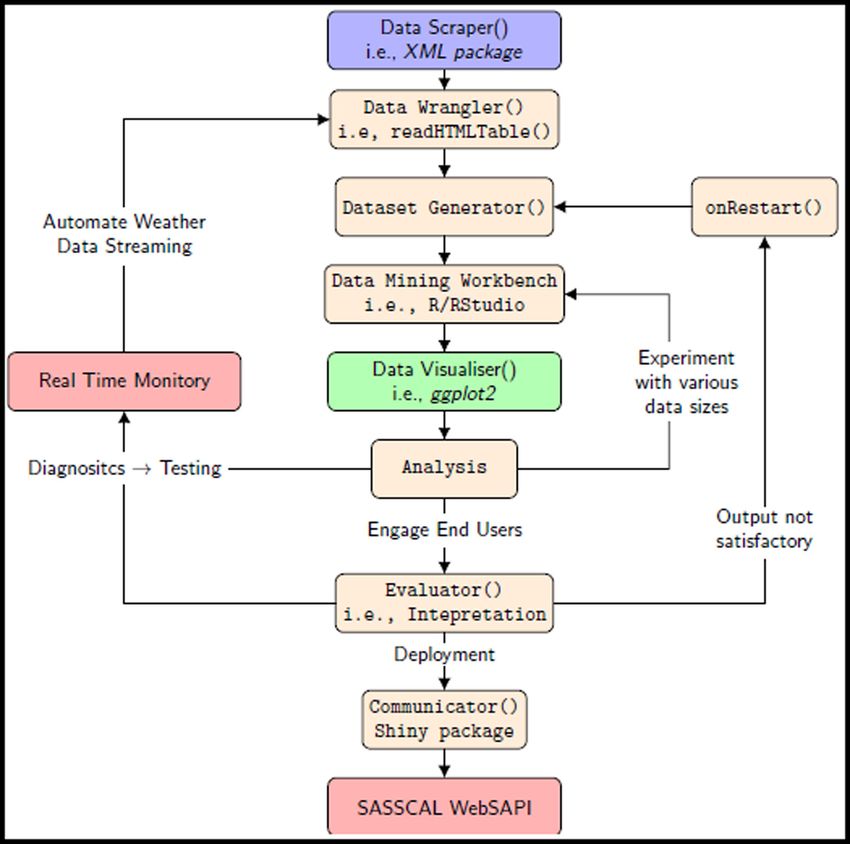
II. RELATED LITERATURE REVIEW                                                                            Thapelo et al.
                                                                                                         Data Science Journal
                                                                                                                                     4

                                                                                                         DOI: 10.5334/dsj-2021-024
Most of African countries (Tufa et al. 2014) like Botswana (Nkemelang et al. 2018) are lagged
behind in terms of climate informatics (Vyacheslav et al. 2019) and environmental data science
(Gibert et al. 2018, Vyacheslav et al. 2019). This can be attributed to lack of readily available
platforms and data as also pointed out in (Schuol & Abbaspour 2007, Tufa et al. 2014). All these
bottlenecks can be unlocked by integrating computing technologies like web scraping and
dashboard applications. Web scraping techniques have been widely deployed in a number of
projects from different disciplines such as economics (Robert & Paul 2020) and climate science
(Yang et al. 2010).

Regardless of the discipline, the general idea is to allow greater visibility, access, extraction
and usability of the online data. This work contributes by addressing the second “pillar” of
the Global Framework for Climate Services (Vaughan et al. 2016) using climate informatics.
This WebSAPI is motivated by authors in (Bonifacio et al. 2015) who presented a free tool for
automated extraction and consolidation of climate data from different online web data banks.
A similar work by Yang et al. (Yang et al. 2010) presented a system with functionalities for
scraping, filtering and visualising climatic data for easy use. This work is related to Ref (Sitterson
et al. 2020) regarding the user API for data request. It is also related to (Bonifacio et al. 2015)
in such it deconstructs the URL for a given station and then modifies the date range and the
desired temporal resolution to extract desired weather data.

Web scraping is still emerging, with no dominant standards at current. This technology also
presents a combination of ethical and legal challenges (Krotov Vlad and Johnson Leigh and
Silva Leiser 2020, Mason 1986) that necessitates standards to support data exchange. The
ethical issues attached to web scraping can be summed into four generic groups: property,
privacy, accessibility and accuracy (Mason 1986).

1) The property aspect of it entails ownership of data and its possible use. In this context,
   a web scraping algorithm (WSA) can lead to infringement of copyrights, especially when
   end users make profit out of the data without the consent of data owners (Dreyer &
   Stockton 2013).
2) Regarding privacy, web scraping can unintentionally reveal details or flaws within an
   organization (Mason 1986). For instance, a web scrapper can reveal data structures as
   well as some sensitive data hidden from end users (Ives & Krotov 2006).
3) In terms of accessibility (Mason 1986), it is noted that a WSA can overload a website,
   which may ultimately cause damage to the organisation’s web server. Moreover, web
   scraping can result in unintended and un-predicted harmful consequences to the
   website’s server (Krotov Vlad and Johnson Leigh and Silva Leiser 2020).
4) The accuracy aspect of WSAs is mainly concerned with the authenticity and fidelity
   of the generated data (Mason 1986). This is crucial since erroneous data generated
   through a WSA may mislead end users or even damage the reputation of a particular
   organisation’s website.

Web scrappers can also compete with the main data provider APIs, which might diminish the
value of the organisation’s intended mission (Hirschey 2014). For instance, if a web scrapper
attracts more clients than the intended main API, then end users might end up neglecting the
platform of that organisation. All these invite multi-disciplinary collaboration (i.e., government
sectors, academia and industrial practitioners) to establish standards and boundaries for
technology usage. This could irrefutably catalyse the development and adoption of the
generated data driven outputs as also supported in (Fundel et al. 2019, Katz & Murphy 2005).

III. METHODOLOGY: DATA, TOOLS AND METHODS
A. DATA SOURCES AND THE SASSCAL WEBSAPI
The first task was to identify the data sources, and the SASSCAL Weathernet came to the
rescue. The aim of the SASSCAL WebSAPI is to improve data accessibility and visualisation of the
SASSCAL Weather data before data analysis and predictive modeling. The target of this work
was to develop and implement independent algorithms that can, later on, be consolidated and
integrated into a package for data driven projects requiring SASSCAL weather data.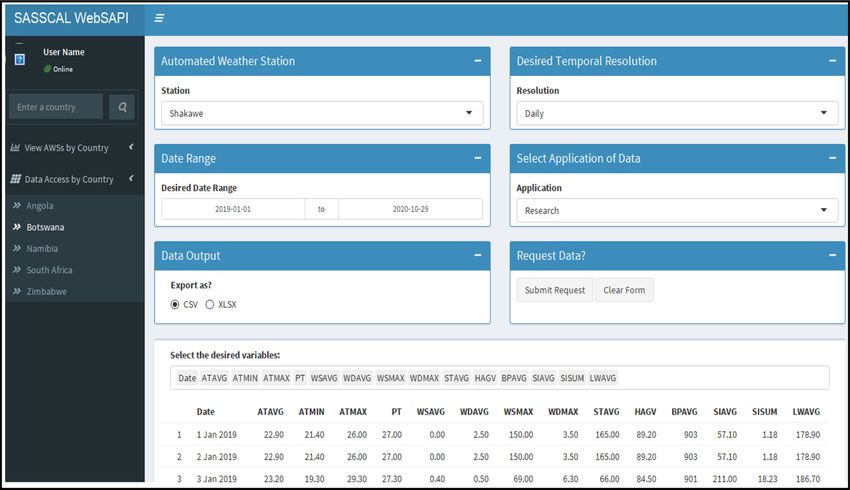
The SASSCAL WebSAPI comprises of modularised algorithms packaged into scripts to enable                Thapelo et al.              5
                                                                                                       Data Science Journal
direct control of weather data provided by the SASSCAL weathernet. This include but not                DOI: 10.5334/dsj-2021-024
limited to algorithms targeted at: processing the SASSCAL Weathernet link; determining the
pages containing relevant weather data; deconstructing and parsing contents of the HTML file;
extracting required weather data from selected pages; combining data (i.e., data wrangling)
into data frames to generate data sets and visuals; as well as sharing the generated outputs
using interactive dashboards.

B. ANALYSIS OF THE SASSCAL WEATHERNET
The SASSCAL Weathernet enables the public to use one domain to access the AWS data. Each
SASSCAL country member has various AWSs, each with a unique identifier (ID). Access to the
data is defined using the same abstract pattern. In essence, one can query the website’s
database for any AWS within the SASSCAL region by providing the corresponding URL. Thus,
one can extract the weather data via a tailored API using formats like HTML and XML.

The home page URL for each SASSCAL AWS data is defined by: x/y?z; where x is the preamble
in link 5; y is just the weatherstat_α_AO_we.php token that defines the weather statistics for a
given resolution (monthly, daily or hourly); and z is the string describing the logger ID (loggerid_
crit = n), where n is the AWS’ unique ID. Tables containing relevant data are found by trial and
error (i.e., by inspect individual elements of the SASSCAL weathernet page), or just exploring the
source code of the web page.

C. IDENTIFICATION OF TOOLS AND METHODS
This work deploys the workflow depicted in Figure 3 following the data science approach in
(Bradley & James 2019, Hadley & Garrett 2016) using open-source platforms (i.e., R version
4.0.3 and RStudio 1.1.463). Thus, the algorithms are coded in R, and the functions are tested
using the RMarkdown which facilitates reproducibility. R has excellent packages for statistical
data science and visualisation. Table 1 shows packages deployed in this work.

                                                                                                       Figure 3 Workflow of the
                                                                                                       SASSCAL WebSAPI.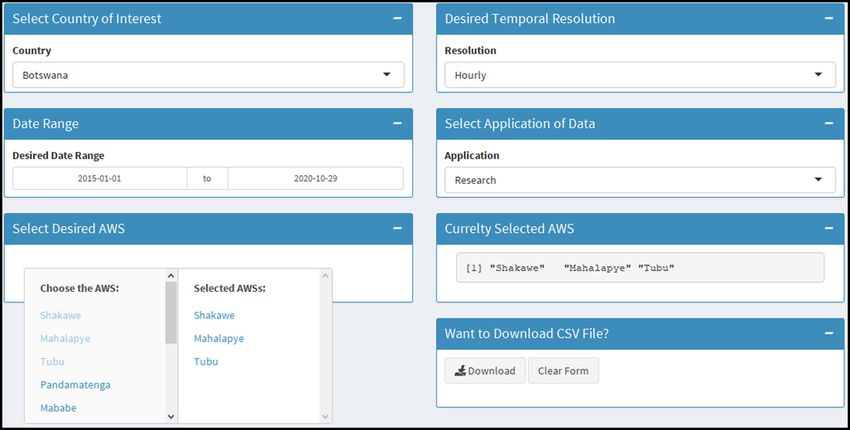
Thapelo et al.                6
 PACKAGE                                   DESCRIPTION                                                     Data Science Journal
                                                                                                           DOI: 10.5334/dsj-2021-024
 rvest (Wickham & Wickham 2016)            web scraping

 Xml2 (Lang & Lang 2015)                   XML document processing

 stringr (Wickham & Wickham 2019)          data cleaning and preparation

 ggplot (Wickham 2011)                     visualisation of graphics

 shiny (Chang et al. 2015)                 dashboard design

 leaflet (Graul & Graul 2016)              reactive maps

 dygraphs (Vanderkam et al. 2015)          time-series data and interactivity

 data.table (Dowle et al. 2019)            tables and data munging
                                                                                                           Table 1 R packages proposed
 flexdashboard (Allaire 2017)              shiny dashboard design
                                                                                                           in this work.

A helper function (helper.R) is scripted to install and load the packages included in Table 1. The
rvest (Wickham & Wickham 2016) package is required for web scraping; while the XML (Lang &
Lang 2015) is required for XML document processing. The ggplot2 (Wickham 2011) is used for
data visualisation. The Shiny (Chang et al. 2015) and Flexdashboard (Allaire 2017) packages are
used to design the WebSAPI’s dashboard. The htmlwidgets framework is deployed to provide
high-level R bindings to the JavaScript libraries for data visualization. All these functions are
embedded in a reproducible RMarkdown to implement the proposed SASSCAL WebSAPI. The
data driven pipeline used in this work is summarised in Figure 3.

D. VISUALISATION OF AWSs USING INTERACTIVE MAPS
Algorithm 1 implements an interactive map to visualise where the AWSs are located
geographically. Here, w is a vector of AWSs for a given country, x and y are vectors of the
latitude and longitude coordinates of the AWSs, z is a vector detailing the descriptions of
a given AWS. The algorithm also allows users to select specific AWSs; thanks to the leaflet
package. In Algorithm 1, the dataframe ‘c’ defining the inputs is piped into the leaflet function to
automatically generate an auto-size map that fits markers of all AWSs. This function also adds
some bounds in (Line 4) so that the user can’t scroll too far away from the markers of AWSs.
The interactive map pops up the name of the AWS as the user hovers the mouse over a marker.
This simple functionality is crucial for end users (i.e., researchers) since it provides spatio-visual
exploration of AWSs that are supported by the SASSCAL weathernet.

                                                                                                           Algorithm 1 Visualise the
 1      c←dataframe(w, x, y, z)
                                                                                                           AWSs of a given country.
 2      leaflet(data = c) %>%

 3      addTiles() %>%

 4      setMaxBounds(x1, y2, x2, y2) %>%

 5      addMarkers(∼ long,∼ lat, label= ∼ name)

E. WEB SCRAPING AND DATASET GENERATION
The web scraping functionality in Algorithm 2 uses the All_AWS_ID.R script to construct vectors
and store names and IDs of AWSs. The AWS_ID_Getter function assigns an AWS name (i.e., “x”)
to its corresponding ID (i.e., “value”) using a hash map function (see Line 7 and 8). Thus, to find
the ID for a given AWS of interest, the function looks-it-up into the hash function and retrieves
the address of that AWS’ ID.

The AWS name, ID and date are then used to construct a URL used to fetch the data by the
DataHaverster.R function in Algorithm 3. The DataHarveter takes in a URL to a given AWS. The URL
string can be partitioned into tokens (i.e., using just the AWS name and date) to facilitate easy input.

The XML package (Lang & Lang 2013) was used to parse a given URL and create a Document
Object Model (DOM). This XML package uses the readHTMLTable() function to specify the weather
data to select from the HTML tables in the SASSCAL Weathernet. The number of tables for a given
DOM was determined using R’s built-in length() function. There are three DOM instances for each
Thapelo et al.                 7
 1     AWS_ID_Getter← function(AWS) {                                                                 Data Science Journal
                                                                                                      DOI: 10.5334/dsj-2021-024
 2     V = c(“x”, “value”); parent = emptyenv()

 3     assign_hash ← Vectorize(assign, vectorize.args = V)

 4     get_hash ← Vectorize(get, vectorize.args = “x”)

 5     exists_hash ← Vectorize(exists, vectorize.args = “x”)

 6     source(“All_AWS_ID.R”)

 7     hash ← new.env(hash = TRUE, parent, size = 100L)

 8     assign_hash(AWS_Name, AWS_ID, hash)

 9     ID_Getter←hash[[AWS]]

 10    return(ID_Getter) }
                                                                                                      Algorithm 2 Data scraper.

 1    μ ← TheHarvester(AWS_NAME,DATE,ρ)

 2    DOM ← readHTMLTable(URL)

 3    μ ← DataWrangler(as.data.frame(DOM[β]))

 4    datatable(μ, ϕ, ω)
                                                                                                      Algorithm 3 Data harvesting.

temporal resolution; each with multiple tables. There are 14 tables in the DOM corresponding to
the web page with hourly data, and the values of interest are in the 13th table. The DOM for the
web page with daily observations has 13 tables, and daily values of interest are in the 12th table.
The last DOM has 18 tables with monthly data contained in the 10th table.

Line 3 in Algorithm 3 facilitates the cleaning and selection of desired weather tables using
the parameter β (i.e., β can be 13, 12 or 10 as discussed above). The parameter ϕ defines
the extensions to fix the columns of a table to be visualised; while ω defines extra options
for buttons to facilitate end users to search, scroll, copy and download the weather data
visualised via the table. The DataWrangler() function was implemented to iterate through the
table containing dates of observations. It uses the ρ argument to determine the date range for
the data of interest. The extracted weather data is then unified into a single data frame μ to
generate data sets for further use as illustrated in Figures 4 and 5 in section IV.

                                                                                                      Figure 4 Visualising Botswana
                                                                                                      AWS using Algorithm 1.
Thapelo et al. 8
Data Science Journal
DOI: 10.5334/dsj-2021-024
Figure 5 Screenshot of
the SASSCAL WebSAPI for
capturing user input when
requesting weather data. The
GUI allows end users to select
the geographical location
of interest (i.e., Botswana),
temporal resolution, the
AWS of interest and the
downloading of data. The
functionality of multi-input
selection of AWSs provides
end users with a feedback
mechanisms to notify about
F. DASHBOARD DESIGN: THE GRAPHICAL USER INTERFACE (GUI) the selected AWS as seen
on the tab titled “Currently
Algorithm 4 implements functionalities for the dashboard page. This include the dashboardHeader() Selected AWS.” This is quite
to define the title; and the dashboardSidebar() to define two functionalities of visualising useful for a quick exploration
the tables of numerical weather data from an AWS of a given country. The dashboardBody() of geographic locations before
facilitates selection of the AWS, the resolution, date range, use of data, and weather values and downloading data.
the functionality to also export data. Since different end users have different user needs, this
work does not develop a complete GUI. Interested readers should see Ref (Robert & Paul 2020)
for completing a dashboard API.
Algorithm 4 Dashboard design
Input: It requires Algorithm 4.
for dissemination.
Result: SASSCAL WebSAPI GUI
1 While (Interactive) do
2 gui ← fluidPage (F ← DataScraper())
3 T← dashboardHeader(…),
4 SDB← dashboardSidebar(…),
5 B←dashboardBody( fluidRow(…)) );
6 server ← function(I,O) { Communicator(F) };
7 shinyApp(gui, server);
IV. RESULTS
This work documents the development process of a lightweight WebSAPI capable of extracting
and displaying timely weather data based on the SASSCAL weathernet. The WebSAPI is cost-
effective since it is powered by open source technologies. Besides the functionalities of extracting
numerical data, the WebSAPI’s tasks were expanded to include visuals using other formats like
tables, maps, and charts. Figure 4 shows an interactive map generated using Algorithm 1. The
interactive map can pop-up the name of the AWS as the user hovers the mouse over a marker.
The algorithms defined in section III-E only scrape data from one AWS at a time. These can be
extend by adding a functionality to specify multiple AWSs then use a for loop function to scrape
desired weather data as shown in Figure 6.
V. DISCUSSIONS
In this work, a data driven template was developed in the form of a WebSAPI to facilitate
efficacious interaction with the outputs generated by the SASSCAL weathernet. The SASSCAL
WebSAPI implements modularised algorithms to collect the SASSCAL weather data and
generate high-quality data sets that can be used in data driven projects. Modularised scripts
facilitate an efficient product design process that integrates any efforts related to ideaThapelo et al. 9
Data Science Journal
DOI: 10.5334/dsj-2021-024
Figure 6 Screenshot of the
SASSCAL WebSAPI’s GUI for
data request, visualisation and
extraction of data. In addition
to selecting the desired AWS,
temporal resolution, and
the date range, the SASSCAL
WebSAPI’s GUI allows end
users to select the desired
variables.
generation, concept development, and, modification of existing systems and platforms to
develop proper solutions. This section presents discussions regarding the data quality, legal
aspects, limitations and implications of the proposed WebSAPI.
A. LEGALITY AND ETHICS OF THE SASSCAL WEBSAPI
The SASSCAL Weathernet data is checked for quality control as mentioned in Ref (Kaspar et al.
2015). This gives an “assurance” that the SASSCAL WebSAPI will provide quality data that
would not mislead end users (i.e, researchers, or decision makers). However, users should note
that due to occasional sensor faults, the correctness of data values cannot be fully guaranteed
as also indicated in the SASSCAL Weathernet.6 The declaration on SASSCAL data use indicates
that free use is granted for non-commercial and educational purposes.
Although there are no explicit restrictions on data scraping on the SASSCAL Weathernet, it is
difficult to conclude that SASSCAL encourages end users to automatically scrape and extract
data using tailor made APIs. This can be justified by the note “For data requests regarding specific
countries, stations, time periods or specific sensors please contact oadc-datarequest@sasscal.org”
as shown in.7 It should be noted that the underlined aspects are the challenges proposed to be
addressed through this work. Thus, personal APIs that pro-grammatically extract the weather
data by bypassing the designated SASSCAL Weathernet API can be seen as presenting slight
ethical dilemma for developers.
B. CHALLENGES AND LIMITATIONS
The main hurdle relates to identifying and integrating appropriate data driven technologies to
facilitate flexible access and visualisation of the SASSCAL weather data. In this regard, a couple
of algorithms have been completed and tested to optimise the task of web scraping. However,
the taks of retrieving weather data was tested using relatively small dataset (94 instances).
The small data set were chosen to ensure that the automatic scraping and retrieving of data
does not likely damage or slow down the SASSCAL website’s servers. This toolkit is built on top
of the SASSCAL Weathernet. Thus, changes in structural representation of SASSCAL Weathernet
implies modifying the WebSAPI.
C. LESSON LEARNT
There is no free lunch in problem solution. The process of web scraping and dashboard design is
iterative and evolutionary. The integration of R, flexdashboard and Shiny allows the development
and deployment of interactive apps. However, before starting a web scraping based data driven
6 http://www.sasscalWeathernet.org/imprint_we.php.
7 http://www.sasscalWeathernet.org/contact_we.php.project, developers should start by analysing associated legality and ethics (Krotov Vlad and Thapelo et al. 10
Data Science Journal
Johnson Leigh and Silva Leiser 2020, Mason 1986) to avoid possible bottlenecks. DOI: 10.5334/dsj-2021-024
D. CONTRIBUTION AND IMPLICATIONS
The contribution of this work is rather pragmatic than theoratical. The WebSAPI is flexible
and reproducible, with potential to be scaled up (expanded) to address other functionalities
related to the use of SASSCAL weather data. Reproducibility is an important aspect in
open science research and API development. This helps to reduce time taken for data
collection, development and testing since the independent components (algorithms) have
been already tried and tested. This approach has potential to catalyse the development of
packages from existing platforms to meet the end user requirements. It should be noted
that neither the BDMS nor BIUST have an API to disseminate weather information. This
WebSAPI is still under development, yet with potential to be adapted and incorporated to
portals of weather service providers (BIUST, BDMS, SASSCAL, and WASCAL) to bridge gaps of
weather and climate data access.
VI. CONCLUSION
A. SUMMARY
Developing and implementing a data driven platform to serve end users is a challenging task that
requires input from multidisciplinary stake holders. This work integrated web scraping (Munzert
et al. 2014), data wrangling and dashboard techniques to develop a lightweight SASSCAL
WebSAPI. In comparison to previous web scraping literature, this work takes into consideration
that data driven outputs need to be disseminated to end users. In this case, a dashboard proto-
type was developed in RMarkdown to facilitate reproducibility. The WebSAPI is expected to
create new channels to extend services of the SASSCAL Weathernet. By enabling efficacious
and efficient data access, the SASSCAL WebSAPI has potential to increase productivity and
quality of data driven projects that make use of SASSCAL weather data.
B. FUTURE WORK
The SASSCAL WebSAPI should be seen not as a replacement but rather a complementary
toolkit to the SASSCAL Weathernet. It does not cover all the tasks related to “weather data
science”, but it provides the end-user community with the opportunity to reproduce it and
develop in-depth product development skills to ultimately add more functionalities to a related
API. In terms of extending this work, more end-user driven functionalities will be added to this
API to enable data driven operations and services like investigating strategies for imputation of
missing data, and modelling.
C. RECOMMENDATIONS
The collaboration with the concerned stakeholders (i.e, SASSCAL, BDMS, BIUST), including end
users (researchers, students, and farmers) could catalyse the development and deployment
process. This will surely enhance operational productivity while maximizing utilization of these
amazing open-source technologies. Efforts from this work are likely to spawn new projects and
collaboration that will better inform citizens and continue to help them to make use of the
generated data, and contribute to the open-data community.
DATA ACCESSIBILITY STATEMENT
This R based toolkit is still under development. Parallel to this manuscript is a reproducible
tutorial in RMarkdown, integrating Shiny and Flexdashboard for visualisation and dissemination
of outputs. The tutorial and code is available on https://github.com/EL-Grande/SASSACL-WebSAPI
and the data is available online 5.
ACKNOWLEDGEMENTS
BIUST: for the partial financial support (with reference number: S-00086); and SASSCAL for
availing the data.COMPETING INTERESTS Thapelo et al.
Data Science Journal
11
DOI: 10.5334/dsj-2021-024
The authors have no competing interests to declare.
AUTHOR CONTRIBUTION
Thapelo TS: Conceptualization, Methodology, Resources, Application Development, Writing
(Original Draft Preparation; Review and Editing); Namoshe M: Conceptualization, Resources,
Formal Analysis, Review and Editing; Matsebe O: Conceptualization, Resources, Formal Analysis,
Review and Editing; Motshegwa T: Resources, Formal Analysis, Review and Editing; Bopape MJM:
Resources, Formal Analysis, Review and Editing.
AUTHOR AFFILIATIONS
Tsaone Swaabow Thapelo
Botswana International University of Science and Technology (BIUST), BW
Molaletsa Namoshe
Botswana International University of Science and Technology (BIUST), BW
Oduetse Matsebe
Botswana International University of Science and Technology (BIUST), BW
Tshiamo Motshegwa
University of Botswana, BW
Mary-Jane Morongwa Bopape
South African Weather Services, Pretoria, SA
REFERENCES
Allaire, J. 2017. Flexdashboard: R markdown format for flexible dashboards.
Bonifacio, C, Barchyn, TE, Hugenholtz, CH and Kienzle, SW. 2015. CCDST: A free Canadian climate data
scraping tool. Computers & Geosciences, 75: 13–16. DOI: https://doi.org/10.1016/j.cageo.2014.10.010
Bopape, M-JM, Waitolo, D, Plant, RS, Phaduli, E, Nkonde, E, Simfukwe, H, Mkandawire, S, Rakate, E and
Maisha, R. 2021. Sensitivity of Simulations of Zambian Heavy Rainfall Events to the Atmospheric
Boundary Layer Schemes. Climate, 9(2): 38. DOI: https://doi.org/10.3390/cli9020038
Bradley, A and James, RJ. 2019. Web scraping using R. Advances in Methods and Practices in
Psychological Science, 2(3): 264–270. DOI: https://doi.org/10.1177/2515245919859535
Chang, EK, Peña, M and Toth, Z. 2013. International research collaboration in high-impact weather
prediction. Bulletin of the American Meteorological Society, 94(11): ES149–ES151. DOI: https://doi.
org/10.1175/BAMS-D-13-00057.1
Chang, W, Cheng, J, Allaire, J, Xie, Y and McPherson, J. 2015. Package ‘shiny’. See http://citeseerx.ist.psu.
edu/viewdoc/download.
Dowle, M, Srinivasan, A, Gorecki, J, Chirico, M, Stetsenko, P, Short, T, Lianoglou, S, Antonyan, E, Bonsch,
M, Parsonage, H, et al. 2019. Package ‘data. table’. Extension of ‘data.frame’.
Dreyer, A and Stockton, J. 2013. Internet “data scraping”: A primer for counseling clients. New York Law
Journal, 7: 1–3.
Fundel, VJ, Fleischhut, N, Herzog, SM, Göber, M and Hagedorn, R. 2019. Promoting the use of
probabilistic weather forecasts through a dialogue between scientists, developers and end-users.
Quarterly Journal of the Royal Meteorological Society, 145: 210–231. DOI: https://doi.org/10.1002/
q j.3482
Gibert, K, Izquierdo, J, Sànchez-Marrè, M, Hamilton, SH, Rodríguez-Roda, I and Holmes, G. 2018.
Which method to use? An assessment of data mining methods in Environmental Data Science.
Environmental Modelling & Software, 110: 3–27. Special Issue on Environmental Data Science.
Applications to Air quality and Water cycle. 2. DOI: https://doi.org/10.1016/j.envsoft.2018.09.021
Graul, C and Graul, MC. 2016. ‘Package ‘leafletr”.
Hadley, W and Garrett, G. 2016. R for data science: import, tidy, transform, visualize, and model data.
.O’Reilly Media, Inc.
Helmschrot, J, Muche, G, Hillmann, T, Kanyanga, J, Butale, M, Nascimento, D, Kruger, S, Strohbach,
B, Seely, M, Ribeiro, C, others. 2015. SASSCAL WeatherNet to support regional weather monitoring
and climate-related research in Southern Africa. Proceedings of the International Association of
Hydrological Sciences, 366: 170–171. DOI: https://doi.org/10.5194/piahs-366-170-2015
Hirschey, JK. 2014. Symbiotic relationships: Pragmatic acceptance of data scraping. Berkeley Tech. LJ, 29:
897. DOI: https://doi.org/10.2139/ssrn.2419167Ives, B and Krotov, V. 2006. Anything you search can be used against you in a court of law: Data mining Thapelo et al. 12
Data Science Journal
in search archives. Communications of the Association for Information Systems, 18(1): 29. DOI:
DOI: 10.5334/dsj-2021-024
https://doi.org/10.17705/1CAIS.01829
Kaspar, F, Helmschrot, J, Mhanda, A, Butale, M, de Clercq, W, Kanyanga, J, Neto, F, Kruger, S, Castro
Matsheka, M, Muche, G, et al. 2015. The SASSCAL contribution to climate observation, climate data
management and data rescue in Southern Africa. Advances in science and research, 12: 171–177.
DOI: https://doi.org/10.5194/asr-12-171-2015
Katz, RW and Murphy, AH. 2005. Economic value of weather and climate forecasts. Cambridge University
Press.
Krotov, V, Leigh, J and Leiser, S. 2020. Tutorial: Legality and Ethics of Web Scraping. Communications of
the Association for Information Systems, 47(1): 22. DOI: https://doi.org/10.17705/1CAIS.04724
Lang, DT and Lang, MDT. 2013. Package ‘xml’.
Lang, DT and Lang, MDT. 2015. Package ‘XML’. DOI: https://doi.org/10.2307/248873
Mason, RO. 1986. Four ethical issues of the information age. MIS quarterly, 5–12. DOI: https://doi.
org/10.2307/248873
Molongwane, C, Bopape, M-JM, Fridlind, A, Motshegwa, T, Matsui, T, Phaduli, E, Sehurutshi, B
and Maisha, R. 2020. Sensitivity of Botswana Ex-Tropical Cyclone Dineo rainfall simulations
to cloud microphysics scheme. AAS Open Research, 3(30): 30. DOI: https://doi.org/10.12688/
aasopenres.13062.1
Moses, O. 2017. Heat wave characteristics in the context of climate change over past 50 years in
Botswana. Botswana Notes and Records; ub.bw/index.php/bnr/.
Muche, G, Kruger, S, Hillmann, T, Josenhans, K, Ribeiro, C, Bazibi, M, Seely, M, Nkonde, E, de Clercq,
W, Strohbach, B, others. 2018. SASSCAL WeatherNet: present state, challenges, and achievements
of the regional climatic observation network and database. Biodiversity & Ecology, 6: 34–43. DOI:
https://doi.org/10.7809/b-e.00302
Munzert, S, Rubba, C, Meissner, P and Nyhuis, D. 2014. Automated data collection with R:
A practical guide to web scraping and text mining. John Wiley & Sons. DOI: https://doi.
org/10.1002/9781118834732
Nkemelang, T, New, M and Zaroug, M. 2018. Temperature and precipitation extremes under current,
1.5°C and 2.0°C global warming above pre-industrial levels over Botswana, and implications for
climate change vulnerability. Environmental Research Letters, 13(6): 065016. DOI: https://doi.
org/10.1088/1748-9326/aac2f8
Oliver, M and Hambira, WL. 2018. Effects of climate change on evapotranspiration over the Okavango
Delta water resources. Physics and Chemistry of the Earth, Parts A/B/C, 105: 98–103. DOI: https://doi.
org/10.1016/j.pce.2018.03.011
Robert, S and Paul, S. 2020. Making health economic models Shiny: A tutorial. Wellcome Open Research,
5(69): 69. DOI: https://doi.org/10.12688/wellcomeopenres.15807.2
Schuol, J and Abbaspour, K. 2007. Using monthly weather statistics to generate daily data in a
SWAT model application to West Africa. Ecological modeling, 201(3–4): 301–311. DOI: https://doi.
org/10.1016/j.ecolmodel.2006.09.028
Singh, J and Singh, O. 2020. Assessing rainfall erosivity and erosivity density over a western Himalayan
catchment, India. Journal of Earth System Science, 129(1): 1–22. 2. DOI: https://doi.org/10.1007/
s12040-020-1362-8
Sitterson, J, Sinnathamby, S, Parmar, R, Koblich, J, Wolfe, K and Knightes, CD. 2020. Demonstration
of an online web services tool incorporating automatic retrieval and comparison of precipitation
data. Environmental Modelling & Software, 123: 104570. DOI: https://doi.org/10.1016/j.
envsoft.2019.104570
Somses, S, Bopape, M-JM, Ndarana, T, Fridlind, A, Matsui, T, Phaduli, E, Limbo, A, Maikhudumu, S,
Maisha, R and Rakate, E. 2020. Convection Parametrization and Multi-Nesting Dependence of a
Heavy Rainfall Event over Namibia with Weather Research and Forecasting (WRF) Model. Climate,
8(10): 112. DOI: https://doi.org/10.3390/cli8100112
Thapelo, ST. 2014. Técnicas de aprendizaje automatizado para el pronóstico de temperaturas minímas
en el Centro Meteorológico de Villa Clara, Santa Clara, PhD thesis, Universidad Central “Marta Abreu”
de Las Villas.
Thapelo, TS and Jamisola, RS. 2019. Machine learning for maximum and minimum temperature
analytics and prediction at local level.
Tufa, D, Paul, B, Jessica, S, Kinfe, H, Daniel, O, del Corral, J, Cousin, R and Thomson, MC. 2014.
Bridging critical gaps in climate services and applications in Africa. Earth Perspectives, 1(1): 15.
DOI: https://doi.org/10.1186/2194-6434-1-15
Vanderkam, D, Allaire, J, Owen, J, Gromer, D, Shevtsov, P and Thieurmel, B. 2015. dygraphs: Interface
to’Dygraphs’ Interactive Time Series Charting Library. R package version 0.5.
Vyacheslav, L, Andrew, R and Samuel, S. 2019. Statistics for climate informatics. Environmetrics, 30(4).
DOI: https://doi.org/10.1002/env.2567Wickham, H. 2011. ggplot2. Wiley Interdisciplinary Reviews: Computational Statistics, 3(2): 180–185. Thapelo et al. 13
Data Science Journal
Wickham, H and Wickham, MH. 2016. Package ‘rvest’. URL: https://cran.r-project.org/web/packages/rvest/
DOI: 10.5334/dsj-2021-024
rvest.pdf. DOI: https://doi.org/10.1002/wics.147
Wickham, H and Wickham, MH. 2019. Package ‘stringr’.
Yang, Y, Wilson, L and Wang, J. 2010. Development of an automated climatic data scraping, filtering
and display system. Computers and Electronics in Agriculture, 71(1): 77–87. DOI: https://doi.
org/10.1016/j.compag.2009.12.006
TO CITE THIS ARTICLE:
Thapelo, TS, Namoshe, M,
Matsebe, O, Motshegwa, T and
Bopape, M-JM. 2021. SASSCAL
WebSAPI: A Web Scraping
Application Programming
Interface to Support Access
to SASSCAL’s Weather Data.
Data Science Journal, 20: 24,
pp. 1–13. DOI: https://doi.
org/10.5334/dsj-2021-024
Submitted: 26 May 2020
Accepted: 07 May 2021
Published: 28 July 2021
COPYRIGHT:
© 2021 The Author(s). This is an
open-access article distributed
under the terms of the Creative
Commons Attribution 4.0
International License (CC-BY
4.0), which permits unrestricted
use, distribution, and
reproduction in any medium,
provided the original author
and source are credited. See
http://creativecommons.org/
licenses/by/4.0/.
Data Science Journal is a peer-
reviewed open access journal
published by Ubiquity Press.You can also read