SAVCA 2019 Venture Capital Industry Survey - Covering the 2018 Calendar Year
←
→
Page content transcription
If your browser does not render page correctly, please read the page content below

SAVCA 2019
Venture Capital Industry Survey
      Covering the 2018 Calendar Year
These awards are proudly presented in collaboration with Investec,
              supported by Sanlam Investments.

                                                   Date:
                                              7 November 2019

                                                 Venue:
                               Hilton Sandton, 138 Rivonia Road, Sandton

                                                  Cost:
                               Early bird R550pp (offer ends 20 September)
                                          Standard ticket R750pp

For further information please contact Manusha:
Telephone: +27 11 268 0041                                             Sponsored by
E-mail: manusha@savca.co.za
Table of contents

                                                                                                  Page

                   Foreword                                                                           2

                   Highlights                                                                         4

                   Venture Capital                                                                    8

                   Funds Under Management                                                            10

                   Investment Activity                                                               17

                   Exits                                                                             24

                   Participants                                                                      26

                   Sources of Information                                                            28

                   Glossary | About SAVCA / Venture Solutions                                        30

The Team
Editor: Tanya van Lill
Managing Editor: Buhle Ndweni
Research Partner: Venture Solutions
Production and Sales: Buhle Ndweni, Pule Boroko
Design: Aucourant Design and Reproduction

                                                                SAVCA 2019 Venture Capital Industry Survey | 1
Foreword
                                            SAVCA is proud to present the Venture Capital Industry Survey for 2019. This is the
                                            sixth publication of its kind for the association, with the focus of this report being on
                                            the Venture Capital (VC) activity for the 2018 calendar year.

                                            In previous years, SAVCA published the Venture Capital Industry Survey every two to
                                            three years due to the absence of reported activity in the VC sector. However, since
                                            2017, this is the third consecutive year that the survey has been published, indicating
                                            the substantial growth of investors and early stage deal activity.

                                            The report provides valuable insights for fund managers, investors, entrepreneurs
                                            and policy makers about the South African VC landscape.

                                            In 2018, a total of 181 new deals were reported with 41% of all deals categorised
                                            as start-up capital. The overall value of all deals amounted to just over R1.5 billion.
                                            This was a substantial increase from the R1 billion invested in 2017. It is exciting
                                            to witness that despite a tough economic climate in South Africa, the VC industry
                                            continues to grow.

As in previous years, Independent VC fund managers comprise the largest share of active portfolios (35.1%), with Captive
Government Funds and Angel Investors increasing investment activity fuelling the growth of early stage investments in
South Africa. As the industry starts to mature, we may see more fund managers opting to specialise in specific industries
or new funds being established as new sources of capital become available from institutional investors such as the public
sector, fund-of-fund entities and corporates who want to capitalise on early stage investments as part of their own product/
service expansions.

From a geographic perspective, the majority of investments are still mainly in the Gauteng and Western Cape region.
Interestingly, Gauteng based businesses received the largest share of VC investments in 2018 (R658 million), a 38%
increase from 2017. The Western Cape still remains a hub of activity for many investors with VC investments amounting
to R433 million in 2018. Kwazulu-Natal backed VC businesses saw a substantial increase in 2018 with investments
amounting to R71 million.

Although there has been a healthy increase in the number of deals concluded, the number of exits reported in 2018 declined
in comparison to 2017. A total of 15 exits were reported in 2017, and only 11 exits were reported in 2018. Determining the
lack of exit activity in the sector is something SAVCA will explore, as the continued growth and success of the sector would
be dependent on the number and quality of exits reported.

However, the overall positive outlook of the VC asset class is indicative of a significant improvement from previous years,
an expectation of even further development and growth in the coming years.

SAVCA would like to thank its members and other stakeholders that participated in the survey, as well as our research
partner, Venture Solutions, who made it possible for us to produce this very valuable report.

Tanya van Lill
CEO: SAVCA

2 | SAVCA 2019 Venture Capital Industry Survey
Proudly championing Private
    Equity and Venture Capital

SAVCA is proud to represent an industry exemplified by its dynamic and principled people,
and whose work is directed at supporting economic growth, development and transformation.
SAVCA was founded in 1998 with the guiding purpose of playing a meaningful role in the Southern African venture
capital and private equity industry. Over the years we’ve stayed true to this vision by engaging with regulators and
legislators, providing relevant and insightful research on aspects of the industry, offering training on private equity
and venture capital, and creating meaningful networking opportunities for industry players.

We’re honoured to continue this work on behalf of the industry.

                                                     www.savca.co.za | +27 (0)11 268 0041 | info@savca.co.za | @SAVCAssociation
Highlights

4 || SAVCA
4    SAVCA 2018
           2019 Venture
                Venture Capital
                        Capital Industry
                                 Industry Survey
                                          Survey
Highlights
• 41% of all deals (by value) recorded were categorised as start-up capital (47% if taken by number of deals). The total
  number of active deals invested through seed or start-up deals likewise amounts to almost 60% of all deals to date.

• There were a total of 181 new deals reported in 2018, an increase of 13.8%, in comparison to 159 new deals reported
  in 2017.

• Growth in annual deal activity seen since 2013 remains evident despite a smaller increase in deal activity in 2018
  compared to the significant increases in total deals per year reported for 2015 and 2016.

• Captive Government and Independent Venture Capital (VC) Funds were responsible for over 68% of capital invested
  into the VC sector.

• Gauteng businesses received the largest share of VC money in 2018 (R658 million), up 38% from 2017. The Western
  Cape saw an increase in 2018 of 14% in VC investments amounting to R433 million. Kwazulu-Natal (KZN) backed
  VC business have in 2018 seen a significant increase in activity in comparison to 2017, with R71 million invested in
  2018. The rest of South Africa (deals outside Gauteng, KZN and the Western Cape) have also seen an increase of 28%
  of deal activity year-on-year.

• Overall exit activity remains low. The increase in the number of deal activity coupled with low exit activity is evident of
  a nascent VC industry, with a range of opportunities and early stage investment challenges that need to be addressed
  in order for the industry to continue to grow and mature.

 Highlights          Number of investments recorded over the years 2008 to 2018

                                                                                                                              181

                                                                                                                159

                                                                                                  114

                                                                         98
                                                                                     93

 56

              37

                          25         26                      27

                                                 15

2008          2009       2010       2011        2012        2013        2014        2015         2016          2017          2018

                                                            Year

                                                                                     SAVCA 2019 Venture Capital Industry Survey | 5
Highlights

 Highlights           Contribution by fund manager type; by deal value, all deals still invested

             Angel Investors                             4.2%

             Independent Funds                         35.1%

             Captive Corporate                         15.7%

             Captive Government                        33.7%

             Captive Other                             11.3%

 Highlights           Location of investee company head office; by value of deals, all deals still invested

             Gauteng                                   42.5%

             Kwazulu-Natal                               6.8%

             Western Cape                              48.2%

             Rest of SA                                  2.2%

             Non-South Africa                            0.3%

6 | SAVCA 2019 Venture Capital Industry Survey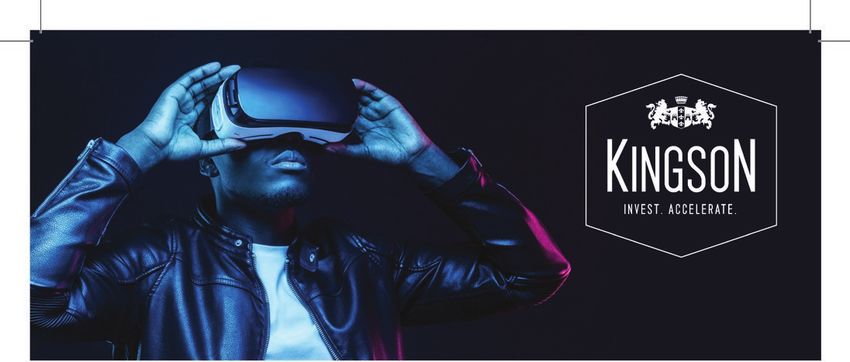
BUILDING A BRIGHTER FUTURE BY
                                  GROWING BUSINESS FOR IMPACT
FUNDS & INVESTORS

                                                                                                                                               EDGE GROWTH
                                                                                                                                               VENTURES

                                     76%                                           5286                                    25% p.a.            IMPACT
                                     BLACK OWNED
                                     SMEs
                                                                                   JOBS
                                                                                   CREATED
                                                                                                                           SME REVENUE
                                                                                                                           GROWTH              STATISTICS
INVESTMENTS

                                     R7.2 Million                                  78                                      R565 Million
                                     AVERAGE SIZE                                  INVESTMENTS                             CAPITAL COMMITTED
                                     OF INVESTMENTS                                MADE                                    ACROSS 16 SECTORS
IMPACT ACHIEVED

                                     R1.2 Billion                                  6                                       112                 JHB: 010 001 3715
                                     ASSETS UNDER                                  FUNDS UNDER                             INVESTORS           CT: 021 671 2658
                                     MANAGEMENT                                    MANAGEMENT                                                  EDGEGROWTH.COM

                    VENTURE INVESTING.
                    DELIVERING SUPERIOR RETURNS.
                    WWW.KINGSONCAPITAL.COM
                    KINGSON CAPITAL (Pty) Ltd I Reg No.: 2015/157452/07
                    An Authorised Financial Services Provider, FSP 46211 I An Approved Venture Capital Company, VCC-0021
Venture
                                                 Capital

8 | SAVCA 2019 Venture Capital Industry Survey
Venture Capital
• Venture Capital (VC) is financing that investors provide to businesses, in the start-up and early growth phases, that they
believe have long term, high growth potential. These are deals predominantly funded by equity. For start-ups without
access to capital markets, venture capital is an essential source of funding. Risk is typically high for investors.
• The need for VC stems from the specific requirements of such businesses, and from the value add role that experienced
VC fund managers can play in structuring, supporting and nurturing those businesses.
• VC is not limited to investments in high-technology type businesses but also extend to other sectors where above-
average growth and associated returns may be found. In such instances, high-growth returns are underpinned by other
factors such as access to large untapped markets, or by differentiators such as exclusive operating licences or comparable
enablers that give the investments substantial advantages over their peers. High-tech businesses nevertheless remain a
primary source of high-growth returns for VC investors. New investment vehicles and regulatory incentives such as
Section 12J in South Africa, as well as emerging market opportunities across the continent continue to broaden the
type of VC investors active in the asset class, as well as the business focus and sectors where investments are made.
• The following categories of venture capital were used in this SAVCA VC Industry Survey:
• Seed capital: Funding provided before the investee company has started mass production/distribution with the
aim to complete research, product definition or product design, also including market tests and creating prototypes.
This funding would not be used to start mass production/distribution.
• Start-up capital: Funding provided to companies, once the product or service is fully developed, to start mass
production/distribution and to cover initial marketing. Companies may be in the process of being set up or may
have been in business for a shorter time, but have not sold their product commercially yet. The destination of
the capital would be mostly to cover capital expenditures and initial working capital.
• Later-stage financing: Financing provided for an operating company, which may or may not be profitable. Late stage
venture tends to be financing into companies already backed by VCs.
• Growth capital: A type of private equity investment (often a minority investment) in relatively mature companies
that are looking for primary capital to expand and improve operations or enter new markets to accelerate the
growth of the business.
• Buyout capital: Financing provided to acquire a company. This is typically funded by purchasing majority or controlling
stakes.
• Rescue/Turnaround: Financing made available to an existing business, which has experienced financial distress,
with a view to re-establishing prosperity.
• Replacement capital: Minority stake purchase from another private equity investment organisation or from another
shareholder or shareholders.
• This SAVCA VC Industry Survey used the following VC investor classifications, which include:
• Angel Investors: High-net worth individuals who inject funding for start-ups in exchange for ownership equity or
convertible debt.
• Captive Funds: Funds in which one shareholder contributes most of the funding, typically where a corporate or
parent organisation allocates funds to the Captive Fund from its own internal resources. Captive Funds may be
subsidiaries of, or divisions within, financial institutions or industrial companies.
– Captive Government: Funds primarily sourced from a government department or public body.
– Captive Corporate: Funds primarily sourced from a corporate entity such as a listed company.
– Captive Other: Funds sourced from family offices.
o Independent Funds: Funds managed by fund managers in which third parties are the main source of capital and
in which no one investor holds a majority stake.
SAVCA 2019 Venture Capital Industry Survey | 9Funds Under
Management
10 | SAVCA 2019 Venture Capital Industry SurveyFunds Under Management
• At the end of 2018, the Southern African VC asset class had R5.37 billion invested in 665 active deals.
• Independent fund managers comprise the largest share of active portfolios by value (35.1%) and by number of deals
(38.5%), followed by Captive Government, by value (33.7%) and Angel Investors by number of deals (24.7%).
• A marginal increase in the number of fund managers in 2018 is due to the entrance of newly formed independent fund
managers drawing on the Section 12J tax incentive. An increase in deal activity is anticipated as a large number of fund
managers have raised money for VC deals, however, have not yet had the opportunity to deploy capital.
• A number of existing fund managers have launched new funds based on specialisation (i.e. investing only in a specific
sector such as health care or energy) or as new sources of capital becomes available for the VC sector from institutional
investors such as the public sector and fund-of-fund entities.
Figure 1a Contribution by fund manager type; by deal value, all deals still invested
Angel Investors 4.2%
Independent Funds 35.1%
Captive Corporate 15.7%
Captive Government 33.7%
Captive Other 11.3%
Figure 1b Contribution by fund manager type; by number of deals, all deals still invested
Angel Investors 24.7%
Independent Funds 38.5%
Captive Corporate 6.5%
Captive Government 19.1%
Captive Other 11.2%
SAVCA 2019 Venture Capital Industry Survey | 11Funds Under Management
• The majority of fund managers operate small portfolios with 64% having less than R50 million in active deals, with
almost 74% of all fund managers operating portfolios containing fewer than 10 deals.
• Ten fund managers have more than R100 million invested in active deals.
• 41% of all deals (by value) and 47% (by number of deals) were categorised as start-up capital. The total number of
active deals invested through seed or start-up deals correspondingly amounts to almost 60% of all deals to date.
• Angel Investors (deal activity reported by individuals), have remained similar from 2017 to 2018.
• With more than half of all transactions reported as early stage deals (seed and start-up capital) rather than growth
stage funding, is a positive indication of the evolving risk-appetite amongst investors and increased access to capital
for early stage deals.
Figure 2a Contribution by stage of the deal; by value of deals, all deals still invested
Seed capital 4.8%
Start-up capital 41.1%
Later-stage financing 19.4%
Growth capital 29.4%
Buyout capital 1.7%
Rescue / Turnaround 3.5%
Replacement capital 0.1%
Figure 2b Contribution by stage of the deal; by number of deals, all deals still invested
Seed capital 12.3%
Start-up capital 46.6%
Later-stage financing 12.2%
Growth capital 25.6%
Buyout capital 1.3%
Rescue / Turnaround 1.4%
Replacement capital 0.6%
12 | SAVCA 2019 Venture Capital Industry Survey23378
Nedbank Ad
WHEN YOU LOOK
AT THE WORLD DIFFERENTLY,
TECHNOLOGY CAN CHANGE
YOUR BUSINESS FOR GOOD.
Nedbank Venture Capital is dedicated to investing in disruptive
technologies that impact society. This was demonstrated
by our recent partnership with Aerobotics, a venture that has
been recognised as one of the world’s most innovative and
successful partnership projects in financial technology.
Partner with us to see the full potential
of your startup business.
VentureCapital@nedbank.co.za
Nedbank Corporate and Investment Banking is a division of Nedbank Ltd Reg No 1951/000009/06.
Authorised financial services and registered credit provider (NCRCP16).Funds Under Management
The following graphs indicate the distribution of active portfolios across the main sectors typical of venture capital. The sector
breakdown follow a similar categorisation that is used by the US and European VC associations.
With this alignment, there is no category for real estate acquisition or property investments as such transactions are not
included in a VC dataset. Likewise, the Agriculture transactions reported in this report excludes transactions that involve
land acquisition, however does include investment activities such as Agritech and Agro-processing.
Manufacturing comrpised 14.2% of the value of all deals invested at 31 December 2018 with Food & Beverage and Medical
Devices & Equipment accounting for 12.3% and 10.5% respectively.
Software amounts to only 5.2% of deals if taken by value, and Consumer Products and Services to 5.4%, but combined
make up 1 in 5 transactions in the overall dataset. Deals into Energy type businesses amount to the fourth largest share in
active deals if taken by value.
Figure 3a Sector, by value, all deals invested
Manufacturing 14.2%
Food & Beverage 12.3%
Medical Devices & Equipment 10.5%
Energy 10.2%
Business Products & Services 7.2%
Fintech Specific 6.4%
Financial Services (non-fintech) 6.2%
Health 5.8%
Consumer Products & Services 5.4%
Software 5.2%
Life Sciences 3.8%
Retailing/Distribution 2.9%
Electronics/Instrumentation 2.2%
Media/Entertainment/Gaming 1.9%
Telecommunications 1.5%
eCommerce 1.3%
Biotechnology 1.2%
Agriculture 0.9%
Mining, Minerals & Chemicals Processing 0.5%
Security Technology 0.4%
14 | SAVCA 2019 Venture Capital Industry SurveyA significant observation is the balance between products and services targeting the consumer, and business activity
that focus on business-to-business offerings. This is evident in the growth in sectors such as Food & Beverage (12.3%
by value, third biggest in the overall portfolio) and Health (5.8% by value).
Consumer Products & Services account for the largest share of active deals by number (10.8%), followed closely by
Manufacturing (10.4%) and Software (9.4%). The latter mirrors the global trend for investing in deals involving Software,
including many transactions classified as Consumer Products & Services where the business activity involves Software.
The World Economic Forum (WEF) Global Competitiveness Index for 2018/2019 again recognised the well-developed
status of the South African financial system. This system includes not only retail and commercial banking and insurance,
but also technology and services for security, mobile banking enablement and data analysis. Investments into early stage
businesses that target these sectors have gone from virtually zero five years ago, to 14% of all deals by number of transactions,
as large financial services sector players are increasingly opening up their supply chains to start-ups and Small to Medium
Enterprises (SMEs).
Figure 3b Sector, by number of deals, all deals invested
Consumer Products & Services 10.8%
Manufacturing 10.4%
Software 9.4%
Fintech Specific 7.9%
Energy 7.7%
Business Products & Services 7.3%
Medical Devices & Equipment 7.5%
Financial Services (non-fintech) 6.0%
Food & Beverage 4.9%
Health 4.8%
eCommerce 4.4%
Electronics/Instrumentation 3.5%
Retailing/Distribution 3.5%
Agriculture 2.5%
Media/Entertainment/Gaming 2.3%
Telecommunications 2.1%
Life Sciences 1.9%
Security Technology 1.7%
Biotechnology 0.8%
Mining, Minerals & Chemicals Processing 0.6%
SAVCA 2019 Venture Capital Industry Survey | 15Funds Under Management
Businesses headquartered in the Western Cape account for the largest share of transactions, both by value (48.2%) and by
number (52.6%) of transactions. All VC deals still invested are mainly prevalent in Gauteng and the Western Cape, with 90.7%
of VC Rands invested in either one of those two provinces.
Figure 4a Location of investee company head office; by value of deals, all deals still invested
Gauteng 42.5%
Kwazulu-Natal 6.8%
Western Cape 48.2%
Rest of SA 2.2%
Non-South Africa 0.3%
Figure 4b Location of investee company head office; by number of deals, all deals still invested
Gauteng 34.6%
Kwazulu-Natal 6.2%
Western Cape 52.6%
Rest of SA 4.3%
Non-South Africa 2.3%
16 | SAVCA 2019 Venture Capital Industry SurveyInvestment
Activity
SAVCA 2019 Venture Capital Industry Survey | 17Investment Activity • The reported value of investments made during 2018 was R1 516 million (2017: R1 160 million), an increase of 31% compared to 2017. The total number of investments increased from 159 in 2017 to 181 in 2018, an increase of 13.8%. • The average deal size of new investments (R8.3 million) in 2018 remained the same as 2017. • By value in 2018, 47% (2017: 57%) of VC deals were categorised as Seed Funding and Start-up Capital. • The five biggest deals concluded in 2018 by Captive Government and Captive Corporate investors alone amounts to R492 million, which is substantially more than the five biggest deals in 2017 amounting to R315 million. • A total of 79% of all deals concluded in 2018 were for investments of R10 million or less. • Over the 10-year period from 2009 to 2018, 775 VC deals were recorded with a total investment of R5.3 billion. The continued expansion in VC activity is evident if comparing an average of 129 deals per year (from 2014 to 2018), to an average of 26 deals per year (from 2009 to 2013). 18 | SAVCA 2019 Venture Capital Industry Survey
Figure 5a          Investments per year (2009 to 2018), by value (ZAR million)

                                                                                                                    1516

                                                                                                     1160

                                                                                       872

                                                                          372
                                      288                     273
242                      211
            194                                   183

2009        2010         2011        2012        2013        2014         2015        2016           2017           2018

                                                          Year

Figure 5b          Investments per year (2009 to 2018), by number of deals

                                                                                                                     181

                                                                                                      159

                                                                                       114
                                                                 98
                                                                           93

 37
             25           26                      27
                                      15

2009        2010         2011        2012        2013        2014         2015        2016           2017           2018

                                                          Year

                                                                                 SAVCA 2019 Venture Capital Industry Survey | 19
Investment Activity
• There has been a significant increase in deals in the Energy sector, with 24 deals reported in 2018 in comparison to four
deals reported in 2017. Business Products & Services recorded 18 deals in 2018, closely followed by 17 deals in Software.
• Financial Services (non-fintech) based deals also saw a significant increase compared to previous years, with 12 deals
reported in 2018 compared to two deals reported in 2017.
• The increased investment in specific sectors, such as Energy and Financial Services, indicate that some VC investors
are starting to specialise in certain sectors.
• Fewer deals were concluded in the Consumer Products & Services and the Food & Beverage sector in 2018, in
comparison to 2017.
Figure 6 Sector allocation per year based on number of deals concluded
2014 2017
2015 2018
2016
Agriculture
Biotechnology
Business Products & Services
Consumer Products & Services
eCommerce
Electronics/Instrumentation
Energy
Financial Services (non-fintech)
Fintech Specific
Food & Beverage
Health
Life Sciences
Manufacturing
Media/Entertainment
Medical Devices & Equipment
Mining, Minerals & Chemicals Processing
Security Technology
Software
Telecommunications
0 5 10 15 20 25
20 | SAVCA 2019 Venture Capital Industry SurveyGauteng based businesses received the largest share of VC investments in 2018 (R658 million), up 38% from 2017.
The Western Cape saw an increase in 2018 of 14% in VC investments amounting to R433 million. This trend indicates
that VC investment activity in Gauteng is growing at a faster pace in comparison to the Western Cape.
Kwazulu-Natal (KZN) backed VC businesses have seen a considerable increase in investment activity in 2018 that amounted
to R71 million, in comparison to R29 million in 2017. This is due to an increase in KZN based VC fund managers that have
the capacity and capability for investment in this region. The rest of South Africa (excluding investments from Gauteng, KZN
and the Western Cape) has likewise seen an increase of 28% year-on-year. This is a positive indicator of VC activity not only
diversifying according to sectors but also according to regions. The majority of overall VC investments is still primarily based
in Gauteng and the Western Cape.
Figure 7a Location of investee company head office by value of deals concluded (ZAR million)
Gauteng
Kwazulu-Natal
Western Cape
Rest of SA
Not SA
800
700
658
600
500
477
Value of Deals
433
400 382 380
300
264
226
200
109 101
100 94
82
73 71
54
36 42
27 29
13 12
4 3
0
2014 2015 2016 2017 2018
Year
SAVCA 2019 Venture Capital Industry Survey | 21Investment Activity
Figure 7b Location of investee company head office by number of deals
Gauteng
Kwazulu-Natal
Western Cape
Rest of SA
Not SA
80
73
70
61
60
54
50
Number of Deals
45
43
41 41
40
34
30
20 19
16
12
10
8 8 8
6
5 5
3
2 2
1 1
0
2014 2015 2016 2017 2018
Year
22 | SAVCA 2019 Venture Capital Industry SurveyFollow-on deals in South Africa are mainly concluded by the original investor resulting in an increase in equity for such deals.
However, the substantial amount of new deals reported for 2018, rather than follow-on transactions, explains the substantial
increase in minority equity stakes (less then 25%) in comparison to previous years.
Figure 8 Equity preferences by year
0% - 25%
25% - 50%
50% +
80%
74.5
70%
60%
57.1
54.3
52.9
51.3
50%
Percentage
41.2
40%
33.4
30.8
30%
25.5
20.2
20%
17.9
14.9
10.6
10% 9.5
5.9
0%
2014 2015 2016 2017 2018
Year
SAVCA 2019 Venture Capital Industry Survey | 23Exits 24 | SAVCA 2019 Venture Capital Industry Survey
Exits
  • 11 exits took place in 2018 compared to 15 in 2017.

  • Six transactions were reported as positive exits.

  • Trade sales remain the preferred exit route.

  • The slowdown in exit activity can to some extent be attributed to poor macro-economic conditions, resulting in fund
    managers holding on to investments for longer until market conditions improve.

  • Overall exit activity remains low. The increase in the number of deal activity coupled with low exit activity is evident of
    a nascent VC industry, with a range of opportunities and early stage investment challenges that need to be addressed
    in order for the industry to continue to grow and mature.

        Figure 9              Number of exits reported per year

                      Profitable

                      Loss

                 15

                 12

                  9
Value of Deals

                  6

                  3

                  0
                                   2015                     2016                 2017                            2018

                                                                   Year

                                                                                        SAVCA 2019 Venture Capital Industry Survey | 25
Participants 26 | SAVCA 2019 Venture Capital Industry Survey
Participants

The list of firms that participated in the SAVCA VC survey are listed below. Only firms that have given consent have been listed.

 4Di Capital*
 Action Hero Ventures
 AngelHub Ventures*
 ASOCapital*
 Bright Light Solar VCC
 Business Partners Limited*
 Cactus Advisors
 Capricorn Capital Partners
 Crossfin Ventures
 Edge Growth Ventures*
 Far Ventures
 Fundamental VCC
 GAIA Venture Capital*
 Getihu (Pty) Ltd
 Grindstone Accelerator
 Grovest*: Grovest Energy Limited*, Grovest Venture Capital Company*, Mdluli Safari Lodge Limited, Rencell Limited, Sunstone Capital Limited,
 WDB Growth Fund*
 Grovest Hospitality Holdings*
 HL Hall and Sons Investments
 Hlayisani Capital*
 Horizen Ventures Africa
 IDF Capital*
 Industrial Development Corporation of South Africa Limited (New Industries SBU)*
 Invenfin*
 Kalon Venture Partners*
 Kigeni Ventures
 Kingson Capital Partners*
 KNF Ventures*
 Knife Capital*
 Laudian Franchise Management One*
 Linkmakers Capital Pty Ltd*
 Lireas Holdings (Pty) Ltd
 Lucid Ventures
 Mianzo Asset Management
 National Empowerment Fund
 Nesa Investment Holdings
 Newtown Partners*
 nReach One
 Optomise Ventures
 Pallidus VCC Solutions
 Persimmon Energy VCC
 Quona Capital
 Sanari Capital*
 Savant Capital*
 Savant Venture Fund*
 Startupbootcamp AfriTech
 Stocks and Strauss
 Team Africa Ventures
 Technology Innovation Agency*
 The Technology Venture Capital Programme managed by the IDC on behalf of the dti
 Westbrooke Alternative Asset Management*
 White Hall Venture Capital Company

*SAVCA Full Members

                                                                                                SAVCA 2019 Venture Capital Industry Survey | 27
Sources of
Information
28 | SAVCA 2019 Venture Capital Industry SurveySources of Information
Objectives and methodology
• This SAVCA VC Industry Survey process entailed gathering and processing data through questionnaires and interviews
with VC fund managers and other investors conducting VC type investments.
• The approach to this survey was similar to the bottom-up methodology used in previous SAVCA VC Industry Surveys
using verifiable data and information about completed VC deals.
Information excluded from survey data:
• The VC asset class globally is comprised of VC type deals made by both individuals and firms. Much of the actual deal
flow is not publicly known, as there are limited regulatory and similar formal processes to require disclosure of investment
activity by VC investors /fund managers. This is even more so given that individual investors operating in their personal
capacity drive a large proportion of the VC asset class. Many investors, especially private individuals prefer to operate
anonymously. There is also a substantial number of unreported deals facilitated by independent fund managers, where
the details of these deals are not disclosed due to strict confidentiality limitations enacted on such fund managers by
their respective investors. Data obtained through surveys of any VC asset class does not therefore reflect the full extent of
VC investment activity within a region.
• Known investors active in the Southern African VC industry, in addition to those listed on the SAVCA Members’ Directory,
include Angel Investors, corporate investors, enterprise development agencies, and government backed institutions
such as those within the ambit of the DSBD and the TIA.
• Deals that entail no equity risk are excluded from this survey.
• Deals that entail equity securitisation have been excluded, such as those that focus primarily on real estate acquisition,
property investments and buying up land for development and agricultural purposes.
Graphs and calculation of totals
Not all respondents supply complete responses for each attribute in the survey, with some for example omitting details
on sector classification, location and stage of the deal. For this reason, totals in some graphs may vary from the actual
total of transactions in the full dataset as graphs are generated using only those records with complete details to report
on the attribute in question.
SAVCA 2019 Venture Capital Industry Survey | 29Glossary 30 | SAVCA 2019 Venture Capital Industry Survey
Glossary

DSBD                                  Department of Small Business Development
Fintech                               Computer programs and other technology used to support or enable banking and
                                      financial services
Fund-of-funder investor               An investment fund that typically manage a portfolio comprising other types of funds
                                      such as VCs, rather than investing directly in VC type transactions. This may include
                                      both public as well as private funders.
SAVCA                                 Southern African Venture Capital and Private Equity Association
Section 12J                           Section 12J of the South African Income Tax Act
TIA                                   Technology Innovation Agency
VC                                    Venture Capital
SAVCA VC Survey                       SAVCA 2019 Venture Capital Industry Survey

 About
 SAVCA
 The Southern African Venture Capital and Private Equity Association (SAVCA) is the industry body and public policy
 advocate for private equity and venture capital in Southern Africa. SAVCA represents about R171 billion in assets under
 management through 180 members that form part of the private equity and venture capital ecosystem. SAVCA promotes
 the Southern Africa venture capital and private equity asset classes on a range of matters affecting the industry. SAVCA also
 provides relevant and insightful research, offers training on private equity and creates meaningful networking opportunities
 for industry players.

 Website: www.savca.co.za
 Twitter: @SAVCAssociation

 Venture Solutions
 Venture Solutions is an innovation management and commercialisation consultancy active in Sub-Saharan Africa.
 The focus is developing high-tech start-ups. Know-how and methodologies target commercialisation of new technologies,
 leveraging intellectual assets for business profits, and structuring start-up businesses for sustainable growth.


                                                                                      SAVCA 2019 Venture Capital Industry Survey | 31
Our Partners
ADVERTISE WITH SAVCA!
                                      SAVCA Publications

                                                    SAVCA 2019                                               SAVCA 2018
A journal of activity and trends in
 Southern African private equity        Private Equity Industry Survey                                Venture Capital Industry Survey
       and venture capital               Insights into the Southern African Private Equity Industry         Covering the 2017 Calendar Year
                                                      covering the 2018 Calendar Year

             2019

                    SAVCA Website Banners and Job Portal

                                      SAVCA Newsletters

                                                       www.savca.co.za | +27 (0)11 268 0041 | info@savca.co.za | @SAVCAssociation
25 February 2020 | Venture Capital | Hazendal Wine Estate
26 - 27 February 2020 | Private Equity | Spier Wine Farm
• Stellenbosch •
For further information please contact Tanys:
Telephone: +27 (0)11 463 5085
E-mail: tanys@soafrica.comYou can also read