Scatterometry and diffractometry techniques to monitor surfaces textured by rapid ultra-short pulse laser - IOPscience
←
→
Page content transcription
If your browser does not render page correctly, please read the page content below
PERSPECTIVE • OPEN ACCESS

Scatterometry and diffractometry techniques to monitor surfaces
textured by rapid ultra-short pulse laser
To cite this article: C Alleaume et al 2020 J. Phys. Photonics 2 031004

View the article online for updates and enhancements.

                               This content was downloaded from IP address 46.4.80.155 on 06/12/2020 at 21:39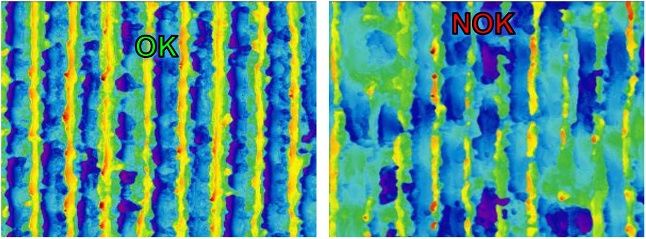
J. Phys. Photonics 2 (2020) 031004 https://doi.org/10.1088/2515-7647/ab92b0
Journal of Physics: Photonics
PERSPECTIVE
Scatterometry and diffractometry techniques to monitor surfaces
OPEN ACCESS
textured by rapid ultra-short pulse laser
RECEIVED
30 December 2019 C Alleaume1, S Alamri2, T Kunze2, J Ziegler3, A Wilson4 and R Bola5
REVISED 1
6 March 2020 AIMEN Technology Centre (Laser Applications Centre), Porriño, Spain
2
Fraunhofer-Institute for Material and Beam Technology IWS, Dresden, Germany
ACCEPTED FOR PUBLICATION 3
13 May 2020
IRIS Technology Group, Madrid, Spain
4
TWI Ltd, Cambridge, United Kingdom
PUBLISHED 5
European Federation for Welding, Joining and Cutting, Porto Salvo, Portugal
26 June 2020
E-mail: rgbola@ewf.be
Original content from Keywords: texturing, scatterometry, diffractometry
this work may be used
under the terms of the
Creative Commons
Attribution 4.0 licence.
Any further distribution Abstract
of this work must The overall aim of the PROMETHEUS project is to develop high power ultra-short pulse lasers and
maintain attribution to
the author(s) and the titlethe associated optics to enable the precise periodic texturing of surfaces to impart a range of
of the work, journal
citation and DOI. surface functionalities at unprecedented processing speeds. The project focusses upon the
industrial application of ultra-short pulse lasers for manufacturing and on the development of
high power ultra-short pulse laser technologies in the range of 700 ps – 10 ns. In summary, new
textures will be manufactured to achieve functional surfaces utilising fewer raw materials, less
energy and less waste; improve accuracy, power and control over existing technologies; increase
achievable precision and minimize heat impact on sensitive materials. This article will provide the
outcomes of the first results achieved from the monitoring solutions being used to assess surface
textures with micrometer resolution.
1. Introduction
Among the different approaches that can be used to fabricate biomimetic structures on surfaces,
short/ultra-short (S/US) laser pulses gained in the last years a high relevance [1–3]. The material removal
takes place locally at the zone where the laser beam is interacting with the substrate surface which also causes
limited chemical surface modification [4]. From an industrial point of view, S/US pulsed laser technologies
are very flexible and allow to treat a wide range of materials, as long as the substrate absorbs the used laser
wavelength (i.e. IR and VIS for metals [5, 6] and UV for polymers [7]). In addition, the scale-up of such
technologies for industrial applications has been already demonstrated in several cases [8].
Although the fabrication of functional surfaces has been demonstrated on different materials, the main
drawback of the traditional direct laser writing (DLW) technology is the long processing time with
machining speeds in the range of minutes per square centimetre [9–11]. Multiple solutions are available for
scaling-up the fabrication speed of DLW including the use of polygonal scanners and multi-beam
approaches. However, the achievable feature sizes of DLW are typically limited to 5–15 µm [12, 13].
Considering the fabrication of periodic patterns with different length scales (larger or even smaller than
the laser wavelength) other well-established laser technologies can be considered such as Direct Laser
Interference Patterning (DLIP) [14, 15]. This method relies on the overlap of two or more coherent laser
beams which results in the formation of well-defined interference patterns.
For a given laser wavelength and number of beams, the spatial period can be easily adjusted by modifying
the angle of the interfering beams [15]. By changing the polarization and the geometrical configuration of
the interfering beams, very different pattern geometries can be created. For instance, in a two-beam
arrangement a line-like pattern is generated whereas a three-beam configuration lead to dot-like patterns.
Although the fabrication of periodic structures using DLIP has been demonstrated on different materials
and employing different laser sources, the assessment of the structuring quality during the manufacturing
process remains an open topic of great interest for its exploitation under industrial conditions. The aim of
© 2020 The Author(s). Published by IOP Publishing Ltd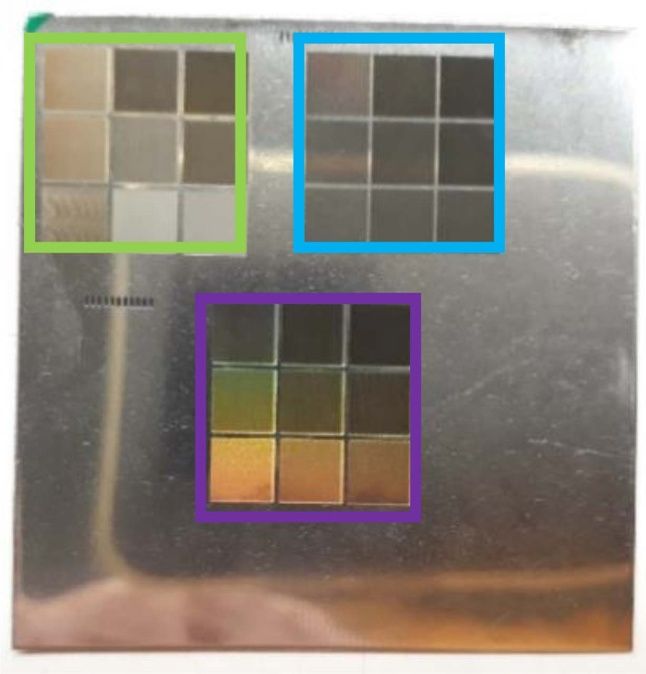
J. Phys. Photonics 2 (2020) 031004                                                                                       C Alleaume et al

                   Figure 1. Schematic of two possible robust Cassie states: (a) trapezoid and (b) inverted trapezoid.

                 Figure 2. Schematic sketch about the wetting of a water droplet on a microgroove patterned surface.

the present work is therefore to demonstrate a promising method to characterize microstructured surfaces
employing scatterometry and diffractometry techniques and their possible implementation in an inline
process monitoring system.

1.1. Hydrophobicity and oleophobicity
Achieving super-hydrophobicity is specific to achieve water repellent surfaces. However, super-oleophobicity
requires surfaces that are not wetted by organic liquids that typically have lower surface tensions compared to
that of water. It has been demonstrated that the synergistic effects of re-entrant topographic features,
combined with tailored surface chemistry properties, helps to promote super-oleophobicity which inherently
provides super-hydrophobic properties. However, it is possible in some cases that oleophobic properties can
occur alongside hydrophilic properties instead. This phenomenon is not fully understood. The
PROMETHEUS project will investigate both hydrophobic properties and oleophobic properties for different
materials.
    In order to achieve hydrophobic/oleophobic properties, a robust Cassie wetting state must be met
[16, 17]; the re-entrant feature must promote the net traction to drive the liquid/air interface to recede to the
top edge of the microstructures, resulting in a three-phase (solid/air/liquid) interface. To simplify, the
microstructures of the material surface can be overall be divided into two types that represent either a
trapezoid (figure 1(a)) or an inverted trapezoid (figure 1(b)).
    In the case of water, the trapezoid microstructures can promote a robust Cassie state for having
hydrophobic surfaces.
    However, according to the design constraint, oils which commonly have very low surface tension and
almost all of their Young’s CAs smaller than 90◦ , are unable to be form a robust Cassie state. In this case, this
can be realised on inverted-trapezoid textures. Thus, inverted-trapezoid surface microstructures are usually
termed re-entrant textures [18].
    In the PROMETHEUS laser station prototype, laser texturing processes will be based on Direct Laser
Interference Patterning (DLIP) by two laser beams. In this case, the pattern generated by the two-beams
interference is a line-like pattern. If a metallic or polymeric surface is patterned with the proper line-like
structures, then this becomes hydrophobic or oleophobic. Figure 2 depicts the wetting behaviour of a water
droplet on a patterned surface.
    The water droplet sits on the top of the patterns with air trapped in between the patterns, thereby giving
rise to hydrophobicity due to composite wetting as described by the Cassie-Baxter model [16, 17]. Based on
previous experimental works performed [34], a line by line laser scanning process will be investigated for the
generation of micro-conical structures and trapezoids on metallic and polymeric samples.

2. Materials and methods

In the scope of the PROMETHEUS project, several European partners have shown interest in the DLIP
surface texturization technology, leading to a large range of materials been studied. Several metals such as

                                                       2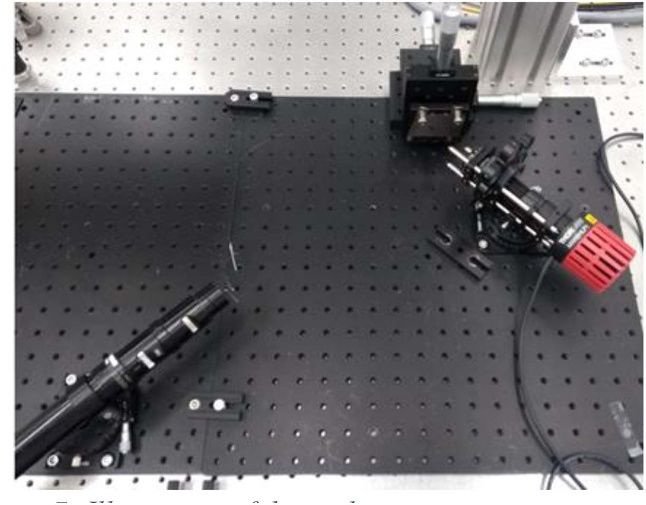
J. Phys. Photonics 2 (2020) 031004 C Alleaume et al
Figure 3. Schematic representation of the DLIP setup (a) and of the pixel-based structuring mechanism (b).
steels and aluminium are currently under investigation and are showing promising results in both the
texturization process and in the physical property obtained.
For the laser experiments, a compact diode-pumped Nd:YLF laser (Tech 1053 basic, Laser Export,
Russia) emitting 15 ns pulses with TEM00 mode (Gaussian beam) at 1053 nm was used to irradiate the
materials. The main laser beam was then directed through a compact DLIP optical module (developed at
Fraunhofer IWS, Dresden) capable to fabricate line-like interference patterns with varying spatial periods
(software-controlled). The main laser beam is divided into two sub-beams by a diffractive beam-splitting
element. The two sub-beams are collimated by a prism and then overlapped by a lens onto the sample surface
resulting in a line-like interference pattern in a well-defined interference area (denoted as DLIP pixel), as
depicted in figure 3(a). By changing the distance between the beam-splitting element and the prism, the
interference period Λ can be selectively changed in a range of 1.5–8.5 µm. The size of the DLIP-pixels Ø in
the working position is ~100 µm.
High precision positioning stages (AEROTECH PRO115) were used for displacing the sample and
distributing the interference pattern over a larger area both in the direction parallel and perpendicular (hatch
distance h) to the interference pattern, as highlighted in figure 3(b). The quantity p defines also the
pulse-to-pulse overlap and can be expressed as number of pulses per pixel (P/px) which also denotes the
cumulative fluence dose.
It is worth mentioning that the h value have been adjusted for the employed spatial period, in order to
match a distance equal to an entire multiple of the period. In the present work, a period of 8.5 µm and a
hatch distance of 25.5 µm have been used.
2.1. Characterization and selection of textures
Once a matrix of sample is manufactured, their properties are studied, in order to select the best process
parameters for a successfull texturization. Two aspects are mostly looked at in this phase: on one hand, the
reproducibility of the pattern, and on the other hand the physical properties of the newly texturized material.
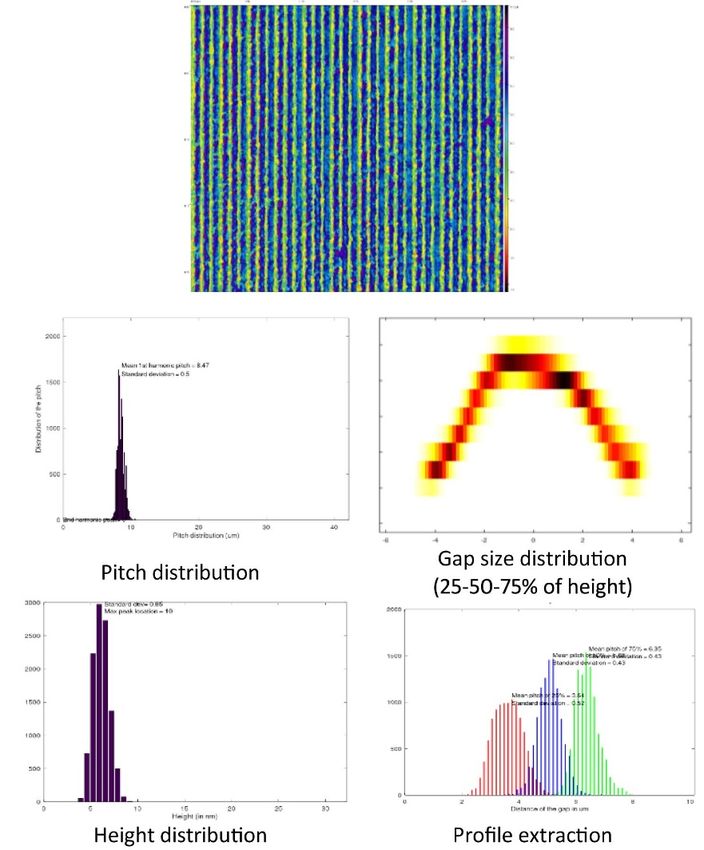
Regarding the reproducibility of the pattern, a valley detection algorithm was developed at AIMEN, in
order to identify each individual period and easily extract the associated geometrical parameters. An
illustration of this algorithm applied to a reproducable texture can be found in figure 4. By using this
algorithm on all samples, it become obvious that some strategies for texturing are not optimal. The main
parameters of the texturing process been the number of laser pulses and the energy of each laser pulse, we
can observe that if a low energy is used on the laser, the desired patterns tend not to appears correctly on the
surface. Using more pulses with lower energy does not always compensate for this issue, even with the same
total energy. To the contrary, using too much energy in the pulses leads to a degraded material, and a
non-reproducible pattern, even with less pulses.
For each texture, an optimal texturing strategy is then obtained. An illustration of this selection can be
found in figure 5 where both a ‘good’ and a ‘bad’ cases are shown side by side for comparison. Table 6 gives
the actual values found by the detection algorithm with both mean value and standard deviation for different
fabrication receipes.
The other aspect of the qualification of the textures concern the physical properties. Indeed, the
PROMETHEUS project been designed to create hydrophilic or hydrophobic materials, a contact angle
measurement is performed on the fabricated DLIP textures [19, 20]. An example of the contact angle
measurement can be found in figure 6. Note that this method is limited to the reaction with water and is
therefore not always directly linked to the requested property of the final product: for instance, if the final
product will be in contact with oil (like for the case of a car’s engine component) or oily products (like
3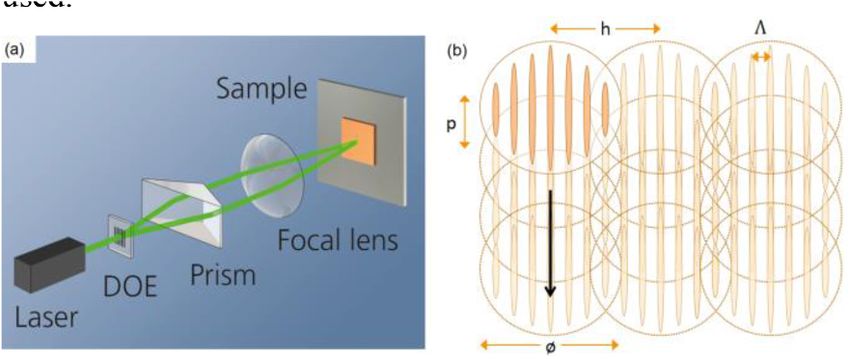
J. Phys. Photonics 2 (2020) 031004

                                                               Table 1. Results for different process recipe for the aluminium sample.

                                                               pitch    pitch std (%)      height (µm)        height std (%)       width (µm)   width std (%)   slope   Slope std (%)   Valid flag (%)

4
    Aluminium—target pitch 8.5 µm—03 P/px—low laser power      8.49     7.31               2.51               21.37                4.20         11.63           0.38    29.30           100
    Aluminium—target pitch 8.5 µm—03 P/px—medium power         8.53     6.71               4.00               17.40                4.50         12.84           0.67    29.58           99
    Aluminium—target pitch 8.5 µm—03 P/px—high laser power     8.53     9.58               5.29               19.12                4.42         14.54           0.92    30.77           99
    Aluminium—target pitch 8.5 µm—10 P/px—low laser power      8.47     5.92               6.45               13.20                5.08         8.44            1.30    18.86           100
    Aluminium—target pitch 8.5 µm—10 P/px—medium laser power   8.51     7.06               9.40               22.69                5.15         13.59           1.66    37.39           100
    Aluminium—target pitch 8.5 µm—10 P/px—high laser power     8.54     9.94               9.61               30.72                5.62         16.08           2.03    60.43           93
    Aluminium—target pitch 8.5 µm—17 P/px—low laser power      8.47     6.42               8.08               17.05                5.42         8.40            1.67    21.50           100
    Aluminium—target pitch 8.5 µm—17 P/px—medium power         8.47     10.92              8.25               31.50                5.94         14.79           1.82    60.01           90
    Aluminium—target pitch 8.5 µm—17 P/px—high laser power     8.70     15.41              7.35               42.22                6.47         14.74           1.78    63.27           75
                                                                                                                                                                                                         C Alleaume et al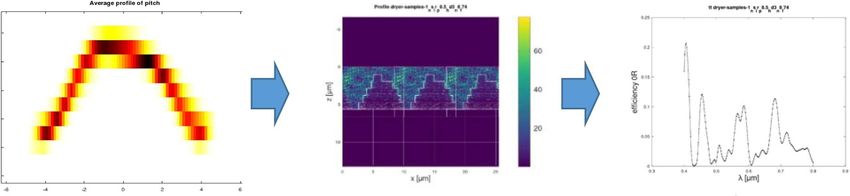
J. Phys. Photonics 2 (2020) 031004                                                                                    C Alleaume et al

                   Figure 4. Extraction of the geometrical parameters and typical profile from the confocal images.

   Figure 5. Example of OK and NOK texture definition: The texture on the left show a 6% standard variation in the 8.5 um optimal
   pitch, a 8% variation in width and a 13% variation in height, therefore its considered OK. The texture on the right show a 22%
   standard variation in the 8.5um optimal pitch, a 24% variation in width and a 31% variation in height, therefore it is considered
   NOK.

cosmetics product), the relation between the contact angle and the behaviour with the final product will not
necessary be linear [21].
    However, as a first approach, a set of potential strategies for texturing the end-materials are selected and
will be tested by the different customers in order to assess a first corelation between theoretical models and
the real application. Eventually, a range of geometrical properties (such as pitch, gap width, structure height
and slope) will be selected, as those properties are the ones that are responsible for the physical property of
the material [19]. An ideal DLIP laser strategy will be later developed to create the line-like structures with
the highest reproducibility.
    (θc > 160◦ )

2.2. Process qualification: scatterometry
During the process of characterization of the line-like structures described earlier, the geometrical
characteristics of the lines are studied, and a good reproducibility of those geometrical characteristics is
expected. Those values have been extensively studied with the help of a confocal microscope and a scanning
laser microscope, among others. However, such technics are very time consuming and cannot be
implemented in-line during the manufacturing process.

                                                      5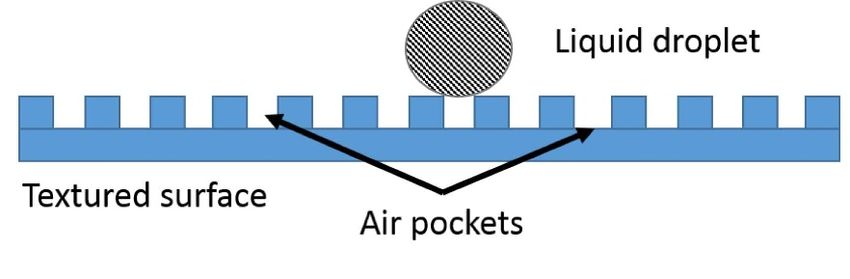
J. Phys. Photonics 2 (2020) 031004                                                                      C Alleaume et al

                                     Figure 6. Contact angle measurement of a hydrophobic structure.

                                       Figure 7. Illustration of the preliminary scatterometry setup.

     Therefore, in order to monitor the quality of the process, a different approach is being adapted: the
scatterometry technology [22], in which we compare the measured reflected light on the texturized sample,
with an optical model of RCWA.
     For the measure of the reflected light, a preliminary setup has been mounted at AIMEN. In this setup, a
white polarized and collimated light is shined into the texturized sample, as illustrated in figure 7. The
sample which contains a line-like structure that acts as a diffraction grating will diffract light in a
well-defined way. Each diffraction order will have a certain intensity which will depend on several parameters
such as the angle of incidence, the polarization, the wavelength, the optical index of the material, the order
itself (1st order, 2nd order…), and finally the geometrical parameters of the lines. This means that, since we
are shining a white light onto the sample, each wavelength will reflect a different quantity of energy in 0th
order, that is strongly dependent of the geometrical parameters. A spectrum of intensity of reflected light is
therefore obtained experimentally for the 0th order of diffraction for different wavelengths.
     This behavior of a predictable reflection/diffraction has been extensivally explained and study by the
scientific literature [23–25] and is only adapted in the PROMETHEUS project with the expected geometrical
dimension required by hydrophobic/hydrophylic textures.
     The measured reflected spectrum is directly compared with a commecial RCWA simulator. The
geometrical parameters are injected directly into the simulator, along with the optical index of the material,
the polarization and the angle of incidence. By changing the value for the wavelength in the simulator, the
full spectrum of intensity of the reflected light for the 0th of diffraction is also obtained. Figure 8 illustrated
this spectrum generation principal, where for a given experimental typical profile, we can obtain the
spectrum reflected by the sample, by simulating the electromagnetic propagation of the 0th order with a
RCWA simulator.
     If the sample is correctly fabricated and present a good enough reproducibility, both spectrums from the
measurement and from the simulator should match. This has been proven to work succesfully for at least one

                                                        6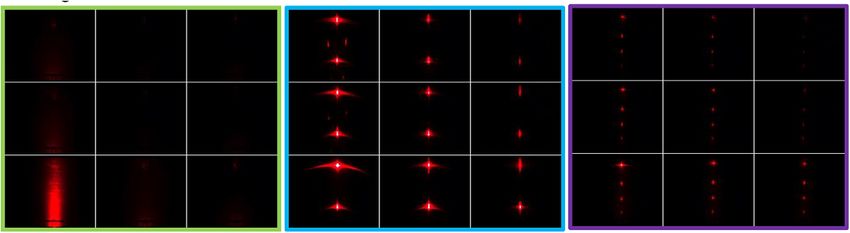
J. Phys. Photonics 2 (2020) 031004                                                                                     C Alleaume et al

   Figure 8. Illustration of the RCWA method. From the standard profile, a simulation is run to obtain the reflection spectrum of the
   0th order of diffraction.

                                     Figure 9. Comparison between measurement and simulations.

sample in such a way that we can successfully correlate the measured spectrum with the RCWA simulation as
illustrated in figure 9.
     Such a scatterometry technology offers the advantage of been easily scalable in term of speed.
Implementing a scatterometry technique has been proven very efficient in other industries such as
semi-conductor [26], nanoimprint [27], grating structure [28, 29] and hologram fabrication [30], and it has
been proven to be a very effective and time efficient qualification method for line-like structures.
     One difficulty that is already forseen with the proposed technic reside in the retrieval algorithm. In the
literature, different technics are proposed to match the measured sample with the simulated sample. The
most commonly used is the direct libery search [22]. This implies that a large number of samples are
simulated, and an algorythm is developed in order to find a match within this library.
     In the PROMETHEUS project, a sligthly different approach is anticipated, and a neural network will be
trained to find and match the measured spectrum, and therefore validate the parameters defining the texture
(height, pitch, gap, slope…). The idea is to simulate thousands of spectrum corresponding to structures
within the observed standard variation of the geometrical parameters (for example, 5% height fluctuation),
and to fed the neural network with those ‘good’ spectrum. The same is done with ‘bad’ sample. If the neural
network is successful, it should be able to identify which structures are from a ‘good’ sample, and therefore
be able to validate the fabrication process in-line with the scatterometry technics, eliminating the need for

                                                       7
J. Phys. Photonics 2 (2020) 031004 C Alleaume et al
Figure 10. Photograph of the studied sample containing the matrix of textures.
Figure 11. Diffraction patterns of a textured sample, obtained by the diffractometry prototype.
time-consuming measurement. Such methodology has already been proven to be working by different
studies [31, 32].
2.3. Process qualification: diffractometry
Complementary to scatterometry characterization, diffractometry is being established as optical monitoring
technique in a dedicated setup at IRIS in order to obtain the necessary information on surface geometry and
thus assess structure quality.
Diffractometry is an optical technique, similar to scatterometry, that analyzes the diffraction pattern
produced by a microstructured surface when light interacts with it [25]. The main requirements for the
illumination in the case of a diffractometry measurement are the high directionality of the light and its
monochromaticity (because scattering angles depends both on the size of the scatterers and the wavelength
of incident light). Those two conditions are easily fulfilled by using a laser source.
In case of periodic structures, experimental parameters such as diffraction angle separation between the
orders and orientation of the diffraction orders are measured in order to deduce sample features like the
period and orientation of the lines. The depth of the lines may be determined by measuring the intensity of
the diffracted spots, the degree of order/disorder by measuring the relative intensity of peaks compared to
background etc This technique provides average information of all the lines illuminated. The optical analysis
can be enhanced by optimizing the polarization state and direction of the light as well as its wavelength.
Preliminary measurements of the diffraction behavior from textures with line-like structures are shown
in figure 11. The photograph (figure 10) displays the sample matrix with three panels (framed in green, blue
and purple) of textures, all fabricated with varying process parameters. The corresponding diffractometry
measurements for each texture in the respective panel were obtained by a prototype lab rig (excitation
wavelength 638 nm, 30◦ incidence angle) and exhibit characteristic diffraction patterns. A clear dependence
on the process parameters is observable. While most of the textures in the green panel do not reveal a clear
diffraction pattern due to a potentially strong extinction of the incident visible light, the situation is different
8J. Phys. Photonics 2 (2020) 031004 C Alleaume et al
in the blue and purple panels. Here, the individual diffraction orders are more pronounced and related to the
different texture dimensions. Structural information will be deduced in the future from the distances
between the diffraction orders and also from their shapes. Especially in the blue panel, additional features are
visible, indicating a deviation from perfectly straight and regular lines on the texture. Moreover, sample
structures with more complex diffraction patterns will be analyzed in forthcoming studies in order to
establish a correlation to the process parameters, supported by the aid of RCWA model simulations [33].
3. Risks and challenges
In order to successfully implement the scatterometry or diffractometry technique within the PROMETHEUS
project, several aspects need to be considered and accounted for. Although they have already been
successfully implemented in other industries where the reproducibility of the structures is very high its
implementation within the PROMETHEUS project presents some challenges.
One risk is due to the ‘low’ reproducibility of the line-like pattern. Indeed, even with the best initial
texturing strategies, a 5% to 10% error margin can be found on the geometrical parameters of the lines
(width, height, slope…). This is widely bigger than the error found in the semi-conductor or in the
nanoimprint industries. Those fluctuations will yield different spectrum, which still needs to be fully
identified and quantify, for the validation algorithm to successfully recognize if the patterns have properly
been engraved.
Another risk comes from the fact that some structures present a strong extinction for visible and infrared
wavelengths. Therefore, a very large spectrum needs to be analysed in order to successfully identify the
structures. Apart from being a challenge for integration due to a more complex setup, strategies have to be
developed to prevent potential limitations in case diffraction orders are hardly detectable.
The final challenge to overcome is the scalability of the spectrum/angular measurement and matching
with a database in order to deduce the geometrical parameters, or at least an OK/NOK. Indeed, if it is easy to
compare a given simulated spectrum with a measured spectrum offline, this is not sufficient for in-line
measurement during process. A full invert model needs to be built with a large spectrum database, capable of
retro-finding the geometrical parameters from a measured spectrum. Not only this model needs to
accurately predict the geometrical parameters, but it also needs to do it with enough speed that it does not
slow down the process, a challenge which will be approched in the near future in order to facilitate the
successful implementation of an in-line monitoring technique.
4. Conclusions
Within the PROMETHEUS project, we successfully created a first surface textured using the Direct Laser
Interference Patterning (DLIP) technology, which resulted in hydrophobic and hydrophilic surfaces. The
used DLIP setup will be further developed with the goal of implementing it on an industry compatible and
scalable prototype.
Two inline characterization approaches are currently being developed to validate the DLIP texturization
process, in particular scatterometry and diffractometry. Those techniques need to be able to determine the
quality of the textures with high speed and high accuracy in order to be successfully implemented inline into
the DLIP prototype machine.
Both complementary techniques are currently being studied, and measured spectrum are manually
compared with optical model and RCWA simulation. The preliminary results are promising, and both
techniques give useful information on the texture’s characteristics and quality of the texturing process.
The next steps are to match the measured spectrum with the simulated spectrum, to built-up an invert
model in order to retrofit the geometrical parameters from the measured spectrum.
Eventually, the PROMETHEUS project supported by the EU Horizon 2020 project aims to create a
scalable prototype that can generate and validate hydrophobic/oleophobic and hydrophilic/oleophilic
structures in a way that is relevant for the industry. Such prototype would lead to a large diffusion of new
products within the consumer market.
Acknowledgments
This project has received funding from the European Union’s Horizon 2020 research and innovation
programme under grant agreement No 825503—PROMETHEUS and from the “Photonics Public Private
Partnership“ www.photonics21.org.
9J. Phys. Photonics 2 (2020) 031004 C Alleaume et al
ORCID iD
R Bola https://orcid.org/0000-0001-7789-3458
References
[1] Yan Y Y, Gao N and Barthlott W 2011 Mimicking natural superhydrophobic surfaces and grasping the wetting process: a review on
recent progress in preparing superhydrophobic surfaces Adv. Colloid Interface Sci. 169 80–105
[2] Wong W S Y, Stachurski Z H, Nisbet D R and Tricoli A 2016 Ultra-durable and transparent self-cleaning surfaces by large-scale
self-assembly of hierarchical interpenetrated polymer networks ACS Appl. Mater. Interfaces 8 13615–23
[3] Wermuth L, Kolb M, Mertens T, Strobl T and Raps D 2015 Superhydrophobic surfaces based on self-organized TiO2-nanotubes
Prog. Org. Coat. 87 242–9
[4] Cardoso J T, Garcia-Girón A, Romano J M, Huerta-Murillo D, Jagdheesh R, Walker M, Dimov S S and Ocaña J L 2017 Influence of
ambient conditions on the evolution of wettability properties of an IR-, ns-laser textured aluminium alloy RSC Adv. 7 39617–27
[5] Garcia-Girón A, Romano J M, Liang Y, Dashtbozorg B, Dong H, Penchev P and Dimov S S 2018 Combined surface hardening and
laser patterning approach for functionalising stainless steel surfaces Appl. Surf. Sci. 439 516–24
[6] Romano J-M, Gulcur M, Garcia-Giron A, Martinez-Solanas E, Whiteside B R and Dimov S S 2019 Mechanical durability of
hydrophobic surfaces fabricated by injection moulding of laser-induced textures Appl. Surf. Sci. 476 850–60
[7] Chen F, Zhang D, Yang Q, Yong J, Du G, Si J, Yun F and Hou X 2013 Bioinspired wetting surface via laser microfabrication ACS
Appl. Mater. Interfaces 5 6777–92
[8] Jansen F, Budnicki A and Sutter D 2018 Pulsed Lasers for Industrial Applications Laser Tech. J. 46–9
[9] Arnaldo D et al 2010 Picosecond laser machined designed patterns with anti-ice effect Lpm 2010 9–12
[10] Wu B, Zhou M, Li J, Ye X, Li G and Cai L 2009 Superhydrophobic surfaces fabricated by microstructuring of stainless steel using a
femtosecond laser Appl. Surf. Sci. 256 61–6
[11] Long J, Fan P, Gong D, Jiang D, Zhang H, Li L and Zhong M 2015 Superhydrophobic surfaces fabricated by femtosecond laser with
tunable water adhesion: from lotus leaf to rose petal ACS Appl. Mater. Interfaces 7 9858–65
[12] De Loor R 2013 Polygon scanner system for ultra short pulsed laser micro-machining applications Physics Procedia 41 544–51
[13] Kuang Z, Liu D, Perrie W, Edwardson S, Sharp M, Fearon E, Dearden G and Watkins K 2009 Fast parallel diffractive multi-beam
femtosecond laser surface micro-structuring Appl. Surf. Sci. 255 6582–8
[14] Nakata Y 2016 Interference laser processing Adv. Opt. Techn. 2016 2–6
[15] Voisiat B, Gedvilas M, Indrišinas S and Picosecond-laser R G 2011 4-beam-interference ablation as a flexible tool for thin film
microstructuring Physics Procedia 12 116–24
[16] Oliver J F, Huh C and Mason S G 1976 The apparent contact angle of liquids on finely grooved solid surfaces-A SEM study J. Adhes.
8 223–34
[17] Arumugam V et al 2018 Innovative approach for suppressing corrosion of SS304 steel in saline water environment Anti-Corrosion
Methods and Materials 76 484–91
[18] Tutela A et al 2007 Designing Superoleophobic Surface Science 318 1618–22
[19] Babooram S 2013 Superhydrophobic and superhydrophilic surfaces Technical Report
[20] Yuan Y et al Contact Angle and Wetting Properties Surface Science Techniques (Berlin: Springer) pp 3–34
[21] Kanna R et al 2017 Analysing contact angle of different fluids present in petroleum reservoirs international refereed J. Eng. Sci. 6
32–6
[22] Madsen M H and Hansen P-E Optics Express 24 1109–17
[23] Moharam M G, Grann E B, Pommet D A and Gaylord T K 1995 J. Opt. Soc. Am. A 12 1068–76
[24] Gross H, Model R, Bär M, Wurm M, Bodermann B and Rathsfeld A 2006 Measurement 39 782–94
[25] Feidenhans’l N A 2016 Optical Characterization of Nanostructured Surfaces (Kongens Lyngby: DTU Nanotech)
[26] Raymond C 2005 Overview of scatterometry applications in high volume silicon manufacturing AIP Conf. Proc. 788 398
[27] Kreuzer M et al 2018 In-line metrology for roll-to-roll UV assisted nanoimprint lithography using diffractometry APL Material
6 058502
[28] Hansen P-E, Madsen M H, Lehtolahti J and Nielsen L 2017 Traceable Mueller polarimetry and scatterometry for shape
reconstruction of grating structures Appl. Surf. Sci. 421 471–9
[29] Moharam M G et al 1995 Formulation for stable and efficient implementation of the rigorous coupled-wave analysis of binary
gratings J. Opt. Soc. Am. 12 1068–76
[30] Tamulevičius T et al 2018 Dot-matrix hologram rendering algorithm and its validation through direct laser interference Patterning
8 14245
[31] Robert S et al 2002 Characterization of optical diffraction gratings by use of a neural method J. Opt. Soc. Am. A 19 24–32
[32] Kallioniemi I, Saarinen J and Oja E 1998 Optical scatterometry of subwavelength diffraction gratings: neural-network approach
Appl. Opt. 37 5830–5
[33] Moharam M G and Gaylord T K 1982 Diffraction analysis of dielectric surface-relief gratings J. Opt. Soc. Am. 72 1385–92
[34] Delgado García T et al 2019 Fabrication of micro/nano fluidic silicon moulds by a mix-and-match methodology Proc. ICALEO in
press
10You can also read