Adsorption Studies and Selective Determination of Epinephrine at Glycerol-Clay Modified Glassy Carbon Electrode
←
→
Page content transcription
If your browser does not render page correctly, please read the page content below
Int. J. Electrochem. Sci., 12 (2017) 9601 – 9618, doi: 10.20964/2017.10.56

                                                                        International Journal of
                                                                        ELECTROCHEMICAL
                                                                                SCIENCE
                                                                              www.electrochemsci.org

Adsorption Studies and Selective Determination of Epinephrine
at Glycerol-Clay Modified Glassy Carbon Electrode
Augustine O. Agyeman

Department of Chemistry and Physics, Clayton State University, 2000 Clayton State Blvd
Morrow, GA 30260
E-mail: aagyeman@clayton.edu

Received: 20 June 2017 / Accepted: 9 August 2017 / Published: 12 September 2017

Cyclic voltammetry (CV) was employed to conduct continuous repetitive scans of epinephrine (EP) at
glassy carbon electrode coated with a mixture of glycerol and Standard Wyoming montmorillonite clay
(SWy-2). The glycerol-clay modified electrode (GCME) was used to monitor the interfacial behavior
and adsorption properties of EP and its oxidation product, adrenochrome. The clay film catalyzed EP
oxidation and greatly enhanced the generation, accumulation, and adsorption of adrenochrome,
without compromising system sensitivity. Progressive adsorptive accumulation was observed during
repetitive scanning and maximum adsorptive accumulation (MAA) was achieved only when system
pH was 7.4. A linear response was obtained in the range of 0.2 μM to 75.0 μM, with detection limit of
0.1 μM (S/N = 7). The surface coverage of the adsorbed species exhibited linear relationship with the
bulk concentration, in accordance with the Langmuir isotherm. The adsorption coefficient obtained
from the Langmuir isotherm was 41.3 L/g. The enhanced adrenochrome reduction peak was utilized
as a simple and unique approach for selective determination of EP in the presence of serotonin,
ascorbic acid, and uric acid.

Keywords: Montmorillonite clay, epinephrine, adrenochrome, adsorption, cyclic voltammetry

1. INTRODUCTION

         Standard Wyoming montmorillonite (SWy-2) is a type of clay that demonstrates good
electrochemical properties and has the ability to form membrane-like films. It also has high thermal
stability and exhibits high resistance to extreme conditions. SWy-2 clay film on an electrode surface
has the ability to increase sensitivity, selectivity, and electron transfer rate due to the unique size,
shape, and layer charge [1-4]. The high surface area of clay particles [1, 5] also allows for higher
adsorption of molecules. Glycerol is a chemical that is very stable, inert, and nonvolatile. Extremely
Int. J. Electrochem. Sci., Vol. 12, 2017 9602
strong interactions result when glycerol intercalates into clay [6].
Epinephrine (EP), commonly called adrenaline, is one of the very important monoamine
neurotransmitters in the central nervous system (CNS) of mammals. EP is involved in a variety of
mental disorders and low levels have been found in patients with Parkinson’s disease [7, 8]. EP is also
used widely as a drug for heart surgeries, for serious allergic reactions, and under emergency medical
situations [9, 10]. Analysis of EP is, therefore, essential for nerve physiology and for the development
of EP medications. Many methods have been reported for the determination of EP, such as
fluorescence, chemiluminescence, liquid chromatography, and capillary electrophoresis [11-14].
However, most of these methods are time consuming, complicated, and have low sensitivity, because
they require derivatization or a combination of various detection techniques.
Many of the chemical processes performed by EP in the CNS are considered to be organic
electrochemical processes. [15, 16]. Current methods, therefore, focus on electrochemical detection
because of cost, simplicity, high sensitivity, and high accuracy [8, 17-27]. Electrochemical oxidation
of EP to quinone has been studied and reports show that its electron transfer rate is slow so is often
adsorbed to the electrode surface and causes passivation [21, 23-25, 28-30]. Other disadvantages of
EP detection are overpotential and poor selectivity. [21, 31, 32].
However, none of the published studies focused on the interfacial behavior and adsorption
properties of EP. A study of the adsorption processes of EP at electrode surfaces is of great
importance to biological, biochemical, and pharmacological research, as well as the development of
EP medications. Such a study would also reveal a host of potential applications in catalytic
decomposition of various pharmaceutical pollutants, selective analysis of biological fluids, wastewater
treatment, and gel sensor systems.
The adsorption phenomena can be complex due to the heterogeneous nature of the electrode-
solution interface [33]. The strength of interaction between the surface sites and the adsorbing species
may be unevenly distributed across the electrode surface. Modification of the electrode surface with
the clay film is believed to generate a more homogeneous interface, improving electrochemical
behavior of EP. Glassy carbon is an inert electrode and has low electrode fouling so is expected to be
able to overcome any adsorption problems when coated with an appropriate membrane such as the clay
film [34].
Catechol and Catecholamines readily adsorb onto metal oxide and clay minerals, with
increasing surface coverage as pH increases [15, 35, 36]. SWy-2 is an Fe-bearing smectite clay
mineral that contains about 2.3 mass percent lattice Fe (0.41 mol Fe/ g clay), hence strong interaction
between EP and structural Fe3+ in the clay interlayers is expected [37, 38].
The objective of this study was to explore the various factors that affect EP adsorption at
electrodes, using glycerol-clay modified glassy carbon electrode (GCME). The oxidation of EP as
well as the accumulation, adsorption, and reduction of adrenochrome (EP’s oxidation product) were
monitored through continuous repetitive cyclic voltammetric scanning. It was observed that the
GCME effectively catalyzed the oxidation of EP and facilitated the accumulation and adsorption of
adrenochrome. Progressive accumulation was also observed during repetitive scanning. System
equilibrium and maximum adsorptive accumulation (MAA) were achieved only at the physiological
pH (7.4). The system also obeyed the Langmuir isotherm.Int. J. Electrochem. Sci., Vol. 12, 2017 9603
Further, the enhanced adsorption of adrenochrome, and hence increased reduction peak, was
utilized for the selective determination of EP in the presence of serotonin (5-HT), excess ascorbic acid
(AA), and excess uric acid (UA). EP coexists in biological fluids with 5-HT, AA, and UA, all of
which have similar oxidation potentials. Various materials have been used to modify electrodes for
selective detection or co-detection of EP, 5-HT, AA, and UA. [7-10, 15, 39-42]. However, these
modified electrodes suppress adsorption and only make use of the oxidation potential, which is usually
challenging. The present method is unique in the sense that the GCME rather enhances preferential
adsorption and EP is determined using the increased reduction peak, which belongs to only EP.
2. EXPERIMENTAL
2.1 Chemicals and Clay
Glycerol (Mallinckrodt Chemical Works), Epinephrine (Acros Organics), Ascorbic acid
(Sigma-Aldrich), serotonin (Alfa Aesar), uric acid (MP Biochemicals), sodium phosphate monobasic
(Acros Organics), and sodium phosphate dibasic (Fisher Scientific), were used as received. SWy-2
clay was obtained from the Source Clay Minerals Repository (Purdue University, East Lafayette,
Indiana) and processed as described below. All chemicals and clays were prepared without further
purification with 18 mΩ.cm3 nanopure deionized water (Barnsted Easypure II, Thermo Scientific).
2.2 Clay Suspension
For every 15 g of the powdered clay, 500 mL of deionized water was added and stirred
periodically for about 48 hours. The suspension was centrifuged at 5000 rpm (3214 rcf) for 30
minutes, using Eppendorf 5810R centrifuge. The supernatant was decanted and centrifuged again for
10 minutes. This process was repeated until no more clay particles settled at the bottom of the
centrifuge tubes. The concentration of the resulting clay suspension was 7.61 mg/mL, as determined
by gravimetric analysis. The clay particle size of the suspension was less than 0.2 μm, as described
elsewhere [4].
2.3 Modified Electrodes
Clay suspension and glycerol (99% pure) were mixed in the ratio 95:5 by volume, unless
otherwise stated. The mixtures were sonicated for two hours, using Cole-Parmer Ultrasonic Bath, and
left to stand for at least twenty four hours to achieve homogeneity. With the aid of a microliter
syringe, 5 L of the glycerol-clay mixture was smeared uniformly on a polished glassy carbon working
electrode and left overnight to air dry (referred to as GCME).Int. J. Electrochem. Sci., Vol. 12, 2017 9604
2.4 Phosphate Buffer Solution (PBS)
All solutions were prepared with 0.1 M phosphate buffer solution (PBS; NaH2PO4/Na2HPO4)
in order to maintain solution pH of 7.40, unless otherwise stated.
2.5 Fourier Transform Infrared (FTIR) Microscopy
The Perkin Elmer Spotlight 200i FTIR Microscopy System was used for simultaneous imaging
and acquisition of IR spectra. Liquid nitrogen was used to maintain low and constant detector
temperature, ensuring high quality and reproducible results. GCME films were prepared on FTIR base
microscope slides and air-dried overnight. With each slide on the microscope stage of the system,
images (400 µm x 400 µm) and IR spectra in the micro-ATR mode were obtained simultaneously. The
ATR crystal was set at a contact pressure of 5%.
2.6 Electrochemical Measurements
Cyclic voltammetry was performed using CHI 660 D potentiostat (CH Instruments, New
Jersey), with the working bare electrode (BE) or GCME, an Ag/AgCl reference electrode, and a Pt
counter electrode. Unless otherwise stated, the switching potentials were -0.6 V and 0.6 V, at 50 mV/s
scan rate. The potentiostat was set at a sensitivity scale (A/V) of 1 x 10 -6 and a quiet time of 2
seconds. The electrochemical cell was a 10-mL glass cell fitted with a 3-hole Teflon cap. All solutions
were nitrogen purged (deoxygenated) for at least 10 minutes to eliminate oxygen interference and
prevent the formation of oxide layer on the electrode surface. After each measurement (or set of
measurements), the working electrode was polished using 0.05 micron alumina powder with polishing
pad (CH Instruments) and sonicated using Cole-Parmer Ultrasonic Bath. In the case of BE, electrode
was polished before and after electrochemical scans.
3. RESULTS AND DISCUSSION
3.1 Characterization of GCME by FTIR Microscopy
Glycerol was added to the clay suspension with the aim to prevent the formation of cracks in
the GCME during drying. Glycerol is inert, nonvolatile, and does not alter the clay film features.
Different amounts of glycerol, %(v/v) were added and examined. It was observed that 5%(v/v)
glycerol produced the highest signal (not shown). Hence clay suspension used to prepare GCME
contained 5%(v/v) glycerol.
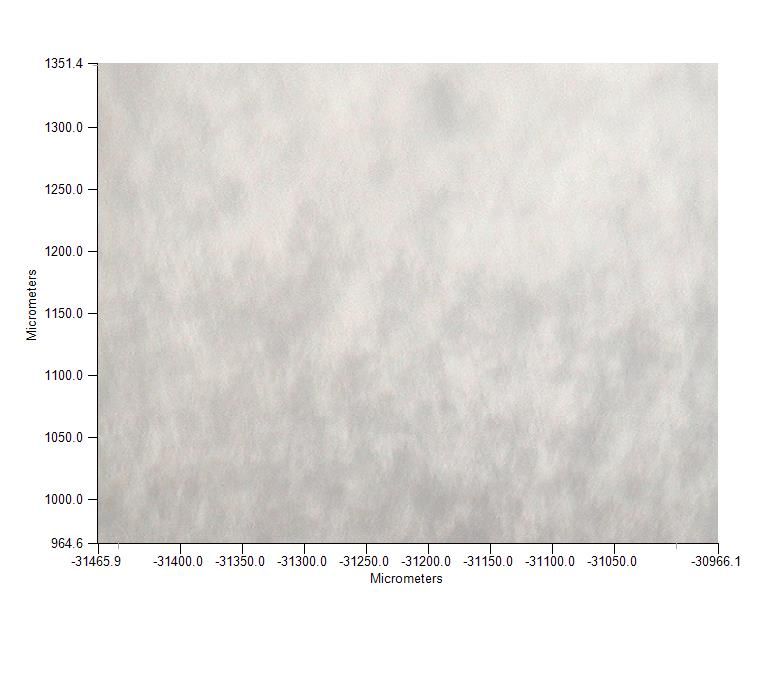
The FTIR microscope system was used to examine the morphological features of the GCME as
shown in Figure 1. High quality films were obtained as confirmed by FTIR microscopy. Figure 1A
shows the IR micro-ATR spectra of glycerol, clay and glycerol-clay mixture. It can be seen that both
glycerol and clay have similar characteristic bands at similar wavenumbers. The SWy-2 clay is aInt. J. Electrochem. Sci., Vol. 12, 2017 9605
hydrous aluminosilicate layered material that consists of structural OH groups, tetrahedral silicates (Si-
O), and octahedral aluminates (Al-O and Al-OH) [3, 4]. The broad band centered around 3300 cm-1 is
due to hydrogen bonding of the structural OH groups in the clay (also OH of glycerol). The weak
band around 2900 cm-1 is a result of Si-H bond (C-H bond of glycerol where the C is sp3 hybridized).
In addition, Si=O stretching band was observed at 1630 cm-1. The strong stretching band at 1040 cm-1
is a result of Si-O stretch from the silicates (C-O stretch from glycerol). It could also come from Al-O
stretch. It can be seen from the glycerol-clay spectrum that the addition of glycerol did not cause
significant changes in the bands. Only slight shifts were observed due to interactions of glycerol with
the clay.
110
A glycerol-clay
100
B
90
Percent Transmittance
clay
80 1630
Micrometers
2900
70
glycerol
60
~ 3300
50
40 400 μm
1040
30
4000 3500 3000 2500 2000 1500 1000 500
Micrometers
Wavenumber (cm-1)
Figure 1. (A) FTIR microscopy spectrum for clay and glycerol-clay films in the ATR mode; (B) FTIR
microscopy image of glycerol-clay film.
3.2 EP Adsorption Studies at BE
The interfacial behavior of EP at bare glassy carbon electrode (BE) was evaluated. Figure 2A
illustrates ten cycles of repetitive cyclic voltammogram (CV) at BE, for 50.0 μM EP in 0.10 M PBS
(pH 7.4). The potential was scanned between -0.6 V and 0.6 V (vs Ag/AgCl) at a scan rate of 50
mV/s. The first cycle showed an oxidative peak “a” (ip,a) around 0.28 V and a reductive peak “b” (ip,b)
around -0.19 V. An oxidative peak “c” (ip,c) around -0.14 V appeared during the second cycle. The ip,a
decreased substantially with subsequent cycles whilst ip,b and ip,c increased gradually. This is an
indication of progressive adsorptive accumulation at the electrode surface.Int. J. Electrochem. Sci., Vol. 12, 2017 9606
2.5 2.0
a
A B
1.5
1.5 ip,a
c
Current (μA)
Current (μA)
0.5
ip,MAA
1.0
-0.5 ip,b
0.5
-1.5 b
ip,c
-2.5
0.0
-0.6 -0.4 -0.2 0 0.2 0.4 0.6
0 2 4 6 8 10 12
Potential (V vs Ag/AgCl) Scan Number
Figure 2. (A) Cyclic voltammogram of continuous repetitive scanning at 50 mV/s for 50.0 μM EP in
0.1 M PBS (pH 7.4) at BE; (B) A plot of peak currents “a” (ip,a), “b” (ip,b), and “c” (ip,c) versus
scan number.
EP was first oxidized to its open chain quinone, corresponding to ip,a, with the loss of two
electrons and two protons [28, 41-44]. The electrochemical oxidation of EP takes place at the phenol
groups of the molecule to form the homologue quinone (peak “a”). This oxidation product is very
unstable, hence the absence of a corresponding reduction peak. The quinone underwent intramolecular
cyclization (via nucleophilic attack by the nitrogen), followed by aromatization (via proton transfer) to
generate the inetermediate, leucochrome, and then adrenochrome as the final oxidation product [43].
The adrenochrome product then adsorbed to the electrode surface and passivated the electrode over
time, which is the reason why ip,a reduced with subsequent cycles. This implies that the adsorption of
adrenochrome was very strong and interfered with the electrochemical detection of EP.
Adrenochrome underwent electrochemical reduction to form leucochrome, corresponding to ip,b, which
then reoxidized back to adrenochrome, corresponding to ip,c [23, 24, 28, 41]. This explains why ip,c
was absent in the first cycle as there was no adrenochrome to convert electrochemically to
leucochrome. Therefore, ip,b and ip,c, centered at -0.17 V, were attributed to the redox couple,
adrenochrone/leucochrome.
The oxidation of EP to adrenochrome has been studied extensively [43, 44]. Garnayak and
Patel reported that the quinone intermediate has a half-life of only about 0.06 s, which implies the
conversion between quinone and adrenochrome is very fast [43]. At a scan rate of 50 mV/s, it takes
about 18 seconds to move from ip,a to peak ip,b, which is quite an ample time for the intramolecular
conversion to adrenochrome to take place. Karin et. al. proposed that the oxidation product of
catecholamines must be adsorbed onto the electrode surface in order for the second oxidation (i p,c in
this case) to be observed [26]. Their proposal is in agreement with the above observation as ip,c was
absent during the first cycle. They also reported that catecholamines adsorb to the surface with theInt. J. Electrochem. Sci., Vol. 12, 2017 9607
aromatic ring oriented parallel to the electrode surface, and with the positively charged amine end of
the molecule held away from the electrode surface. This allows the catecholamine to oxidize to
quinone, undergo any intramolecular changes, adsorb, and then reorient in such a way that the amine
becomes accessible to the electrode surface. This is also consistent with the above observations of ip,b
and ip,c being attributed to the adrenochrome/luecochrome redox couple.
Negligible shift in the peak potentials were observed with subsequent cycles at all three peaks.
On the average, the peak separation (ΔEp) between ip,b and ip,c was about 50 mV, which remained fairly
constant with subsequent cycles. This is a characteristic of 2-electron processes of an adsorbed species
[34].
Figure 2B depicts the relationships between the peak currents and scan number during the
repetitive scans (results are averages of 3 independent scans). At the seventh cycle, i p,a minimized and
leveled off afterwards, while ip,b and ip,c maximized and plateaued, indicating the occurrence of
maximum adsorptive accumulation (MAA). Also at the seventh cycle, ip,a ≈ ip,b (denoted ip,MAA). That
is, lines “a” and “b” coincided, which indicated the establishment of equilibrium. Hence, both
equilibration and MAA occurred simultaneously, at the seventh cycle.
Equation 1 below can be used to calculate the surface coverage (Γ) at system equilibrium and
MAA, using ip,MAA from the seventh cycle [45]:
Γ = Q/nFA (1)
where Q is the quantity of charge consumed during reduction or adsorption (0.608 C), n is the
number of electrons transferred (2 electrons), F is Faraday constant (9.6485 x 10⁴ C/mol), and A is the
electrode area (0.0707 cm2). The charge in coulombs (C), was obtained by integrating the area under
the voltammetric peak. This resulted in a surface coverage of 44.6 pmol/cm2 at MAA with bulk
concentration (Cb) of 50.0 μM.
Immediately after the repetitive scans, the electrode was transferred to 0.1 M PBS solution and
similar repetitive scans were acquired. All three peaks were present, which confirmed adsorption of
EP and its oxidation products (not shown). All the peaks decreased with subsequent scans, with ip,a
completely disappearing after the seventh cycle. It is interesting to note that equilibration and MAA
occurred at the seventh cycle while it took seven cycles for ip,a to completely disappear during
desorption in PBS. On the other hand, ip,b and ip,c did not disappear completely, even after several
cycles. This suggested that adsorption of adrenochrome to the carbon electrode was very strong.
In addition, BE was scanned in 50.0 μM EP using -0.6 V and 0 V as the switching potentials.
No peaks were observed after ten repetitive scans. Within these potentials, EP could not oxidize to
quinone, hence production and adsorption of adrenochrome did not occur.
3.3 EP Adsorption Studies at GCME
The interfacial behavior of EP at GCME was similarly evaluated using the same parameters as
in section 3.2 above. Figure 3A shows ten repetitive cyclic voltammograms at GCME for 50.0 μM EP
in 0.10 M PBS (pH 7.4). The first cycle exhibited both the oxidative ip,a and ip,c, as well as the
reductive ip,b. Peak potentials for ip,a, ip,b, and ip,c, were around 0.29 V, -0.17 V, and -0.12 V,Int. J. Electrochem. Sci., Vol. 12, 2017 9608
respectively. Compared to BE, ip,a shifted more positive by 10 mV while ip,b and ip,c shifted more
positive by 20 mV each. The difference in potentials between ip,a and ip,b reduced by 10 mV, which
may be due to increased adsorption or faster electron-transfer kinetics [17]. The ΔEp between ip,b and
ip,c was about 50 mV (same as BE), characteristic of 2-electron processes of an adsorbed species [34].
Also, the repetitive scans did not cause any significant shift in peak potentials.
2.5 2.0
A a
ip,a
B
1.5
1.5
ip,MAA
c
Current (μA)
Current (μA)
0.5
ip,b
1.0
-0.5
-1.5
0.5 ip,c
b
-2.5 0.0
-0.6 -0.4 -0.2 0 0.2 0.4 0.6 0 2 4 6 8 10 12
Potential (V vs Ag/AgCl) Scan Number
Figure 3. (A) Cyclic voltammogram of continuous repetitive scanning at 50 mV/s for 50.0 μM EP in
0.1 M PBS (pH 7.4) at GCME; (B) A plot of peak currents “a” (ip,a), “b” (ip,b), and “c” (ip,c)
versus scan number.
Unlike ip,b at BE, the ip,b at GCME exhibited relatively high peak current at the first cycle and
was very close in magnitude to ip,a, as shown in Figure 3B. The ip,b at GCME was, on the average, 2.5
times higher than that at BE. This is an indication that there was enhanced conversion from EP
through adrenochrome to luecochrome. The clay film catalyzed the system and enhanced retention
and adsorption of adrenochrome.
Both ip,a and ip,b decreased with subsequent cycles while ip,c increased gradually, indicative of
progressive adsorptive accumulation at GCME. While ip,a at GCME was similar in magnitude to that
at BE, ip,b and ip,c were relatively higher. The large surface area of clay particles resulted in an increase
in electroactive surface area and adsorption sites, which increased adsorption and caused higher
currents. Also, the clay film interlayers were able to trap and accumulate EP and its oxidation
products, leading to high currents.
Further, ip,c was observed at first cycle, implying that the clay film initially catalyzed EP
oxidation before potential application, consistent with the electrocatalytic effect of the clay. Hence,
the clay-modified electrode exhibited enhanced adsorption kinetics without compromising sensitivity.
It can be seen from Figure 3B that ip,a and ip,b were very close in magnitude at first cycle,Int. J. Electrochem. Sci., Vol. 12, 2017 9609
separated out while decreasing, and coincided from the sixth cycle. Also at the sixth cycle, i p,a and ip,b
minimized and leveled off while ip,c maximized. Hence, equilibration and MAA occurred at the sixth
cycle, one cycle earlier than BE.
Using equation (1) in section 3.2 above, the surface coverage at MAA was determined to be
54.5 pmol/cm2. This was about 10 pmol/cm2 higher than that of BE, confirming enhanced adsorption
at the GCME. The results show that the clay platelets of the film arrange themselves in a controllable
way during drying of the film, which facilitated intercalation and increased adsorption.
Similar to BE, the GCME was immediately transferred from EP solution to PBS solution to
monitor desorption. Results were similar to BE as described in section 3.2 above, only that ip,a
completely disappeared after eight cycles. The clay film was able to retain more of the adsorbed
species and for longer period of time, compared to BE.
GCME was also scanned in 50.0 μM EP using -0.6 V and 0 V as the switching potentials. Both
ip,b and ip,c were present at first cycle, with reduction in ip,b and an increase in ip,c during subsequent
cycles. The oxidation process was not due to potential application but the electrocatalytic activity of
the clay film.
3.4 Effect of Bulk Concentration
3.0
ip,a
y = 0.0345x + 0.0340
R² = 0.9956
2.0 ip,b
Current (µA)
y = 0.0290x + 0.1625
R² = 0.9633
1.0
iii
ip,MAA
y = 0.0134x + 0.0664
R² = 0.9947
0.0
0 20 40 60 80
Cb (µM)
Figure 4. Calibration curves (peak current vs. bulk concentration) at 50 mV/s for EP in 0.1 M PBS
(pH 7.4) at GCME (ip,a, and ip,b, values from the first cycle).
The effect of EP bulk concentration (Cb) on voltammetric response was investigated. Figure 4
shows calibration curves for ip,a, ip,b, and ip,MAA (ip,a, and ip,b, values from the first cycle). The curves
ip,a and ip,b gave linear relationships within a concentration range of 0.2 μM and 75 μM, at the chosenInt. J. Electrochem. Sci., Vol. 12, 2017 9610
instrument sensitivity scale (A/V) of 1 x 10⁻⁶. The limit of detection (LOD) of EP was found to be 0.1
µM (S/N = 7). The respective linear regression equations for ip,a and ip,b were ip,a = 0.0345Cb + 0.0340
(R2 = 0.9956) and ip,b = 0.0290Cb + 0.1625 (R2 = 0.9633). The coefficient of determination, R2, in
each case was very strong (0.8 < R2 < 1), an indication that the peak currents are highly correlated with
the concentrations. This implies that the regression models will provide highly accurate predictive
concentration values.
Similarly, curve ip,MAA showed a linear calibration curve within a concentration range of 1.0
μM and 75.0 μM. The linear regression equation was ip,MAA = 0.0134Cb + 0.0664 (R2 = 0.9947), which
also exhibited strong coefficient of determination. Equilibrium and MAA did not establish at
concentrations outside this range. The system was over saturated with EP at concentrations above 75.0
μM. There were contributions from both diffusion and adsorption at higher concentrations, hence the
peak currents did not completely plateau with subsequent cycles. Also, amount of adrenochrome
needed to establish equilibrium could not be generated at concentrations below 1.0 μM.
The linear range and LOD of the present modified electrode was compared with those of
similar modified electrodes for EP detection, as summarized in Table 1 below. It can be seen from the
table that the GCME is more sensitive with lower LOD than many published reports.
Table 1. Comparison of LOD and linear range of EP at GCME with other EP electrochemical sensors.
Reference Type of Electrode Linear Range (μM) LOD (μM)
This study Glycerol-Clay Modified GCE 0.2 - 75 0.1
8 Caffeic Acid Modified GCE 2 - 300 0.6
9 Caffeic Acid Modified GCE 2 - 80 0.2
10 TTAB Modified Carbon Paste Electrode 0.15 - 2.5 0.12
15 Iron(III) Doped Zeolite-Modified Carbon Paste 0.9 - 216 0.44
24 L-Cysteine Monolayers Modified Gold Electrode 0.1 - 2 0.01
19 L-Glutamic Acid Graphene Modified Electrode 0.1 - 1000 0.03
20 Boron-Doped Diamond Film Electrode 0.7 - 60 0.21
28 Penicillamine Self-Assembled Gold Electrode 0.5 - 1 & 10 - 200 0.1
39 Poly(Eriochrome Black T) Modified GCE 2.5 - 50 0.3
3.5 Adsorption Isotherm
A plot of Γ versus Cb revealed a linear relationship within a range of 1.0 μM and 75.0 μM
(Figure 5), the same concentration range within which system equilibrium and MAA were established.
The values of Q corresponding to ip,MAA were used to calculate the Γ values. The linear regression
equation was Γ = 0.0010Cb + 4.8666 (R2 = 0.9947). The coefficient of determination was very strong,
hence the surface coverage of adsorbed adrenochrome is highly correlated with EP bulk concentration.
The linearity implies that the adsorption process obeys the Langmuir isotherm. The thermodynamicInt. J. Electrochem. Sci., Vol. 12, 2017 9611
strength of adsorption can be estimated using the slope of the linear plot of the Langmuir isotherm,
according to equation (2) below [33, 45]:
Γ = ΓmBCb (2)
where Γm is the surface coverage at saturation (the maximum attainable Γ) and B is the
adsorption coefficient. The Langmuir model assumes that BCbInt. J. Electrochem. Sci., Vol. 12, 2017 9612
A plot of ip,a (μA) versus ν1/2 (V/s)1/2 gave a linear relationship (not shown), indicative of
diffusion-controlled process. The linear regression equation was ip,a = 6.0822ν1/2 + 0.3139 (R2 =
0.9820). Also, a graph of log ip,a vs log v was linear with a slope of 0.37 (not shown). The theoretical
value (upper limit) for purely diffusion-controlled processes is 0.53, hence the linearity and slope
confirmed a diffusion-controlled process [47]. Also, ip,a shifted slightly positive with increasing ν,
indicating a quasi-reversible system [8].
On the other hand, ip,b and ip,MAA increased linearly with respect to ν, indicative of surface-
controlled adsorptive processes. The respective linear regression equations were ip,b = 3.2491ν +
0.8875 (R2 = 0.9753) and ip,MAA = 6.4913ν + 0.6625 (R2 = 0.9829).
These results reveal that the process is simultaneously dominated by both diffusion and
adsorption [47]. The system approaches ideal behavior when ν is relatively slow, when there is no
intermolecular interactions of the adsorbed layer, or when fast electron transfer occurs [45].
3.7 Effect of pH
The effect of pH on EP oxidation and adsorption was investigated using the following pH
values: 2.5, 4, 6, 7.4, 9, and 11. Figures 6A and 6B show the effect of pH on peak currents and
potentials. It can be seen from Figure 6A that peak potentials shifted more negative with increasing
pH, which showed that protons have participated in the electrode reaction processes. [8, 15]. Plots of
peak potentials versus pH for ip,a and ip,b gave linear relationships with negative slopes of 67 mV/pH
and 47 mV/pH, respectively (not shown).
2.5
6 2.5
7.4
A 4
1.5
9
Current (μA)
0.5 11
-0.5 4
2.5 quinone peak
11
-1.5 9
7.4 6
-2.5
-0.6 -0.4 -0.2 0 0.2 0.4 0.6
Potential (V vs Ag/AgCl)
Figure 6A. Cyclic voltammograms at 50 mV/s for 50.0 μM EP at GCME at different pH values (2.5,
4, 6, 7.4, 9, and 11).Int. J. Electrochem. Sci., Vol. 12, 2017 9613
2.5
B
2.0
ip,a
Current (μA)
1.5
1.0
ip,b
0.5
ip,c
0.0
2 4 6 8 10 12
pH
Figure 6B. A plot of peak currents “a” (ip,a), “b” (ip,b), and “c” (ip,c) versus pH.
Linearity shows that the behavior obeys the Nernst equation. The slopes are close to 59
mV/pH (for an ideal Nernstian behavior), which means that the uptake of electrons is accompanied by
an equal number of protons [8, 15]. It is known from section 3.2 above that EP oxidation processes
involve 2 protons and 2 electrons.
Both ip,a and ip,b increased with increasing pH, reaching a maximum at pH 7.4, and decreased
beyond 7.4, as shown in Figure 6B. Therefore, pH 7.4 (the physiological pH) produced the highest
signal for electrochemical analysis of EP. In addition, with the exception of pH 7.4, equilibration and
MAA was not established at any other pH. EP readily oxidizes upon potential application, and
converts to adrenochrome at pH around 7 [44]. It can also be seen that ip,a ≈ ip,b at pH 7.4, whereas ip,a
≈ ip,c at pH 9.
At pH of 4, little return peak for ip,a, believed to be due to quinone, was observed around 0.37 V
(indicated by an arrow in Figure 6A). The characteristics of the CV in acidic medium indicated lack of
adsorption of the oxidation products. The pKa of EP is ~ 8.6 [15, 41], which means that EP exists in
the cationic form in acidic medium (the nitrogen is protonated), implying the oxidized quinone is also
cationic [26, 43]. Nucleophilic attack by the nitrogen is prevented due to its protonation, hence
cyclization does not proceed. In addition, at very low pH values, there is believed to be competition
between the protonated EP and solution protons for adsorption sites within the film and at the electrode
surface. Conversely, the nitrogen (amine group) is not protonated at higher pH values and the free
base readily undergoes cyclization.
In strongly alkaline medium (pH ≥ 9), ip,a decreased drastically due to the deprotonation of EP,
reducing accumulation and adsorption into the clay film. EP readily oxidized in alkaline medium
before applying potential scan, which resulted in higher ip,b and ip,c, relative to ip,a. Further,
adrenochrome is unstable in alkaline medium and readily reacts with hydroxide ions [44], increasing
the rate of oxidation and causing more EP to oxidize to adrenochrome in the bulk solution. The rate ofInt. J. Electrochem. Sci., Vol. 12, 2017 9614
EP oxidation at pH 8 has been reported to be about four times greater than that in very acidic medium
[44].
The positively charged EP at pH < 8.6 (the pKa of EP) enhanced intercalation and accumulation
within the clay interlayers, due to the net negative charge on the SWy-2 clay layers and its cation-
exchange properties [48]. The clay layer edges are negatively charged at pH > 7 whereas the layer
surfaces are almost always negatively charged. Since EP is positively charged at pH 7.4, it was readily
attracted into the interlayers of the clay film. This enhanced adsorption and detection of EP and its
oxidation products. As previously stated, the SWy-2 clay contains about 2.3 mass percent lattice Fe
(0.41 mol Fe/ g clay) [37, 38], which also resulted in strong interactions between EP and structural
Fe3+ and improved adsorption and accumulation.
3.8 Selectivity Studies
The use of modified electrodes for selective measurements of neurotransmitters has been an
area of focus in electroanalytical research. The effect of 5-HT, AA, and UA on the electrochemical
detection of EP was investigated. These substances are difficult to differentiate electrochemically
from EP, since their oxidation peaks occur at similar potentials.
4.5
iv
iii ii
3.0
v
1.5
Current (μA)
i
0.0
-1.5
b
-3.0
-0.6 -0.4 -0.2 0 0.2 0.4 0.6
Potential (V vs Ag/AgCl)
Figure 7. Cyclic voltammograms at 50 mV/s for the following mixtures in 0.1 M PBS (pH 7.4) at
GCME: (i) 50.0 μM EP, (ii) 50.0 μM EP + 50.0 μM 5-HT, (iii) 50.0 μM EP + 250.0 μM AA,
(iv) 50.0 μM EP + 50.0 μM 5-HT + 250.0 μM AA, and (v) 50.0 μM EP + 250.0 μM UA.
Figure 7 shows the CVs of the following species at GCME: (i) 50.0 μM EP, (ii) 50.0 μM EP +
50.0 μM 5-HT, (iii) 50.0 μM EP + 250.0 μM AA, (iv) 50.0 μM EP + 50.0 μM 5-HT + 250.0 μM AA,
and (v) 50.0 μM EP + 250.0 μM UA. Excess amounts AA and UA were used since they usually exist
in relatively large amounts in biological samples. It can be seen that the oxidation potentials of all theInt. J. Electrochem. Sci., Vol. 12, 2017 9615
species were very close and interfered with ip,a of EP. However, ip,b remained unaltered irrespective of
the species mixed with EP, since none of them exhibits such a reduction peak. In view of this, the
easiest way to discriminate between EP and the other interfering species is to monitor the
adrenochrome reduction peak, ip,b. The measured ip,b of all the five CVs shown in Figure 7 were
within 1.731 ± 0.188 μA (mean ± standard deviation from 3 measurements of pure EP). In fact, they
were all within an error of 5%, which is a highly acceptable tolerance limit for the determination of EP
concentration in the presence of interfering species. The increase of ip,b by a factor of about 2.5 at
GCME compared to BE enhances sensitivity, which offers a reliable way of selectively quantifying EP
in the presence of interfering species. Recall from section 3.4 that the calibration curve for ip,b has
strong coefficient of determination, which will provide reliable and highly accurate predictive
concentration values of EP. One other noticeable advantage is the marked peak separation between EP
and UA (“v” in Figure 7).
3.9. EP Determination in Urine Samples
9.0
iv
6.0 iii
Current (μA)
3.0
i
0.0 ii
b
-3.0
-0.6 -0.4 -0.2 0 0.2 0.4 0.6
Potential (V vs Ag/AgCl)
Figure 8. Cyclic voltammograms at 50 mV/s for the following urine samples (10-fold dilution with 0.1
M PBS, pH 7.4) at GCME: (i) urine, (ii) 50.0 μM EP in PBS, (iii) urine spiked with 50.0 μM
EP, and (iv) urine spiked with 50.0 μM EP + 50.0 μM 5-HT + 100.0 μM AA + 100.0 μM UA.
The performance of the GCME was investigated by determining the amount of EP in urine
samples as a real complex matrix, obtained from a healthy individual. Pure urine samples saturated the
system and exhibited current overload at ip,a so samples were diluted 10-fold with 0.1 M PBS buffer.
Figure 8 shows the CVs from urine, 50.0 μM EP in PBS, urine spiked with standard 50.0 μM
EP, and urine spiked with a mixture of 50.0 μM EP + 50.0 μM 5-HT + 100.0 μM AA + 100.0 μM UA.
Similar to the interfering species discussed in section 3.8 above, urine exhibited oxidation peak around
ip,a, which interferes with EP determination using the oxidation potential. However, urine did notInt. J. Electrochem. Sci., Vol. 12, 2017 9616
exhibit any peak at ip,b. Also, ip,b remained unaltered irrespective of the EP mixture spiked into the
urine samples.
Table 2 summarizes the recovered EP amount compared with the spiked EP amount in the
urine samples (average of 5 measurements). The data demonstrates good reproducibility and recovery,
showing that the method can be used for the detection of trace amounts of EP in real biological
samples. It can be seen that the GCME selectively and efficiently detected EP irrespective of the
matrix and the interfering species present. Results were within an error of 5%, which is a highly
acceptable tolerance limit for the determination of EP in the presence of interfering species.
Table 2. Determination of EP in urine (mean ± standard deviation from 5 measurements)
Sample Determined (μM) %RSD % Recovery
Urine - - -
Urine spiked with 50.0 μM EP 51.77 ± 1.81 3.50 103.54
Urine spiked with 50.0 μM EP, 50.0 μM 5-HT, 51.75 ± 0.46 0.88 103.50
100.0 μM AA, 100.0 μM UA
4. CONCLUSION
In this work, a simple glycerol-clay modified glassy carbon electrode (GCME) for studying the
interfacial behavior and adsorption properties of EP has been introduced. The oxidation of EP,
cyclization to adrenochrome, reduction of adrenochrome to leucochrome, system equilibration, and
adsorptive accumulation, were monitored using cyclic voltammetry through continuous repetitive
scanning. System conditions, such as glycerol-clay composition, concentration range, scan rate range,
and pH were optimized. The clay film efficiently catalyzed EP oxidation and facilitated adrenochrome
adsorption, without compromising sensitivity. The electrostatic attraction between the clay and EP
enhanced adsorption and confinement within the film. System equilibrium and maximum adsorptive
accumulation were established only at the physiological pH of 7.4. The highest sensitivity was also
observed at pH 7.4. The electrocatalytic mechanism of EP was different under various pH conditions.
The detection limit of EP was 0.10 μM (S/N = 7), which is lower than most published reports that use
conventional electrodes. The adsorption coefficient was 41.3 L/g. The GCME provides a unique,
easy, and reliable approach for selective detection of EP in the presence of serotonin, ascorbic acid,
and uric acid, by monitoring the enhanced reduction peak of adrenochrome. It was demonstrated that
EP has different adsorption properties from these interfering species, which resulted in preferential
adsorption at the GCME. The GCME also demonstrated high selectivity and efficient recovery for EP
in real urine samples. This work offers different conditions under which adsorption can be enhanced,
prevented, or minimized, depending on the intended application. The system offers high sensitivity
and reproducibility, with long-term stability.Int. J. Electrochem. Sci., Vol. 12, 2017 9617
ACKNOWLEDGMENTS
The author is grateful to the Undergraduate Research and Creative Activities (URCA) program and the
College of Arts & Sciences Minigrant program at Clayton State University for providing research
funds.
References
1. P. K. Ghosh, A. J. Bard, J. Phys. Chem., 88 (1984) 5519.
2. P. Subramanian, A. Fitch, Environ. Sci. Tech., 26 (1992) 1775.
3. A. Fitch, J. Du, J. Electroanal. Chem. Interf. Electrochem., 319 (1991) 409.
4. S. Macha, A. Fitch, Mikrochim. Acta, 128 (1998) 1.
5. R. A. Schoonheydt, P. De Pauw, D. Vliers, F. C. De Schrijver, J. Phys. Chem., 88 (1984) 5113.
6. Y. Xi, R. J. Davis, Clays Clay Miner., 58 (2010) 475.
7. B. Hadi, K.-M. Hassan, K. Hojatollah, Anal. Chem., 80 (2008) 9848.
8. R. Wang, Q. L. Hong, B. L. Nian, Sensors, 6 (2006) 80.
9. R. Wang, Q. L. Hong, B. L. Nian, Biosens. Bioelectron., 21 (2006) 1086.
10. S. S. Shankar, B. E. K. Swamy, Int. J. Electrochem. Sci., 9 (2014) 1321.
11. Y. Guo, J. Yang, X. Wu, A. Du, J. Fluoresc., 15 (2005) 131.
12. Z. Guo, S. Dong, Electroanalysis, 17 (2005) 607.
13. M. A. Fotopoulou, P. C. Ioannou, Anal. Chim. Acta, 462 (2002) 179.
14. S. Wei, G. Song, J.-M. Lin, J. Chromatogr. A., 1098 (2005) 166.
15. A. Babaei, S. Mirzakhani, B. Khalilzadeh, J. Braz. Chem. Soc., 20 (2009) 1862.
16. Q. Zhao, Z. Gan, Q. Zhuang, Electroanalysis, 14 (2002) 1609.
17. A. G. Zestos, C. B. Jacobs, E. Trikantzopoulos, A. E. Ross, B. J. Venton, Anal. Chem., 86 (2014)
8568.
18. T. Thomas, R. J. Mascarenhas, O. J. D' Souza, S. Detriche, Z. Mekhalif, P. Martis, Talanta, 125
(2014) 352.
19. H. Kang, Y. Jin, Q. Han, Anal. Lett., 47 (2014) 1552.
20. J. Sochr, L. Svorc, M. Rievaj, D. Bustin, Diamond Relat. Mater., 43 (2014) 5.
21. N. Xiao, B. J. Venton, Anal. Chem., 84 (2012) 7816.
22. R. N. Goyal, S. Bushnoi, Talanta, 84 (2011) 78.
23. H.-M. Zhang, X.-L. Zhou, R.-T. Hui, N.-Q. Li, D.-P. Liu, Talanta, 56 (2002) 1081.
24. S.-F. Wang, D. Du, Q.-C. Zou, Talanta, 57 (2002) 687.
25. P. Hernandez, I. Sanchez, F. Paton, L. Hernandez, Talanta, 46 (1998) 985.
26. K. Pihel, T. J. Schroeder, R. M. Wightman, Anal. Chem., 66 (1994) 4532.
27. S. S. M. Hassan, G. A. Rechnitz, Anal. Chem., 58 (1986) 1052.
28. L. Wang, J. Bai, P. Huang, H. Wang, L. Zhang, Y. Zhao, Int. J. Electrochem. Sci., 1 (2006) 238.
29. J. Gong, X. Lin, Electrochim. Acta, 49 (2004) 4351.
30. E. Dempsey, A. Kennedy, N. Fay, T. McCormac, Electroanalysis, 15 (2003) 1835.
31. M. L. A. V. Heien, P. E. M. Phillips, G. D. Stuber, A. T. Seipel, R. M. Wightman, Analyst, 128
(2002) 1413.
32. P. Takmakov, M. K. Zachek, R. B. Keithley, P. L. Walsh, C. Donley, G. S. McCarty, R. M.
Wightman, Anal. Chem., 82 (2010) 2020.
33. B. D. Bath, H. B. Martin, R. M. Wightman, M. R. Anderson, Langmuir, 17 (2001) 7032.
34. B. V. Sarada, T. N. Rao, D. A. Tryk, A. Fujishima, Anal. Chem., 72 (2000) 1632.
35. Y. Yang, W. Yan, C. Jing, Langmuir, 28 (2012) 14588.
36. S. L. Jewett, S. Eggling, L. Geller, J. Inorg. Biochem., 66 (1997) 165.
37. C. A. Gorski, M. Aeschbacher, D. Soltermann, A. Voegelin, B. Baeyens, M. M. Fernandes, T. B.
Hofstetter, M. Sander, Environ. Sci. Technol., 46 (2012) 9360.Int. J. Electrochem. Sci., Vol. 12, 2017 9618
38. C. A. Gorski, L. Klupfel, A. Voegelin, M. Sander, T. B. Hofstetter, Environ. Sci. Technol., 46
(2012) 9369.
39. H. Yao, Y. Sun, X. Lin, Y. Tang, A. Liu, G. Li, W. Li, S. Zhang, Anal. Sci., 23 (2007) 677.
40. L. Zou, Y. Li, S. Cao, B. Ye, Talanta, 117 (2013) 333.
41. X. Li, M. Chen, X. Ma, X. Lin, Int. J. Chem., 2 (2010) 206.
42. H.-P. Wu, T.-L. Cheng, W.-L. Tseng, Langmuir, 23 (2007) 7880.
43. S. Garnayak, S. Patel, Ind. Eng. Chem. Res., 53 (2014) 12249.
44. Z. Tao, G. Wang, J. Goodisman, T. Asefa, Langmuir, 25 (2009) 10183.
45. J. Wang, Analytical Electrochemistry, John Wiley and Sons Inc., (2006) New Jersey, U. S. A.
46. K. G. Bhattacharyya, S. S. Gupta, Ind. Eng. Chem. Res., 45 (2006) 7232.
47. O. Gilbert, B. E. Kumara Swamy, U. Chandra, B. S. Sherigara, Int. J. Electrochem. Sci., 4 (2009)
582.
48. A. Fitch, A. Agyeman, A. Wagdy, Z. Terranova, Langmiur, 27 (2011) 452.
© 2017 The Authors. Published by ESG (www.electrochemsci.org). This article is an open access
article distributed under the terms and conditions of the Creative Commons Attribution license
(http://creativecommons.org/licenses/by/4.0/).You can also read