Self-supervised Representation Learning for Reliable Robotic Monitoring of Fruit Anomalies
←
→
Page content transcription
If your browser does not render page correctly, please read the page content below
Self-supervised Representation Learning for
                                                                Reliable Robotic Monitoring of Fruit Anomalies
                                                           Taeyeong Choi1 , Owen Would2 , Adrian Salazar-Gomez1 , and Grzegorz Cielniak1

                                            Abstract— Data augmentation can be a simple yet powerful
                                         tool for autonomous robots to fully utilise available data for
                                         self-supervised identification of atypical scenes or objects. State-
                                         of-the-art augmentation methods arbitrarily embed structural
                                         peculiarity in focal objects on typical images so that classifying
arXiv:2109.10135v1 [cs.RO] 21 Sep 2021

                                         these artefacts can provide guidance for learning represen-
                                         tations for the detection of anomalous visual inputs. In this
                                         paper, however, we argue that learning such structure-sensitive
                                         representations can be a suboptimal approach to some classes
                                         of anomaly (e.g., unhealthy fruits) which are better recognised
                                         by a different type of visual element such as “colour”. We thus                                     (a)
                                         propose Channel Randomisation as a novel data augmentation
                                         method for restricting neural network models to learn encoding
                                         of “colour irregularity” whilst predicting channel-randomised
                                         images to ultimately build reliable fruit-monitoring robots
                                         identifying atypical fruit qualities. Our experiments show that
                                         (1) the colour-based alternative can better learn representations
                                         for consistently accurate identification of fruit anomalies in var-
                                         ious fruit species, and (2) validation accuracy can be monitored
                                         for early stopping of training due to positive correlation between
                                         the colour-learning task and fruit anomaly detection. Moreover,
                                         the proposed approach is evaluated on a new anomaly dataset                             (b)                           (c)
                                         Riseholme-2021, consisting of 3.5K strawberry images collected
                                         from a mobile robot, which we share with the community to              Fig. 1: (a) Robotic monitoring of anomalous strawberries
                                         encourage active agri-robotics research.                               using a mobile sensing platform Thorvald; Sample categories
                                                                                                                from Riseholme-2021 dataset including (b) three “normal”
                                                              I. INTRODUCTION
                                                                                                                subcategories and (c) “anomalous”.
                                            Agricultural mobile robots are expected to precisely assess
                                         the qualities of crops from their sensory information to
                                         autonomously perform the targeted treatment of individual              scenarios in which anomaly is mostly defined by structural
                                         plants or harvest the mature and healthy crops. To realise             differences – e.g., bent tips in screws, holes on hazelnut
                                         this autonomy, deep learning models could be adopted to                bodies, or missing wires in cable clusters in MVTec AD
                                         classify visual input from robotic sensors by optimising               Dataset [7] – or image samples out of a particular training
                                         their parameters based on a large number of examples                   class in large datasets such as ImageNet [8] or CIFAR-10 [9].
                                         available in advance. In practice, however, collecting data
                                         of “atypical” qualities, e.g., fruits with disease or damage,     We argue that such representation learning techniques may
                                         can be challenging mainly because of their rare occurrences,   only provide suboptimal performance for OC in agricultural
                                         and therefore, One-class Classification (OC) paradigm [1],     domains since anomalies in fruits, for example, tend to
                                         [2] has been widely used in computer vision communities,       appear with only little distinction in shape, but peculiar
                                         in which classifiers are trained to maximise the utility of thepigmentations (e.g., Fig. 1c) instead could be more useful
                                         available data from “normal” class to later distinguish unseen visual cues for differentiation. As an alternative, in this
                                         instances of “anomalous” class as well.                        paper, we thus propose Channel Randomisation (CH-Rand),
                                            Self-supervised Learning (SL) has been introduced as a      which augments each image of normal fruit by randomly
                                         powerful method to effectively solve OC problems by aug-       permutating RGB channels with a possibility of repetition so
                                         menting training data to inject some level of unusual patterns as to produce unnatural “colour” compositions in the aug-
                                         because classifying the artefacts can be an instructive proxy  mented image. Whilst classifying these artefacts, the neural
                                         task to learn potentially informative feature representations  networks automatically learn discriminative representations
                                         for detecting anomalies in tests [3], [4], [5], [6]. Nonetheless,
                                                                                                        of irregular colour patterns, so that distance-based heuristics
                                         most successful SL tasks have been designed only for the       can later be employed on that learnt space to estimate the
                                                                                                        anomaly score of normal input using the distance to the
                                           All authors are with the Lincoln Agri-Robotics (LAR) Centre,
                                         Lincoln,  UK.   1 {tchoi, asalazargomez, gcielniak}            existing data points.
                                         @lincoln.ac.uk, 2 25393497@students.lincoln.ac.uk                 To validate the performance of our system in a realistic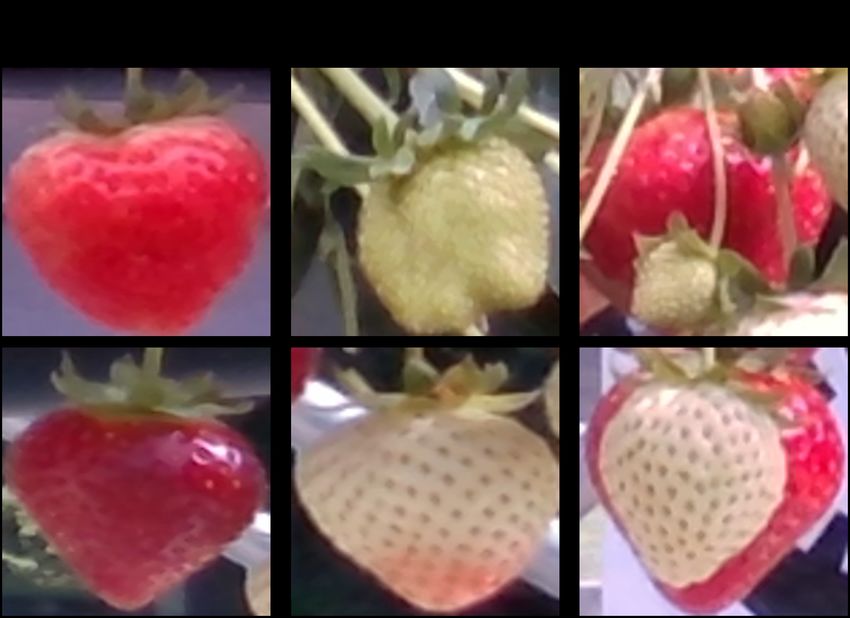
scenario, we also introduce Riseholme-2021, a new dataset
of strawberry images, for which we operated a mobile
robot (Fig. 1a) to collect 3, 520 images of healthy and
unhealthy strawberries at three unique developmental stages
with possible occlusions (cf. Fig. 1b-1c). Our experiments
                                                                        (a)         (b)         (c)         (d)          (e)
show that CH-Rand is the most reliable method for repre-
sentation learning amongst all other baselines including self-    Fig. 2: Various data augmentations on an image of ripe
supervised structure-learning methods (e.g., CutPaste [3]) in     strawberry: (a) CutPaste [3] and “BRR” permutation applied
anomaly detection on our strawberry dataset but also on           by CH-Rand to (b) a local patch, (c) 50% thresholded pixels,
several other fruits in the publicly available Fresh & Stale      (d) a segment of Sobel filter [28], and (e) all pixels.
dataset. We further support our design of SL by demon-
strating high degrees of correlation between the success
in colour prediction task and the performance in anomaly          to input images [23], (2) relative locations among regional
identification. Hence, CH-Rand does not require manually          patches [5], or (3) images with blank local masks embed-
engineered criteria for early stopping, and validation accu-      ded [4] has shown great successes for OC. More recently,
racy can simply be monitored during the proxy task to ensure      Li et al. [3] introduced CutPaste (CP), in which unlike [4],
high-performance anomaly detector.                                local patches are extracted directly from the original images
                                                                  (cf., Fig. 2a) to keep the proxy task more challenging.
                  II. RELATED WORK
                                                                     In fact, all these augmentations were motivated to model
A. Anomaly Detection in Agricultural Domains                      typical structures of normal objects (e.g., defect-free screws)
   Perception models have played a crucial role also in           to detect odd shapes in anomalous examples (e.g., screws
agriculture to build up essential capabilities to eventually      with bent tips) afterwards. We, however, argue that such
deploy fully autonomous robots in real farms. For instance,       structural difference may be less significant in differentiation
weeds are targeted anomalies to detect in [10], [11], [12],       between healthy and unhealthy fruits, and we propose to
and occlusions or dense fruit clusters are of interest in [13],   learn colour regularity instead as an alternative.
[14]. More relevantly to our work, plant diseases are also
                                                                  C. Channel Randomisation for SL
important anomalies to detect as in [15], [16], [17], in which
networks were trained with annotated images to learn leaves          Although colourisation can be used to learn useful rep-
with diseases. These methods were built upon supervised           resentations by colouring grayscale images [24], [25], a
learning aided by manually annotated data, but our approach       more relevant technique to CH-Rand is Channel Permutation
is designed to meet the practical assumption in OC that           (CH-Perm) [26], also called Channel Swap [27], in which
anomalous data may be unavailable during training. Hossain        six possible random permutations are considered to shuffle
et al. [18] also utilised colour-based features to recognise      image channels. Channel Splitting (CH-Split) [27] is also
anomalous leaves, but they only depended on human engi-           related, in which a randomly chosen representative channel
neered features, while ours trains deep neural networks.          is applied to all others. Lee et al. [27] applied this to their
                                                                  SL framework to encourage their models to “ignore” colour
B. One-class Classification Strategies                            variations but learn semantic coherence through a human
   Due to the strict assumption in OC, generative model-          action. In contrast, we adopt CH-Rand to “consider” colour
based frameworks have been widely used. For instance,             patterns in representation learning. Also, CH-Rand can gen-
Deep Convolutional Autoencoders (DCAE) measure the re-            erate a larger set of 27 channel sequences including the ones
construction error because novel data would more likely           that CH-Perm and CH-Split can generate, so in Section IV,
cause higher errors [1], [19]. With DCAE as a backbone,           we investigate the benefits from using it.
Ruff et al. [2] introduced Deep Support Vector Data De-
cription (DSVDD) to learn as dense representations near                             III. METHODOLOGY
a central vector ~c as possible so that atypical data points         As in previous approaches [3], our framework includes
would be detected by a long distance from it. Generative          two modular processes for anomaly identification on fruit
Adversarial Networks (GANs) can also provide a large              images: (1) self-supervised representation learning with data
benefit by synthesis of data to potentially model unavailable     augmentation and (2) anomaly score estimation. In III-A, we
anomalous samples [1], [20], [21], [22]. For example, IO-         first formalise our proposed CH-Rand augmentation and then
GEN [1] utilises a trained DSVDD to replace its ~c with           in III-B, describe a heuristic method to calculate anomaly
synthetic data to perform multi-dimensional classification for    scores on learnt representations.
complex datasets in place of simplistic distance calculation.
   1) Self-supervised Learning: The ultimate goal in SL           A. Channel Randomisation
is to gain useful representations in neural networks for            Our approach is motivated by the unique observations
future anomaly detection whilst identifying intentionally         of fruit anomalies compared to other types – i.e., local
manipulated data as a pretext task. For example, inferring        defects on industrial products in MVTec AD [7] or the
(1) geometric transformations such as rotation (ROT) applied      out-of-distribution samples in CIFAR-10 [9]. To be specific,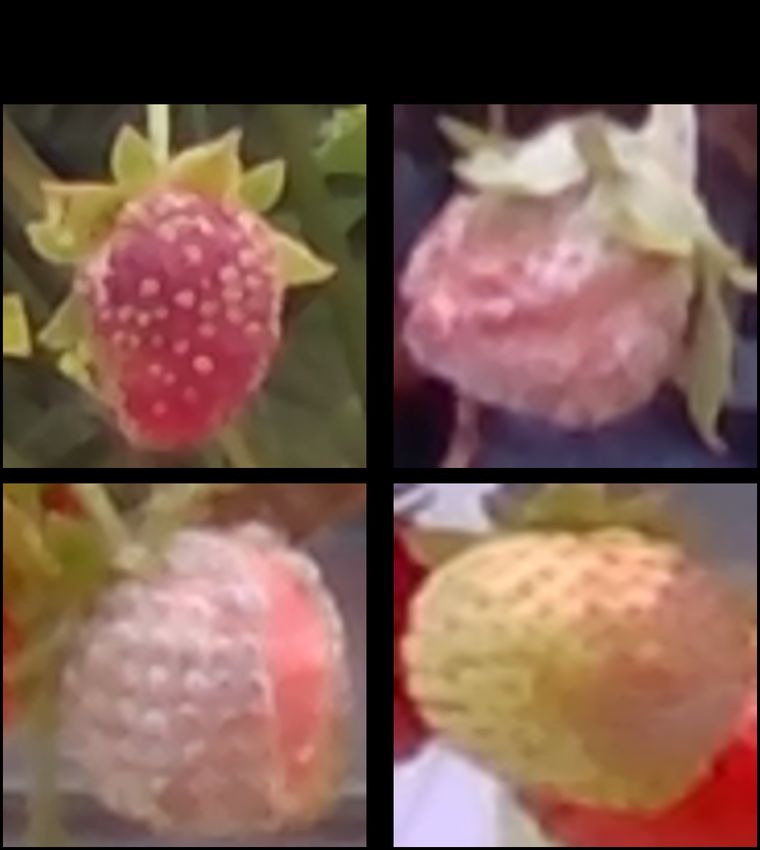
as shown in Fig. 1b, fruits generally have relatively high
phenotypic variations in local structures even in the same
species regardless of normality; nevertheless, healthy fruits
at the same developmental stage all share a similar colour
composition which can change dramatically as the fruit
becomes unhealthy, for example due to some fungal infection
as displayed in Fig. 1c. Therefore, we design a novel
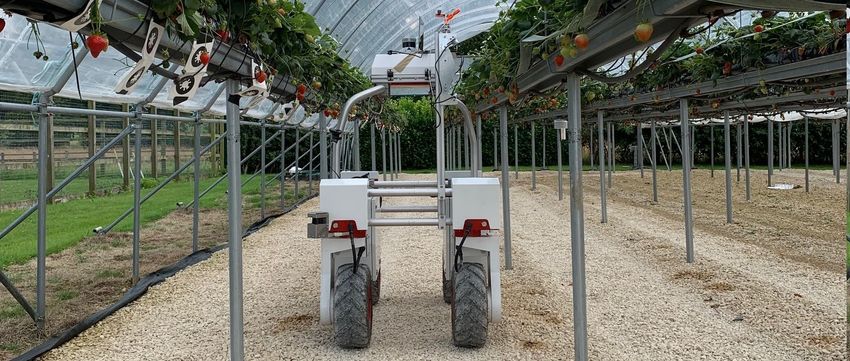
augmentation method to restrict the neural network to learn (a) (b) (c)
representations for encoding colour irregularity to ultimately
build a more reliable anomaly detector on agricultural robots. Fig. 3: t-SNE visualisations of learnt representations in CH-
CH-Rand can be simply performed by computing a ran- Rand on Riseholme-2021: (a) Ripe, (b) Unripe, and
dom permutation of colour channels with a possibility of (c) Ripe&Unripe.
repetition to apply to the entire image input. More formally,
we generate an augmented image A ∈ RW ×H×C by execut-
ing CH-Rand on the original image I ∈ RW ×H×C of normal Our framework design is generic to easily replace this
class available during training, where W and H are the width scoring module with other unsupervised techniques, such as
and the height, respectively, and C is the number of channels, Gaussian density estimators [30] or One-class SVM [31].
which is typically set to 3 for the RGB image format. To Yet, we use the k-neighbour heuristic since it has performed
augment a new input I, we first randomly build an arbitrary best in our tests.
permutation function π : χ → χ0 , where χ = {1, 2, ..., C},
IV. EXPERIMENTS
and χ0 ∈ P(χ) \ ∅ as P returns the powerset of input. Note
that the output sequence by π may have some repetition by We here offer the experimental results to demonstrate
design because |χ0 | ≤ |χ|. Moreover, we keep drawing a new the performance of our proposed framework in vision-based
π until ∃c ∈ χ, c 6= π(c) to avoid the case of A = I. As a monitoring of fruit anomalies. We first explain fruit anomaly
result, 26 possible channel sequences exist for augmentation detection datasets and technical details used through ex-
in 3-channel format, whereas Ch-Split and Ch-Perm only periments in Section IV-A and Section IV-B, respectively.
have three and six possibilities, respectively. Section IV-C then shows quantitative results by comparison
Each element acw,h in A can then be determined as follows: with other baselines, and based on the results, we examine
π(c)
in Section IV-D the relevance of the pretext task that CH-
acw,h = iw,h , (1) Rand generates to facilitate SL. Lastly, Section IV-E includes
for which π is fixed for all w, h, and c. An example with ablation studies to discuss variants of CH-Rand.
BBR colour channel permutation is presented in Fig. 2e.
A. Fruit Anomaly Detection Datasets
Based upon this augmentation method, a classifier can
be set to learn the binary classification to predict whether 1) Riseholme-2021: For realistic evaluations, we first in-
input images are the products of the augmentations. Inspired troduce Riseholme-2021, a new dataset of strawberry im-
by [3], [23], we design our loss function below to train a deep ages, in which 3, 520 images are available with manually
neural network-based classifier fΘ on a training dataset D: annotated labels, such as Ripe, Unripe, Occluded,
h i and Anomalous. This dataset was collected by deploying a
L = EI∈D H(fΘ (I), 0) + H(fΘ (CHR(I)), 1) , (2) commercial mobile robot Thorvald in the strawberry research
where CHR is the application of CH-Rand augmentation, farm at the Riseholme campus of the University of Lincoln
and H is the function of binary cross entropy to estimate as depicted in Fig. 1a. In particular, the robot was configured
the prediction error in classification. In implementation, we to use a side-mounted RGB camera to take images of normal
randomly sample a batch D0 ⊆ D at each iteration to feed a and anomalous strawberries at various growth stages, whilst
half with augmentation and the other without. navigating along the lanes in polytunnels. Human experts
then examined each image to manually crop the regions
B. Anomaly Detection centered around strawberries and annotate with respective
For anomaly prediction, we use the feature representa- anomaly labels. In real applications, fruit segmentation al-
tions gθ learnt within the classifier fΘ – i.e., gθ is the output gorithms could be employed to automate the extraction of
of an intermediate layer in fΘ . Whilst minimising the loss fruit-centered regions, but in this work, we allow humans to
function in Equation (2), the representations of the normal intervene in the loop to minimise potential negative impacts
training data D are likely to be clustered to maximise the caused by errors in segmentation process.
distance from anomalous data to effectively separate them. More specifically, each image from Ripe (Unripe)
Therefore, similar to [29], we calculate the anomaly score s contains a single ripe (unripe) strawberry, whereas several
for an input image I 0 by computing the average distance ones may appear overlapping one another in images of the
to the k nearestP neighbors N ⊆ D in the space of gθ : Occluded class. Furthermore, some strawberries in the
s(I 0 ) = (1/k) I∈N δ gθ (I), gθ (I 0 ) , where δ returns the Occluded class are observed to be covered by green stems.
Euclidean distance between two input vectors. Anomalous cases also display single strawberries with
Normal
                   All
                             Ripe      Unripe    Occluded
                                                             Anomalous       before CH-Rand such as horizontal/vertical flips and color
  # of Images    3, 520      462       2, 406      499          153          jitter2 , which changes the brightness, contrast, saturation, and
   Percentage   100.0%      13.1%      68.4%      14.2%        4.3%          hue. Normalisations are also run to set pixel values bounded
  Avg. W×H      63 × 66    75 × 81    59 × 61    71 × 75      60 × 60        by [−1, 1] after all augmentations have been applied.
  Std. W×H      18 × 23    18 × 22    17 × 22    16 × 21      16 × 17
                                                                                 As in previous works for OC [1], [2], [3], the Area Under
TABLE I: Statistics of Riseholme-2021. In this work, all                     the Curve (AUC) of the Receiver Operating Characteris-
subcategories except anomalous are included in normal class.                 tic (ROC) is used as the performance indicator, and the
                                                                             AUC of Precision-Recall (PR) curve is also reported as an
                                                                             additional metric considering the highly imbalanced class
anomalies, such as the presence of malformations, the lack                   distribution in Riseholme-2021 (cf., Table I). Each AUC is
of normal pigmentation, or clear signals of disease. Example                 the average of three individual runs to mitigate the random
images of each category are displayed in Fig. 1b-1c.                         effects from CH-Rand and weight initialisations in networks.
   Table I shows the basic statistics of the dataset, in                         In fact, other representation learning frameworks [3], [29]
which “normal” categories, including Ripe, Unripe, and                       suggest a certain number of training iterations to achieve
Occluded have considerably more images (95.7%) than                          their best performance, although in practice, such knowledge
the Anomalous (4.3%) – i.e., this severe class imbal-                        is unavailable in advance. Our approach is, however, to
ance provides a realistic testbed for anomaly detection.                     regularly monitor the “validation accuracy” to stop training
Riseholme-2021 is also presented with exclusive data sets –                  if the mean of the last five measurements reaches > .95, or
Train, Val, and Test – which contain 70%, 10%, and                           1.5K epochs have passed in order to deploy the model with
20% “normal” images, respectively, and all Anomalous                         the maximum validation accuracy. These criteria apply to
images are considered only during test. To further en-                       all SL-based approaches in our experiments to evaluate the
courage active research in agri-technology, we publish                       relevance of their pretext tasks to learn the final anomaly
our Riseholme-2021 dataset online at https://github.                         detection. More detail of the hyperparameter values with
com/ctyeong/Riseholme-2021.                                                  the code is available online at https://github.com/
   2) Fresh & Stale: Fresh & Stale1 dataset contains an-                     ctyeong/CH-Rand.
notated fruit images of six different species collected in
controlled environments, and each image is labelled with                     C. Comparative Results
either Fresh or Stale label. We, however, have discovered                       We compare CH-Rand with related methods mentioned
duplicate images that have been transformed with several                     in Section II – DCAE [1], DSVDD [2], IO-GEN [1],
methods – rotations or translations. We thus only keep                       ROT [23], CP [3], and CH-Perm [26]. Note that for repre-
images with unique contents, and as a result, the size of                    sentation learning under SL, ROT and CP inject structural
final dataset significantly is reduced, in which Apple is the                irregularities into images, while CH-Perm augments with
largest class with 231 normal and 327 anomalous instances.                   randomly shuffled channels. A basic colour feature generator
Moreover, we only utilise Apple, Orange, and Banana                          (HIST) is also considered, in which the number of pixels is
since other classes each have less than 50 examples after the                counted within six unique ranges in each channel, and a
removal of duplicates. We set the split of normal data with                  representation of 6 × 6 × 6 dimensional colour histogram
Train (40%), Val (10%), and Test (50%) to conduct tests                      is produced per input combining the channel-wise ranges.
along with anomalous “stale” fruits. Also, the black pixels                  Pretrained VGG16 [33] is also used to generate features to
that the pre-transformation had produced were removed by                     investigate the utility of the learnt features on ImageNet [8].
conversion to white to match the original background.                        DOC [29] is also set up, which learns representations utilis-
B. Implementation Details & Evaluation Protocols                             ing an external benchmark dataset (e.g., CIFAR-10 [9])
                                                                                Hyperparameter searches are conducted for each baseline
    Throughout experiments, we deploy a deep-network clas-
                                                                             to offer the best results on the Riseholme-2021 dataset first,
sifier for SL which consists of 5 ConvLayers followed by
                                                                             albeit initial configurations are set up based on publicly avail-
2 DenseLayers, in which the number of 3 × 3 convolutional
                                                                             able codes, e.g., DCAE’s performance dramatically improves
filters incrementally increases (64, 128, 256, 512, and 512) as
                                                                             with a smaller image size of 32 × 32. Since official source
each layer is followed by a BatchNorm layer and a 2 × 2
                                                                             codes are not available for CP, we have implemented it
MaxPool layer, and the DenseLayers have 256 and 1 output
                                                                             based on the details on their appendix in [3]. In particular,
nodes, respectively. Every layer uses LeakyReLU activations
                                                                             we adopt the deep classifiers and the k neighbors-based
except the last layer with a sigmoid function. Note that
                                                                             detector described in Section III on ROT, CP, and CH-Perm
though ResNet’s have shown successes in SL [32], we did not
                                                                             so as to focus only on the achieved representation power
discover any benefit from using it (e.g., ResNet-18 as in [3])
                                                                             in comparison to ours. The only distinction with ROT is
possibly because of the small resolution of our images.
                                                                             to use four output nodes in the classifiers to predict four
    Also, at each training iteration, all inputs are resized to
                                                                             degrees of rotation – i.e., 0◦ , 90◦ , 180◦ , and 270◦ – pre-
64×64 images and processed with traditional augmentations
                                                                             applied to input images. Similarly, HIST and VGG16 run the
  1 https://www.kaggle.com/raghavrpotdar/fresh-and-stale-images-of-fruits-
and-vegetables                                                                 2 https://pytorch.org/vision/stable/transforms.html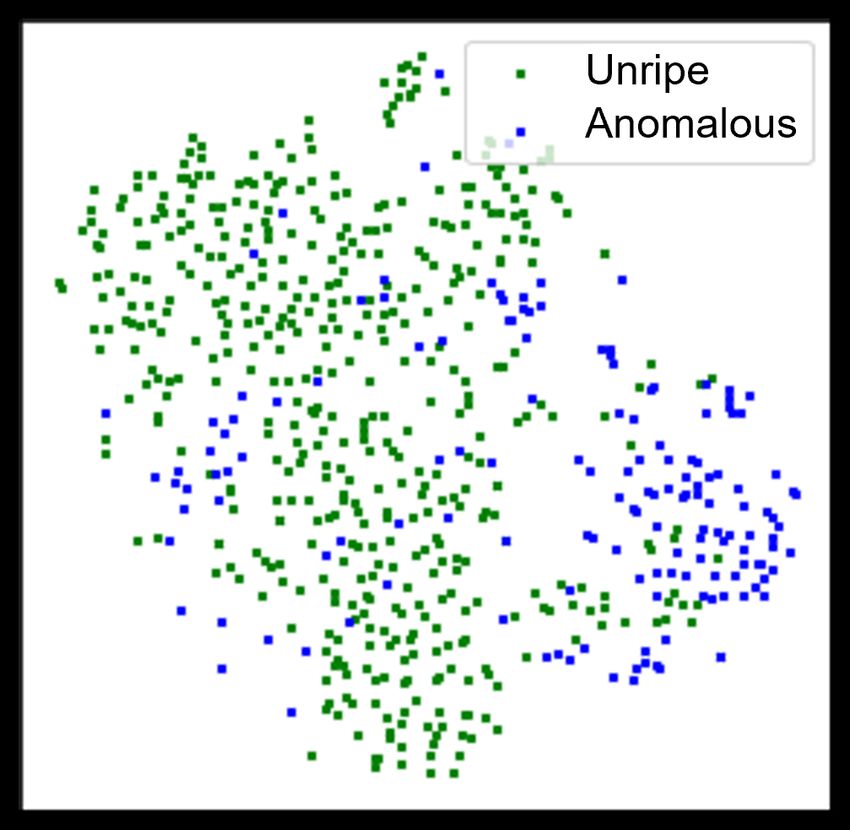
CH-P      CH-P      CH-R      CH-R
                              VGG16   DCAE    DSVDD    IOGEN     DOC     ROT       CP
  Category   Metric   HIST                                                                (k = 1)   (k = 5)   (k = 1)   (k = 5)
                               [33]    [1]      [2]      [1]     [29]    [23]      [3]
                                                                                            [26]      [26]     (Ours)    (Ours)
             ROC      .915     .810   .874      .912     .887    .820    .926     .911      .918      .922      .920      .922
   Ripe               ±.000   ±.000   ±.005    ±.006    ±.044    ±.000   ±.003    ±.004    ±.005     ±.005     ±.004     ±.001

              PR      .943     .864   .907      .935     .893    .883    .958     .941     .949      .954      .955      .957
                      ±.000   ±.000   ±.003    ±.022    ±.057    ±.000   ±.002    ±.006    ±.005     ±.004     ±.002     ±.001

             ROC      .753     .621   .783      .810     .664    .698    .819     .860     .874      .876      .873      .870
   Unripe             ±.000   ±.000   ±.003    ±.004    ±.046    ±.001   ±.007    ±.006    ±.012     ±.012     ±.004     ±.006

              PR      .556     .340   .486      .531     .342    .452    .554     .674     .709      .721      .755      .765
                      ±.000   ±.000   ±.003    ±.010    ±.039    ±.000   ±.023    ±.028    ±.026     ±.026     ±.005     ±.003

  Ripe &     ROC      .700     .623   .752      .727     .679    .642    .772     .780     .826      .829      .834      .838
                      ±.000   ±.000   ±.002    ±.005    ±.023    ±.001   ±.009    ±.013    ±.004     ±.003     ±.008     ±.007

   Unripe     PR      .385     .274   .426      .378     .334    .331    .428     .452     .572      .580      .607      .615
                      ±.000   ±.000   ±.003    ±.012    ±.018    ±.000   ±.018    ±.026    ±.007     ±.008     ±.012     ±.008

   All w/    ROC      .673     .598   .715      .670     .609    .598    .736     .736     .795      .790      .804      .796
                      ±.000   ±.000   ±.002    ±.012    ±.040    ±.001   ±.005    ±.007    ±.005     ±.005     ±.014     ±.012

 Occluded     PR      .303     .228   .340      .295     .236    .252    .335     .337     .458      .436      .496      .484
                      ±.000   ±.000   ±.003    ±.018    ±.026    ±.000   ±.016    ±.006    ±.016     ±.019     ±.022     ±.021

TABLE II: Average AUC-ROC scores on Riseholme-2021 with standard deviations from three independent runs for each
model. HIST, VGG16, ROT, and CP also employ the k nearest neighbor detector with the best k ∈ {1, 5, 10}.

same detector to discern anomalies on their representations.     for detection of fruit anomalies.
In addition, the results obtained by the best k ∈ {1, 5, 10}        Table II also implies that though CH-Perm and CH-
are presented except CH-Rand and CH-Perm. Note here that         Rand are all trained for simply identifying unnatural colour
all models including ours are then applied to Fresh & Stale      patterns, their representations are not trivial features, be-
without major modifications to assess the general capacity       cause they significantly outperform HIST. CH-Rand provides
on variable conditions in agriculture. Lastly, CH-Rand uses      slightly better results than CH-Perm in more complex normal
representations gθ at fc6 instead of conv5, and discussions      sets probably because its higher randomness in augmentation
on this design are described in Section IV-E.                    simulates more realistic colour anomalies. Also, the hyper-
   1) Riseholme-2021: We test different combinations of          parameter k is not a dominating factor in the CH family.
normal classes against anomalies as shown in Table II. Every        For better understanding, Fig. 3 visualises representations
method struggles more with Unripe than Ripe and also             in CH-Rand, in which the final features appear surprisingly
with the cases where more normal types are involved since        useful for differentiation of anomalies though anomalous
a larger variety of colours and shapes need to be modeled.       class was unavailable for explicit learning. In particular,
In particular, the notable failure in DSVDD, HIST, IO-GEN,       Fig. 3c implies ambiguous appearances of anomalous sam-
VGG16, and DOC indicates the challenge of the task with the      ples to be represented between the ripe and unripe examples,
strawberry images as all the wild conditions are concerned.      so the final detector can take advantage of it.
   In overall, however, SL-based approaches, such as ROT,           2) Fresh & Stale: Table III shows that DCAE is not as
CP, CH-Perm, and CH-Rand, demonstrate more robust per-           effective as in Riseholme-2021 with highly varying ROC’s in
formance across categories despite their relatively simple       different categories, i.e. .487 ∼ .845, since it easily overfits
designs of data augmentation and self-supervised learning.       the less complex images with controlled backgrounds.
Still, significantly large drops of ROC are observed in ROT         Interestingly, HIST works significantly better here than in
(.926 → .736) and CP (.911 → .736) compared to CH-Perm           Riseholme-2021 even outperforming ROT and CP probably
or CH-Rand (.922 → .790 in the worst model), as all normal       taking advantage of homogeneous colour patterns in focal
subcategories are considered. Moreover, CH-Rand (k =             objects, and consequently, anomalous visual signals such as
1) presents a 34% higher PR at least in Ripe&Unripe, and         black spots on bananas are easily differentiated simply by
as Occluded class is also added, the margin increases up         colour frequencies. The failure of the two SL methods re-
to 48%. This trend supports our motivation (cf., Section III-    emphasises the lesser importance of local structural features
A) that representations of shapes could be little informative    in fruit anomaly identification.
                                                                    Also, CH-Perm particularly struggles with Orange and
                                                                 All, in which it loses to HIST. CH-Rand, however, presents
 Category    HIST     DCAE     ROT     CP     CH-P     CH-R      consistently high performance across all fruit species.
  Apple      .873      .487    .718   .763    .898     .892
             ±.000    ±.008   ±.030   ±.021   ±.011    ±.007
                                                                 D. Relevance of SL task
  Orange      .854    .554     .812   .816    .843     .906
             ±.000    ±.003   ±.010   ±.039   ±.010    ±.004
                                                                   Table IV reveals the correlations between the validation
  Banana      .856    .845     .973   .858    .975     .992
             ±.000    ±.017   ±.003   ±.013   ±.010    ±.001     accuracies during SL and the ROC’s finally achieved to
    All       .846    .648     .733   .827    .831     .886      examine relevance of each pretext task to the fruit anomaly
             ±.000    ±.013   ±.016   ±.020   ±.010    ±.016
                                                                 detection. CH-Rand leads to a positively correlated task
TABLE III: Average AUC-ROC scores on Fresh & Stale               in all datasets, while others have negative coefficients in
dataset. Successful approaches in Riseholme-2021 are com-        Fresh & Stale. That is, successful pre-task training with CH-
pared using their best k ∈ {1, 5, 10} for k-neighbor detector.   Rand can better ensure representations for building precise
Dataset ROT CP CH-P CH-R
are sparsely augmented with SP.75, the performance is worse
Riseholme-2021 +.199 +.290 +.811 +.739
Fresh & Stale −.554 −.529 −.244 +.275 than Th.75, which tends to pick pixels around the same part
of objects as a result of thresholding. The high performance
TABLE IV: Pearson correlation coefficients between AUC- of Sobel also supports this idea.
ROC scores and validation accuracies measured during SL Another key observation is that CH-Rand on more pixels
proxy tasks. “All” categories are considered for each dataset. produces better results. For instance, Th.∆ presents the
improvements as ∆ increases, and finally when all pixels
Patch Sobel Th.25 Th.50 Th.75 Sp.75 All are involved as designed in Section III-A, the highest ROC
ROC .674 .731 .696 .716 .742 .725 .749 is achieved. Thus, all pixels are considered hereafter.
TABLE V: Performance of CH-Rand on Riseholme-2021 2) Randomisation Variants & Input Size: We also explore
depending on the selection of pixels. various randomisation methods in different sizes of images:
• CH-Split: Channel Splitting, which copies a randomly
CH-S CH-P CH-R
64 64
chosen channel to others [27].
32 32 64 fc6
96 32 64 fc6
96 • CH-Perm: Channel Permutation, which uses a random
ROC .710 .755 .773 .769 .753 .749 .779 .781 .775 permutation of channels without repetition [26].
• CH-Rand: Channel Randomisation in Section III-A.
TABLE VI: Performance of CH-Split, CH-Perm, and CH-
Rand on Riseholme-2021 with different input sizes. Utilising In Table VI, CH-Split leads to the lowest performance
representations learnt at fc6 layer is also considered. implying that its three possible outputs – i.e., RRR, GGG,
BBB – only provide limited irregular patterns to learn
compared to other randomisations. CH-Perm and CH-Rand
fruit anomaly detector, but continued training with other all appear to work best with 64×64 images probably because
augmentations may rather degrade the performance of final the average size of the dataset is 63 × 66 (cf., Table I). With
fruit detector particularly on Fresh & Stale data. With CH- that optimal size, CH-Rand slightly outperforms CH-Perm.
Rand, we hence suggest using the validation accuracy as 3) Layer Selection: In Table VI, more improvement is
a practical metric for early stopping, while other previous also discovered in CH-Rand with representations at fc6
frameworks manually searched for optimal numbers of iter- implying that the most discriminative representations are
ations as another hyperparameter [3], [29]. learnt there to offer the best features to the last fc7 layer.
Note that we have consistently observed such a tendency
E. Ablation Study with CH-Rand, though CH-Perm did not take any benefit.
Thus, based on all these findings, the best configuration for
We here investigate the effects of various randomisation
each model has been adopted in Section III and Section IV.
methods and hyperparameters that define our augmentation
techniques. To save computation time, we train models only V. CONCLUSIONS & FUTURE WORK
on a half of training set of all normal classes in Riseholme- We have proposed a novel data augmentation method for
2021. Also, each image is resized to 32×32, and the utilised self-supervised representation learning to effectively identify
representations of gθ are always extracted at conv5 layer fruit anomalies in agri-robotic applications. Our CH-Rand
unless mentioned otherwise to focus on each parameter in method has demonstrated consistently reliable capability on
order. Moreover, k is set to 1 to only consider the nearest all tested types of fruit in various conditions compared to
neighbor from training data to calculate the anomaly score. other baselines. In particular, all experimental results have
1) Pixel Selection: Although CH-Rand is proposed to supported our hypothesis that learning irregularities in colour
apply randomised channels across all pixels in the entire is more useful than learning of atypical structural patterns for
image, we here explore the effects of applications to local building precise fruit anomaly detectors.
regions in n-pixel images. The tested methods are below, and In addition, we have suggested monitoring validation accu-
Fig. 2 displays some examples: racy for early stopping during training because our statistical
• Patch: Pixels inside a random rectangular patch [3] analysis has indicated positive correlations between the suc-
• Sobel: Pixels inside a large segmented region from cess in the pretext task of CH-Rand and the performance of
Sobel filter-based segmentation [28]. finally built anomaly detector. For realistic scenarios, we also
• Th∆: Pixels thresholded between rank r and r+dn×∆e have introduced a new image dataset, so-called Riseholme-
in grayscale image, where r ∼ U(1, n − dn × ∆e)3 . 2021, in which over 3.5K strawberry images at various
• SP∆: Randomly sampled sparse dn × ∆e pixels. growth stages are contained along with anomalous examples.
• All: All pixels as proposed in Section III-A. In future work, we could consider additional modalities
In Table V, we discover that CH-Rand works poorly when of sensory data such as texture to improve overall detection
objectness is not taken into account. To be specific, Patch, performance. We could also acquire an extended dataset to
which may position a patch lying across multiple semantic include more maturity stages including flowers and apply
objects, leads to the worst results. Similarly, when 75% pixels the method to detection of diseases affecting plant leaves.
Furthermore, more fine-grained detection could be developed
3 Discrete uniform distribution to automatically identify local anomalies.R EFERENCES convolution neural network for the classification of mango
[1] T. Choi, B. Pyenson, J. Liebig, and T. P. Pavlic, “Identification leaves infected by anthracnose disease,” IEEE Access, vol. 7,
of abnormal states in videos of ants undergoing social phase pp. 43 721–43 729, 2019.
change,” in Proceedings of the AAAI Conference on Artificial [18] E. Hossain, M. F. Hossain, and M. A. Rahaman, “A color and
Intelligence, vol. 35, no. 17, 2021, pp. 15 286–15 292. texture based approach for the detection and classification of
[2] L. Ruff, R. Vandermeulen, N. Goernitz, L. Deecke, S. A. plant leaf disease using knn classifier,” in 2019 International
Siddiqui, A. Binder, E. Müller, and M. Kloft, “Deep one- Conference on Electrical, Computer and Communication En-
class classification,” in International conference on machine gineering (ECCE). IEEE, 2019, pp. 1–6.
learning. PMLR, 2018, pp. 4393–4402. [19] H. R. Kerner, D. F. Wellington, K. L. Wagstaff, J. F. Bell,
[3] C.-L. Li, K. Sohn, J. Yoon, and T. Pfister, “CutPaste: Self- C. Kwan, and H. B. Amor, “Novelty detection for multi-
supervised learning for anomaly detection and localization,” spectral images with application to planetary exploration,” in
in Proceedings of the IEEE/CVF Conference on Computer Proceedings of the AAAI Conference on Artificial Intelligence,
Vision and Pattern Recognition, 2021, pp. 9664–9674. vol. 33, no. 01, 2019, pp. 9484–9491.
[4] T. DeVries and G. W. Taylor, “Improved regularization of [20] M. Sabokrou, M. Khalooei, M. Fathy, and E. Adeli, “Adver-
convolutional neural networks with cutout,” arXiv preprint sarially learned one-class classifier for novelty detection,” in
arXiv:1708.04552, 2017. Proceedings of the IEEE Conference on Computer Vision and
[5] J. Yi and S. Yoon, “Patch SVDD: Patch-level SVDD for Pattern Recognition, 2018, pp. 3379–3388.
anomaly detection and segmentation,” in Proceedings of the [21] T. Schlegl, P. Seeböck, S. M. Waldstein, G. Langs, and
Asian Conference on Computer Vision, 2020. U. Schmidt-Erfurth, “f-anogan: Fast unsupervised anomaly de-
[6] D. Hendrycks, M. Mazeika, S. Kadavath, and D. Song, tection with generative adversarial networks,” Medical image
“Using self-supervised learning can improve model robustness analysis, vol. 54, pp. 30–44, 2019.
and uncertainty,” Advances in Neural Information Processing [22] P. Perera, R. Nallapati, and B. Xiang, “Ocgan: One-class
Systems, vol. 32, pp. 15 663–15 674, 2019. novelty detection using gans with constrained latent repre-
[7] P. Bergmann, K. Batzner, M. Fauser, D. Sattlegger, and C. Ste- sentations,” in Proceedings of the IEEE/CVF Conference on
ger, “The MVTec anomaly detection dataset: a comprehensive Computer Vision and Pattern Recognition, 2019, pp. 2898–
real-world dataset for unsupervised anomaly detection,” In- 2906.
ternational Journal of Computer Vision, vol. 129, no. 4, pp. [23] S. Gidaris, P. Singh, and N. Komodakis, “Unsupervised rep-
1038–1059, 2021. resentation learning by predicting image rotations,” in Inter-
[8] J. Deng, W. Dong, R. Socher, L.-J. Li, K. Li, and L. Fei- national Conference on Learning Representations, 2018.
Fei, “Imagenet: A large-scale hierarchical image database,” [24] C. Vondrick, A. Shrivastava, A. Fathi, S. Guadarrama, and
in 2009 IEEE conference on computer vision and pattern K. Murphy, “Tracking emerges by colorizing videos,” in
recognition. Ieee, 2009, pp. 248–255. Proceedings of the European conference on computer vision
[9] A. Krizhevsky, G. Hinton et al., “Learning multiple layers of (ECCV), 2018, pp. 391–408.
features from tiny images,” 2009. [25] G. Larsson, M. Maire, and G. Shakhnarovich, “Colorization
[10] B. Espejo-Garcia, N. Mylonas, L. Athanasakos, E. Vali, and as a proxy task for visual understanding,” in Proceedings
S. Fountas, “Combining generative adversarial networks and of the IEEE Conference on Computer Vision and Pattern
agricultural transfer learning for weeds identification,” Biosys- Recognition, 2017, pp. 6874–6883.
tems Engineering, vol. 204, pp. 79–89, 2021. [26] H. Lee, S. J. Hwang, and J. Shin, “Self-supervised label
[11] X. Wu, S. Aravecchia, P. Lottes, C. Stachniss, and C. Pradalier, augmentation via input transformations,” in International Con-
“Robotic weed control using automated weed and crop clas- ference on Machine Learning. PMLR, 2020, pp. 5714–5724.
sification,” Journal of Field Robotics, vol. 37, no. 2, pp. 322– [27] H.-Y. Lee, J.-B. Huang, M. Singh, and M.-H. Yang, “Unsu-
340, 2020. pervised representation learning by sorting sequences,” in Pro-
[12] P. Bosilj, E. Aptoula, T. Duckett, and G. Cielniak, “Transfer ceedings of the IEEE International Conference on Computer
learning between crop types for semantic segmentation of Vision, 2017, pp. 667–676.
crops versus weeds in precision agriculture,” Journal of Field [28] scikit image, “Image Segmentation,” https://scikit-image.org/
Robotics, vol. 37, no. 1, pp. 7–19, 2020. docs/dev/user guide/tutorial segmentation.html.
[13] S. Mghames, M. Hanheide, and A. Ghalamzan, “Interactive [29] P. Perera and V. M. Patel, “Learning deep features for one-
movement primitives: Planning to push occluding pieces for class classification,” IEEE Transactions on Image Processing,
fruit picking,” in 2020 IEEE/RSJ International Conference on vol. 28, no. 11, pp. 5450–5463, 2019.
Intelligent Robots and Systems (IROS). IEEE, 2020, pp. [30] O. Rippel, P. Mertens, and D. Merhof, “Modeling the distri-
2616–2623. bution of normal data in pre-trained deep features for anomaly
[14] Y. Ge, Y. Xiong, and P. J. From, “Classification of pickable detection,” in 2020 25th International Conference on Pattern
and unpickable strawberries under farm conditions,” in 2020 Recognition (ICPR). IEEE, 2021, pp. 6726–6733.
IEEE 16th International Conference on Automation Science [31] B. Schölkopf, J. C. Platt, J. Shawe-Taylor, A. J. Smola,
and Engineering (CASE). IEEE, 2020, pp. 961–966. and R. C. Williamson, “Estimating the support of a high-
[15] K. P. Ferentinos, “Deep learning models for plant disease dimensional distribution,” Neural computation, vol. 13, no. 7,
detection and diagnosis,” Computers and Electronics in Agri- pp. 1443–1471, 2001.
culture, vol. 145, pp. 311–318, 2018. [32] A. Kolesnikov, X. Zhai, and L. Beyer, “Revisiting self-
[16] U. P. Singh, S. S. Chouhan, S. Jain, and S. Jain, “Multilayer supervised visual representation learning,” in Proceedings of
[17] J. Gao, J. C. Westergaard, E. H. R. Sundmark, M. Bagge, the IEEE/CVF conference on computer vision and pattern
E. Liljeroth, and E. Alexandersson, “Automatic late blight recognition, 2019, pp. 1920–1929.
lesion recognition and severity quantification based on field [33] K. Simonyan and A. Zisserman, “Very deep convolutional
imagery of diverse potato genotypes by deep learning,” networks for large-scale image recognition,” in International
Knowledge-Based Systems, vol. 214, p. 106723, 2021. Conference on Learning Representations, 2015.You can also read