Sensitive protein quantification in whole blood, dried blood spots, serum and plasma
←
→
Page content transcription
If your browser does not render page correctly, please read the page content below
Sensitive protein quantification in whole blood,
   dried blood spots, serum and plasma

   Application note 3 | Version 1 | Kim Stevens, Kris Ver Donck, Filip Delport
   Based on original publication: Lu et al. (2017) Analytical Chemistry 89, 3664-3671. (1)

   Abstract                                                               Introduction
   Fiber-optic surface plasmon resonance (FO-SPR) is a                    Crude biological samples often present challenges when
   powerful tool that harnesses the power of SPR in an easy-              quantifying biomolecules of interest during the research
   to-use fiber-optic sensor. In this application note, we                and development of diagnostics or therapeutics. The
   demonstrate the potential of FOx BIOSYSTEMS’ FO-SPR                    purification steps used to overcome these challenges can
   instrument to detect proteins or antibodies in crude                   themselves introduce a bias in the experimental results, not
   biological samples such as whole blood and dried blood                 to mention the extra hands-on time and cost. Therefore, a
   spots. As an example system, we demonstrate the                        more direct detection method would be highly desirable.
   quantification of a therapeutic monoclonal antibody,
   infliximab (IFX), in whole blood, dried blood spots, serum and         In this application note, we use infliximab (IFX) to
   plasma.                                                                demonstrate the direct detection of an antibody or protein
                                                                          in whole blood, dried blood spot, serum, and plasma
   A 10-minute FO-SPR bioassay has been developed that is                 samples. IFX is a therapeutic monoclonal antibody that is
   capable of detecting IFX in 10 to 100-fold diluted whole               used to treat inflammatory bowel disease. Optimal dosing
   blood, serum and plasma down to a limit of detection of                requires the analysis of levels in the patient’s blood just prior
   0.75 ng/ml. The detection limit falls well below the                   to administration, therefore a fast and sensitive
   predicted ranges of typical IFX concentrations in patient              quantification method is crucial to optimize therapeutic
   blood and serum of 0.23−4.5 μg/ml and 0.5 – 10 µg/ml,                  outcomes while minimizing costs.
   respectively. For other targets, a lower detection limit may
   be reached but, for this example, the assay design did not             There are two main challenges for measuring IFX
   require additional sensitivity.                                        concentrations in whole blood:

                                                                          1.   Red blood cells and platelets typically rupture when
   To confirm this detection range, plasma, and serum from
                                                                               handling blood samples, causing clotting and increased
   five IFX-treated IBD patients were tested with both the 10-
                                                                               nonspecific absorption to the sensor surface that
   minute FO-SPR assay and ELISA, showing excellent
                                                                               makes it more difficult to detect target molecules.
   agreement between the two methods (Pearson correlations
   and intraclass correlation coefficients (ICC) greater than             2.   IFX concentrations in whole blood are expected to be in
   0.99 in all cases). Furthermore, the bioassay developed here                the range of 0.23−4.5 μg/ml and may require a more
   demonstrated that extraction from dried blood spots was                     sensitive assay.
   99% efficient, indicating that FO-SPR was not affected by
   the blood drying process.                                              Capillary blood collected as dried blood spots (DBS) from a
                                                                          finger prick presents further difficulties over whole blood:
   Therefore, we have shown that, in just 10 minutes, a FO-
   SPR sandwich-style bioassay can provide accurate analysis              1.   Red blood cells bursting after whole blood is dried can
   of therapeutically relevant protein and antibody                            increase nonspecific interactions between the cell
   concentrations in crude samples with minimal processing,                    fragments and the sensor surface.
   thus showing great potential as an R&D tool.
                                                                          2.   Structural alterations of analytes during the drying
                                                                               process can strongly reduce the extraction efficiency,
                                                                               inducing increased variation.

FOx BIOSYSTEMS                          BioVille | Agoralaan Abis | 3590 Diepenbeek | Belgium                          www.foxbiosystems.com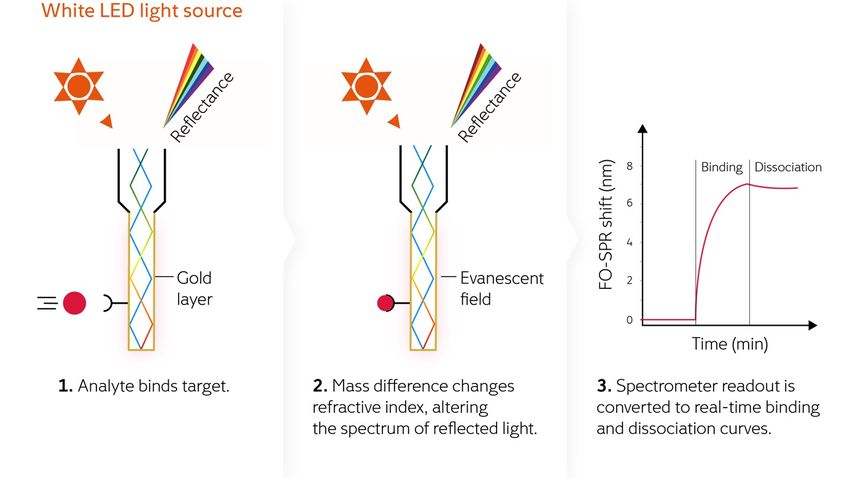
ELISA is a commonly used detection technique, but even                An adapted SPR technique using fiber optics (FO-SPR) has
    with the development of a faster IFX-specific ELISA test (2),         the advantage of using a dip-in sensor instead of
    this still takes two hours and requires a well-equipped lab           microfluidics. FO-SPR has been shown to offer a sensitive,
    and is, therefore, not convenient for typical patient                 reliable, and precise real-time alternative to ELISA for
    appointment times. High-pressure liquid chromatography                quantifying IFX in serum samples from patients (3).
    (HPLC) and liquid chromatography−tandem mass
    spectrometry (LC−MS/MS) are also frequently used.                     This application note is an evaluation and demonstration of
                                                                          FO-SPR to measure antibodies (or other proteins) in whole
    Surface plasmon resonance (SPR) exploits electromagnetic              blood, and even dried blood spots. This is a reliable method
    waves to measure local refractive index changes due to                offering a fast time to result in a user-friendly hands-off
    immobilized biomolecules and analyte binding on the                   operation, combined with a significant improvement in
    sensor surface. The most commonly used SPR biosensors                 convenience for sample collection and preparation.
    are sensitive, reliable and precise, but often expensive since
    they typically use microfluidics and an optical path that
    require experts for operation and maintenance.

   Materials and Methods
   What is FO-SPR

   FOx BIOSYSTEMS turned an optical fiber into a mass-                    The fiber-optic surface plasmon resonance (FO-SPR) sensor
   sensitive sensor using the well-established surface plasmon            is coated with bioreceptor molecules which can bind to the
   resonance (SPR) principle for biomolecular interaction                 target molecules of interest. This binding changes the
   analysis.                                                              refractive index, resulting in a wavelength shift that
                                                                          produces a sensor signal as shown in figure 1. The sensor
   The SPR effect is achieved by coupling a white light source            probe is simply dipped into the liquid sample to measure
   to the fiber optic sensor probe. In this consumable probe,             biomolecular interactions directly.
   the light interacts with a gold layer and senses the refractive
   index up to 200 nm away from the outer surface. At the end
   of the probe, light is reflected back through the bifurcated
   fiber to a spectrometer. The resonance condition is
   monitored by tracking the wavelength at which the least
   light is reflected.

   Figure 1: FO-SPR principle

Find out more at foxbiosystems.com                               Page 2 of 9                                           App note 3 | Version 1
Tools and reagents

   To perform the procedures in this application you will need:
   • White FOx instrument with FOx-SPR acquisition software and the FOx data processing tool
   • Carboxyl probes for label-free quantification (FOx BIOSYSTEMS product nr: 30.0003)
   • Microsoft Excel or other data calculation software for data handling and viewing
   • Micro pipettes from 10 to 1000 µl with disposable tips
   • On-desk refrigeration for protein solutions
   • Vertically rotating shaker
   • 903 protein saver card, Whatman
   • Microstar 17R, VWR
   • Costar high binding 96-well plates (ELISA)
   • Shaker (ELISA)
   • ELx808 Absorbance Microplate Reader (ELISA)

     Buffer/Reagent                                                                   Concentration

     MES: 2-(N-morpholino) ethanesulfonic acid, pH 6.0                                50 mM

     PBS: Phosphate buffer saline, pH 7.4                                             10 mM

     EDC: 1-ethyl-3-[3-dimethylaminopropyl] carbodiimide                              0.4 M in EDC/NHS

     NHS: N-hydroxysuccinimide                                                        0.1 M in EDC/NHS

     Anti-IFX-C monoclonal capture antibody                                           1 mg/ml

     Sodium acetate buffer, pH 5.5                                                    10 mM

     Regeneration buffer, pH 2                                                        10 mM glycine/HCl

     Blocking buffer: Superblock PBS (Thermo Fisher Scientific)
                                                                                      1 to 2.5 mg/ml stock
     Anti-IFX-D monoclonal detection antibody
                                                                                      20 ml, optical density (OD) 1
     20 nm diameter gold nanoparticles EMGC20                                         Average size 19.7 nm (CV 8%)

     Sodium carbonate                                                                 0.2 mM

     Bovine serum albumin (BSA)                                                       0.5% w/v

     Storage buffer: BSA in PBS                                                       0.5%

     Whole blood from healthy volunteers (collected in sodium citrate coated tubes)

     Plasma obtained from the above whole blood

     Serum obtained from the above whole blood

     De-identified serum and plasma samples from five IFX-treated IBD patients

     Tween-20 (detection buffer)                                                      0.01% in PBS
                                                                                      Received lyophilized
     Infliximab (Remicade)
                                                                                      Resuspended to 1 mg/ml stock

     Tween-80 (extraction buffer)                                                     0.1% in PBS

     TNF alpha (ELISA)                                                                240 ng/ml (2)

     pAB-IFX-HRP or HRP-conjugated MA-IFX (ELISA)                                     20 mg/ml (2)

     o-phenylenediamine and H2O2 in citrate buffer (ELISA)                            400 mcg/ml - 3x10⁻³% (2)

     H2SO4: Sulfuric acid (ELISA)                                                     2 M (2)

    Table 1: Reagents and buffers.
    All solutions were prepared with deionized
    water purified by a Milli-Q Plus system.

Find out more at foxbiosystems.com                                      Page 3 of 9                                   App note 3 | Version 1
Note: Special attention is required for EDC/NHS which is a Calibration curve generation
highly reactive and short-lived reagent (EDC user guide,
Sigma Aldrich) and should be prepared just prior to use. A concentration series of spiked IFX (0, 2.5, 5, 10, 20, 40,
Separately dissolve NHS and EDC no more than 5 minutes 80, and 100 ng/ml) was prepared in whole blood diluted
before use, mix in equal quantities, and pipet into the 10-fold in PBS with 0.01% Tween 20 and analyzed using a
designated wells immediately before use. previously developed FO-SPR bioassay for the detection of
IFX in serum (3). Functionalized FO probes were immersed
Alternatively, you can also prepare pre-dissolved aliquots of in the IFX dilution for 15 minutes, with each concentration
EDC and of NHS, respectively, and store them at -20°C measured by an individual functionalized FO-SPR sensor.
until use, as explained in the application note number 1 This was followed by 20 minutes of signal amplification
about immobilization on carboxyl probes. Thaw one aliquot using functionalized AuNPs. These results were used to
of each at room temperature for about 20 minutes before generate a calibration curve (figure 3) to validate the
use and mix in the designated wells just before placing the shorter FO-SPR bioassay developed during this study.
reagent in the instrument.
Preparation and extraction of dried blood spot samples
Surface functionalization of FO probes with capture
antibody 100-fold diluted dried blood spot (DBS) samples were
prepared by first diluting 10 μl of IFX stock solution in 90 μl
Carboxyl probes were treated in MES buffer prior to of whole blood. 45 μl of this dilution was applied to filter
activation. Carboxyl groups were activated by incubation in paper (903 protein saver card, Whatman) and allowed to
0.4 M EDC/0.1 M NHS in MES buffer for 15 minutes. A 20 dry overnight at room temperature. 6 mm diameter disks
µg/ml solution of anti-IFX-C monoclonal capture antibody were then placed into an Eppendorf tube containing 240 μl
in a 10 mM sodium acetate buffer at pH 5.5 was covalently extraction buffer (PBS with 0.1% Tween 80) and placed on
immobilized to the activated carboxyl groups for 30 a shaker at 300 rpm for 1 h at 21°C. The samples were
minutes. Two 30-second washes in regeneration buffer (10 centrifuged for 5 min at 13,000 rpm (16,249 g) and used
mM glycine/HCl pH 2) removed non-covalently bound immediately.
antibodies. A final immersion in blocking buffer (Superblock
PBS) deactivated any remaining unoccupied carboxyl Approximately 10 µl reconstituted blood was obtained from
groups. the 6 mm disk which was diluted 25-fold in 240 µl
extraction buffer, then further diluted in detection buffer
Surface functionalization of gold nanoparticles with (PBS with 0.01% Tween 20) to reach the final IFX
detection antibody concentrations (0, 2.5, 5, 10, 20, 40, 80, and 100 ng/ml)
after a final 4-fold dilution in detection buffer. These
Detection antibody (anti IFX-D) was conjugated to the gold samples are referred to as spiked DBS samples for the
nanoparticles (AuNPs) via physical adsorption using a remainder of this note.
modified protocol based on that from Jans et al. (4). The
AuNP solution was adjusted to pH 9.2 using 0.2 mM DBS samples without IFX were prepared to estimate the
sodium carbonate prior to use. Antibody solution was extraction efficiency by adding 10 μl detection buffer (in
added to 800 µL of 7 x 10¹¹ particles/ml AuNP solution to place of the IFX) to 90 μl whole blood and extracted as
give a final antibody concentration of 5 µg/ml and described above, then spiked with IFX to obtain the same
incubated at room temperature on a vertically rotating series of final concentrations. These samples are referred to
shaker for 20 min. 560 µL of bovine serum albumin (BSA) as reference DBS samples for the remainder of this note.
(0.5% w/v) was added to stabilize the particles and the
mixture was returned to the shaker for 1 hour at room
temperature. The solution was then centrifuged at 7000
rpm for 30 min at 20°C. After discarding the supernatant
containing unbound antibodies, the nanoparticle residue
was resuspended in PBS with 0.5% BSA. To ensure
reproducibility, the final concentration of AuNPs was
adjusted to be the same as pre-functionalized AuNPs
(7x10¹¹ particles/ml, OD of 1). The prepared AuNPs were
stored at 4°C until use. 150 μl of functionalized AuNPs
were used in each assay.
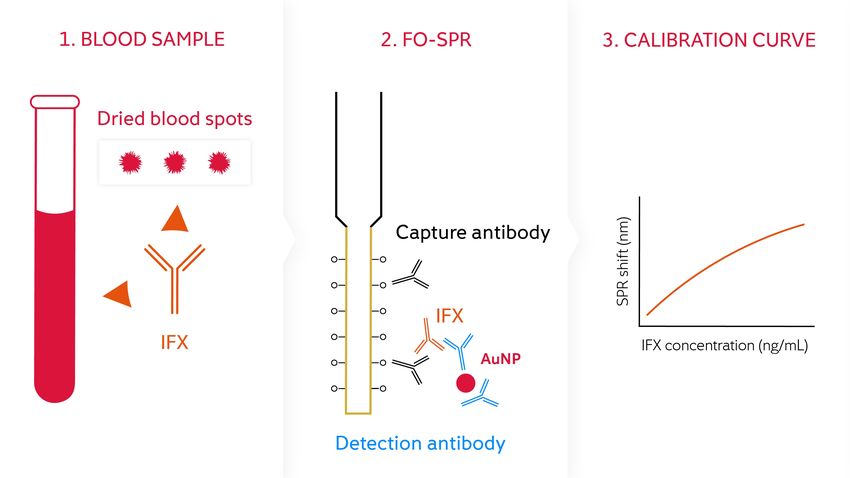
Figure 2: Assay set-up
Find out more at foxbiosystems.com Page 4 of 9 App note 3 | Version 1Establishing an accelerated FO-SPR bioassay for IFX Calculation of SPR response
detection
SPR response can be measured in multiple ways.
To establish the bioassay, functionalized FO-SPR sensors The first one is wavelength shift, referred to as “SPR shift”,
were immersed in IFX-spiked samples for 5 min, AuNP which is simply calculated by subtracting the pre-binding
storage buffer (PBS with 0.5% BSA) for 3 min, and AuNP SPR wavelength from the SPR wavelength at a given binding
solution for 5 min, resulting in a total detection time of 13 time point.
min. This assay was used to obtain calibration curves in 10-
fold diluted whole blood, 100-fold diluted whole blood, However, if the binding curves show a linear behavior and
serum, plasma, and DBS extracts, each spiked with final IFX sufficient signal increase at their onset, this part of the curve
concentrations ranging from 0 to 100 ng/ml. For each can be used to perform a slope analysis, which can be
calibration curve, four repeats, generated with two batches plotted as a function of target concentrations (Figure 4B).
of independently prepared FO-SPR sensors and AuNPs, Calculating the SPR response from the slope of the initial
were included. binding curve is hereafter referred to as “slope”.
FO-SPR bioassay validation with serum and plasma from Results
IFX-treated patients
FO-SPR detection of IFX in 10-fold diluted whole blood
The above FO-SPR bioassay was validated using five IFX-
treated patient samples, with matching serum and plasma The limit of detection (LOD) determined from the calibration
samples from each patient. curve (Figure 3) as blank sample + 3 SD was 1.12 ng/ml with
Three samples (S2, S3, and S4) were diluted 100-fold. a coefficient of variation (CV) below 10%. Non-specific
Due to higher IFX concentrations in the other two samples, binding was measured after blocking with Superblock PBS
they were further diluted; S1 150-fold diluted and S5 300- by immersing the FO-SPR sensor functionalized with capture
fold. Three repeats were measured for each sample. antibody in 10-fold diluted whole blood in the absence of
IFX, followed by a AuNP amplification step. This resulted in
Accelerated FO-SPR bioassay for detecting IFX in 10- less than 0.1 nm wavelength shift (n = 4).
fold diluted whole blood
To further shorten the previously described bioassay time
from 40 minutes, the IFX incubation and AuNP amplification
steps were shortened from 15 and 20 minutes, respectively,
to 5 minutes each. This resulted in a total detection time of
13 minutes from the time the pre-functionalized probe was
immersed in the IFX solution. A calibration curve (Figure 3)
was created from the SPR shifts obtained from measuring a
series of IFX concentrations (1 – 100 ng/ml) spiked in 10-
fold diluted whole blood four times in a random order.
IFX quantification in serum and plasma from IFX-treated
patients using ELISA
IFX in serum and plasma samples from IFX-treated IBD
patients was also quantified by ELISA using previously
optimized conditions for IFX detection (2). Each sample was
measured three times on different days. 96-well plates were Figure 3: Calibration curve for IFX spiked
coated overnight with TNF at 4°C, then blocked with PBS / in 10-fold diluted whole blood using a
1% BSA for 2 hours at room temperature. Samples were previously developed FO-SPR protocol (3).
diluted 1:150 and 1:300 in PBS / 1% BSA, added to the
plate, and incubated for 2 hours at 37°C on a shaker. Plates
were then washed and pAb-IFX-HRP or HRP-conjugated
MA-IFX was applied for detection of bound IFX and
incubated for 1 hour at room temperature. Plates were
washed and developed using o-phenylenediamine and
H2O2 in citrate buffer, and the reaction was stopped with 2
M H2SO4. The absorbance was measured at 490 nm with
an ELx808 Absorbance Microplate Reader.
Find out more at foxbiosystems.com Page 5 of 9 App note 3 | Version 1Accelerated FO-SPR bioassay for detecting IFX in 10-fold diluted whole blood
From calculating SPR shift, the accelerated bioassay time of 13 minutes resulted in a calculated LOD of 0.75 ng/ml with an average
CV of less than 12% (figure 4A). However, the AuNP binding curves showed a linear behavior within the first two minutes, therefore,
this part of the curve was used to perform a slope analysis, which was further plotted as a function of IFX concentrations. Calculating
the SPR response by slope (figure 4B) resulted in an LOD of 0.9 ng/ml and an average CV of less than 18%. This CV is slightly higher
than that obtained with SPR shift, but it is still acceptable because it is below 20%. Since the LODs were similar for both methods, it
was decided that the detection time could be reduced by 3 minutes, thereby resulting in a total assay time of just 10 minutes.
Figure 4: Calibration
curves for IFX spiked
in 10-fold diluted
whole blood using the
accelerated FO-SPR
protocol. (A) SPR
shift. (B) Slope.
FO-SPR bioassay for IFX detection in 100-fold diluted serum, plasma, and whole blood
To achieve IFX detection in the clinically relevant range (0.5−10 μg/ml in serum samples and 0.23−4.5 μg/ml in whole blood),
the samples were further diluted to ensure that measurements fell within the dynamic range of the FO-SPR bioassay. IFX
dilution series from 0 to 100 ng/ml were created in 100-fold diluted serum, plasma, and whole blood. These were quantified
using FO-SPR and calibration curves generated using both methods one and two (figure 5). The resulting LODs are shown in
table 2, with all CVs being below 15% for both methods.
Figure 5: Calibration
curves obtained from
100-fold diluted serum,
plasma, and whole blood
from SPR shift (A) and
slope (B) methods using
the accelerated FO-SPR
bioassay. n=4, error bars
are standard deviations.
SPR shift method Slope method
A random block design showed that the differences
between batches of FO-SPR sensors and AuNPs prepared
Serum 1.05 ng/ml 1.42 ng/ml
on different days were insignificant. This suggests that one
control (zero) measurement and one IFX measurement is
sufficient to obtain a concentration value from the
Plasma 1.00 ng/ml 1.00 ng/ml established calibration curve.
Table 2: LOD of IFX in 100-fold diluted serum, plasma, and
whole blood using SPR shift and slope methods.
Whole blood 1.05 ng/ml 1.34 ng/ml
Find out more at foxbiosystems.com Page 6 of 9 App note 3 | Version 1FO-SPR bioassay for IFX detection in 100-fold diluted SPR shift Slope
dried blood spots
LOD
LOD (ng/ml) CV (%) CV (%)
(ng/ml)
To assess the extraction efficiency of the protocol, IFX
concentrations were measured in 100-fold diluted
Spiked 1.17 18 1.83 17
reference (whole blood spiked with IFX after extraction
from the filter paper) and spiked samples (whole blood
Reference 1.39 20 1.59 20
spiked with IFX before extraction from the filter paper).
Using the calibration curves obtained using the accelerated
Table 3: LODs and CVs of IFX measurements in 100-fold
FO-SPR bioassay, LODs and CVs were as shown in table 3.
diluted samples. Reference = whole blood spiked with IFX
after extraction from the filter paper. Spiked = whole blood
The extraction efficiency was measured as a ratio of the
spiked with IFX before extraction from the filter paper. n = 4.
analyte concentrations between spiked and reference DBS
samples, i.e., the SPR shifts obtained for each IFX obtained by performing a correlation analysis between
concentration. This was done individually for each of the calibration curves from the reference and spiked DBS
seven concentrations which were then averaged to give samples: 0.99 (95% CI slope: 0.99 ± 0.02) for SPR shift
0.98 using SPR shift, and 0.97 using slope calculation. and 0.98 (95% CI slope: 0.99 ± 0.04) for slope calculation,
Similar results for the extraction efficiency were also (Pearson correlations 0.998 and 0.995, respectively).
Comparison of the accelerated FO-SPR bioassay performance in different matrices
To investigate the impact of different matrices on measuring IFX concentrations with the accelerated FO-SPR bioassay,
correlations were calculated between calibration curves obtained for 100-fold diluted whole blood, serum, plasma, and DBS.
The linear equation of the fitted curve, 95% CI of the slopes, and Pearson correlations are shown in table 4 using SPR shift (see
supplementary data in the original paper (1) for data obtained using slope calculation).
y-axis à
100-fold diluted whole 100-fold diluted spiked
100-fold diluted serum 100-fold diluted plasma
blood DBS
x-axis â
y = 1.01x – 0.02 y = 1.08x – 0.09 y = 0.91x – 0.05
100-fold diluted whole
95% CI = 0.04 95% CI = 0.04 95% CI = 0.02
blood
Pearson = 0.999 Pearson = 0.998 Pearson = 0.999
y = 0.99x + 0.01 y = 1.07x – 0.07 y = 0.93x – 0.07
100-fold diluted serum 95% CI = 0.04 95% CI = 0.04 95% CI = 0.02
Pearson = 0.999 Pearson = 0.999 Pearson = 0.999
y = 0.93x + 0.07 y = 1.00x + 0.01 y = 0.88x – 0.01
100-fold diluted plasma 95% CI = 0.04 95% CI = 0.1 95% CI = 0.02
Pearson = 0.999 Pearson = 0.996 Pearson = 0.999
y = 1.10x + 0.01 y = 1.10x + 0.06 y = 1.18x – 0.02
100-fold diluted DBS 95% CI = 0.04 95% CI = 0.06 95% CI = 0.06
Pearson = 0.999 Pearson = 0.998 Pearson = 0.998
Table 4: Correlations between calibration curves based on SPR shift for 100-fold diluted serum, plasma, whole blood, and DBS.
Linear regressions were fitted using calibration curves in the column as x-axis and in the row as y-axis.
Find out more at foxbiosystems.com Page 7 of 9 App note 3 | Version 1For 100-fold diluted serum, plasma, and whole blood, the IFX was also quantified in the five plasma samples (referred
results were approximately 1 for both SPR shift and slope to as P1, P2, P3, P4, and P5) from the same patients using
calculation methods, suggesting that the SPR signal for a the same dilution factors. The only difference is the
given dilution factor is almost identical, i.e., the matrix effect presence of clotting factors in plasma that are not present
was insignificant. The results of these three matrices with in serum and, therefore, similar IFX concentrations are
spiked DBS samples gave slope values of approximately expected in both matrices. Good Pearson correlations of
1.1, suggesting a nearly 10% higher signal for non-dried 0.959 and 0.968 were obtained for SPR shift and slope
sample matrices. calculations, respectively. Correlation slopes were less than
1 for both methods, indicating that IFX concentrations in
Validation of the accelerated FO-SPR bioassay with the plasma samples were slightly lower than those in the
plasma and serum samples from IFX-treated patients corresponding serum samples. This could be due to the
clotting factors in plasma making these samples less stable
The accelerated FO-SPR bioassay was validated using compared to serum during handling and storage.
matching serum and plasma samples from five IFX-treated
IBD patients. These samples were also tested using a Finally, IFX concentrations measured with the accelerated
clinically validated ELISA test which showed cutoffs and FO-SPR bioassay (slope calculation) were compared to
lower limit of quantification were 0.2 and 0.5 μg/ml IFX, those measured with ELISA (figure 6). This method was
respectively, in 150-fold diluted serum and plasma. used because of its shorter detection time while also giving
excellent correlations with results obtained using SPR shift.
IFX concentrations from serum samples, S1, S2, S3, S4, and
S5 were calculated by interpolating the obtained SPR ELISA also measured a lower IFX concentration in plasma
signals into the calibration curve, which was made using the compared to serum. The FO-SPR bioassay and ELISA had
series of IFX concentrations spiked in 100-fold diluted an excellent correlation, with Pearson correlation and
serum. Although dilution factors of S1 and S5 were intraclass correlation coefficients (ICC) of 0.999 and 0.998,
different from the calibration curve, it was demonstrated in respectively, for serum samples, and 0.997 and 0.992,
our previous application note (application note 2: Sensitive respectively, for plasma samples. The average CV of the
protein quantification in crude serum samples: comparison FO-SPR from both serum and plasma samples was
of FO-SPR and ELISA) that this still allows the approximately 10%.
determination of IFX concentrations.
Figure 6. Comparison between the IFX concentrations measured in serum (A) and plasma (B) samples from IBD patients obtained
from the accelerated FO-SPR immunoassay and ELISA. Error bars represent standard deviation (n = 3 for both FO-SPR and ELISA).
Note: samples 1 and 5 were outside the calibration curve range and required an extra dilution step to measure.
Find out more at foxbiosystems.com Page 8 of 9 App note 3 | Version 1Discussion / Conclusion
The advantage of detecting biomolecules directly in whole
blood is the ability to study the target molecules in the FO-SPR is also fully automated and can either run individual
actual environment at biologically relevant concentrations. measurements or with 4 parallel FO sensors. This means it
This allows the scientist to focus on the molecule of interest could be used to determine biological drugs in crude lab
rather than on the time-consuming, and potentially biased samples or patient samples both for a limited number of
purification procedures needed to avoid cross- samples as well as in high throughput mode.
contamination and clogging in microfluidics systems.
Acknowledgement
The fiber-optic probe setup based on surface plasmon
The authors gratefully acknowledge the MeBioS research
resonance (SPR) investigated here allows signal
group at KU Leuven and their partners at the Laboratory for
amplification using a sandwich assay format with gold
Therapeutic and Diagnostic Antibodies, KU Leuven and
nanoparticles conjugated to detection antibody. This
Division of Gastroenterology, UZ Leuven, for their elaborate
format allows the detection of concentrations of
research on FO-SPR applications in crude samples
therapeutic antibodies (here, infliximab (IFX)) down to 0.75
published in reference (1) which provided the basis of the
ng/ml within a 10-minute time frame for 100-fold diluted
method and results shared in this application note.
serum, plasma, or whole blood. In addition, the various
calibration curves obtained from serum, plasma, and whole
blood show excellent correlations, indicating insignificant References
matrix effects at this dilution.
1. Lu et al. (2017) Immunoassay for detection of
Furthermore, two effective methods of determining infliximab in whole blood using a fiber-optic surface
concentration using SPR have been demonstrated here: the plasmon resonance biosensor. Analytical Chemistry,
89, 3664-3671.
SPR shift (a 13-minute assay) and the slope of the obtained
2. Van Stappen et al. (2015) Generation of a highly
binding curves (a 10-minute assay) without compromising specific monoclonal anti-infliximab antibody for
on sensitivity or reproducibility. harmonization of TNF-coated infliximab assays. Ther.
Drug Monit. 37 (4), 479–485.
The results obtained from testing plasma and serum from 3. Lu et al. (2016) Fiber optic-SPR platform for fast and
five IFX-treated IBD patients with FO-SPR show excellent sensitive infliximab detection in serum of inflammatory
agreement with an IFX-specific ELISA test, with Pearson bowel disease patients. Biosensors and Bioelectronics
correlations and intraclass correlation coefficients (ICC) 79, 173–179.
greater than 0.99 in all cases. 4. Jans et al. (2009) Dynamic light scattering as a
powerful tool for gold nanoparticle bioconjugation and
biomolecular binding studies. Anal. Chem. 2009, 81,
The developed method was further assessed using dried 9425–9432.
blood spot (DBS) samples giving a calculated IFX extraction
efficiency of 99%. This demonstrates that (i) the blood Related application notes
drying process did not affect the extraction of IFX or its
interaction with the antibodies used in the FO-SPR bioassay How to optimize immobilization to the FO-SPR probes is
and (ii) the distribution of IFX on the DBS paper was uniform described in application note 1: Carboxyl probe
since only part of the DBS paper was used for extraction. immobilization for label-free protein quantification.
A comparison of FO-SPR with ELISA for protein
This study shows that FO-SPR is a user-friendly technology
quantification in serum samples is described in application
that combines the speed and accuracy of SPR with the note 2: Sensitive protein quantification in crude serum
advantage of fluidics-free dip-in sensing. The 10-minute samples: comparison of FO-SPR and ELISA.
assay provides a much faster and more convenient
alternative to ELISA, and even to other SPR technologies How to set up a label-free quantification assay starting
that rely on microfluidics. from an immobilized capture surface is described in
application note 4: Label-free protein quantification.
Contact
It shows great potential for applications in antibody and FOx BIOSYSTEMS NV
info@foxbiosystems.com
protein R&D and can also be adapted to quantify other +32 11 28 69 73 BioVille, Agoralaan Abis
Contact 3590 Diepenbeek, Belgium
targets, such as microvesicles or phage particles.
www.foxbiosystems.com
Find out more at foxbiosystems.com Page 9 of 9 App note 3 | Version 1You can also read