Microwave Radiometer - 3-Channel (MWR3C) Instrument Handbook - DOE/SC-ARM-TR-108
←
→
Page content transcription
If your browser does not render page correctly, please read the page content below
DOE/SC-ARM-TR-108

Microwave Radiometer – 3-Channel (MWR3C)
Instrument Handbook

MP Cadeddu

February 2021
DISCLAIMER

This report was prepared as an account of work sponsored by the U.S.
Government. Neither the United States nor any agency thereof, nor any of
their employees, makes any warranty, express or implied, or assumes any
legal liability or responsibility for the accuracy, completeness, or
usefulness of any information, apparatus, product, or process disclosed, or
represents that its use would not infringe privately owned rights. Reference
herein to any specific commercial product, process, or service by trade
name, trademark, manufacturer, or otherwise, does not necessarily
constitute or imply its endorsement, recommendation, or favoring by the
U.S. Government or any agency thereof. The views and opinions of
authors expressed herein do not necessarily state or reflect those of the
U.S. Government or any agency thereof.
DOE/SC-ARM-TR-108

Microwave Radiometer – 3-Channel
(MWR3C) Instrument Handbook

MP Cadeddu, Argonne National Laboratory

February 2021

Work supported by the U.S. Department of Energy,
Office of Science, Office of Biological and Environmental Research
MP Cadeddu, February 2021, DOE/SC-ARM-TR-108

 Acronyms and Abbreviations
AMF ARM Mobile Facility
ARM Atmospheric Radiation Measurement
DQPR Data Quality Problem Report
ENA Eastern North Atlantic
GPS Global Positioning System
IMMS instrument mentor monthly summary
LNA low-noise amplifier
LWP liquid water path
MET surface meteorological instrumentation
MWR microwave radiometer
MWR3C microwave radiometer−3-channel
MWRRET MWR Retrievals value-added product
NetCDF Network Common Data Form
NSA North Slope of Alaska
OLI Oliktok Point
PC personal computer
PWV precipitable water vapor
QC quality control
REM Rain Effect Mitigation
RMS root mean square
RMSE root-mean-square error
SGP Southern Great Plains
TWP Tropical Western Pacific
VAP value-added product

 iii
MP Cadeddu, February 2021, DOE/SC-ARM-TR-108

 Contents
Acronyms and Abbreviations ...................................................................................................................... iii
1.0 General Overview ................................................................................................................................. 1
2.0 Contacts ................................................................................................................................................ 1
 2.1 Mentor .......................................................................................................................................... 1
 2.2 Vendor/Instrument Developer ...................................................................................................... 1
3.0 Deployment Locations and History ...................................................................................................... 1
4.0 Near-Real-Time Data Plots .................................................................................................................. 2
5.0 Data Descriptions and Examples .......................................................................................................... 2
 5.1 Data File Contents ........................................................................................................................ 2
 5.1.1 Primary Variables and Expected Uncertainty ................................................................... 2
 5.1.2 Secondary/Underlying Variables ...................................................................................... 3
 5.1.3 Diagnostic Variables ......................................................................................................... 3
 5.1.4 Data Quality Flags............................................................................................................. 5
 5.1.5 Dimension Variables ......................................................................................................... 6
 5.2 Annotated Examples .................................................................................................................... 6
 5.3 User Notes and Known Problems ................................................................................................ 8
 5.4 Frequently Asked Questions ........................................................................................................ 8
6.0 Data Quality.......................................................................................................................................... 8
 6.1 Data Quality Health and Status .................................................................................................... 8
 6.2 Data Reviews by Instrument Mentor............................................................................................ 8
 6.3 Data Assessments by Site Scientist/Data Quality Office ............................................................. 9
 6.4 Value-Added Procedures.............................................................................................................. 9
7.0 Instrument Details................................................................................................................................. 9
 7.1 Detailed Description..................................................................................................................... 9
 7.1.1 List of Components ........................................................................................................... 9
 7.1.2 System Configuration and Measurement Methods ......................................................... 10
 7.1.3 Specifications .................................................................................................................. 11
 7.2 Theory of Operation ................................................................................................................... 12
 7.3 Calibration .................................................................................................................................. 13
 7.3.1 Theory ............................................................................................................................. 13
 7.3.2 Procedures ....................................................................................................................... 13
 7.3.3 History ............................................................................................................................. 16
 7.4 Operation and Maintenance ....................................................................................................... 16
 7.4.1 User Manual .................................................................................................................... 16
 7.4.2 Routine and Corrective Maintenance .............................................................................. 16
 7.4.3 Software Documentation ................................................................................................. 16

 iv
MP Cadeddu, February 2021, DOE/SC-ARM-TR-108

 7.4.4 Additional Documentation .............................................................................................. 16
8.0 Glossary .............................................................................................................................................. 16
9.0 Acronyms ........................................................................................................................................... 17
10.0 References .......................................................................................................................................... 17

 Figures
1 Brightness temperatures measured by the MWR3C at 23.834 and 30 GHz (black and red) versus
 MWR measurements at 23.8 and 31 GHz (y-axis)................................................................................. 7
2 Three rain events on Gan Island, Maldives and the effect of the rain mitigation system on the
 MWR (violet line, 31.4 GHz) and the MWR3C (black line, 30 GHz). .................................................. 8
3 Left panel: comparison of PWV retrievals from the MWR3C physical (x-axis) and neural
 network (y-axis) retrievals (1). Right panel: LWP retrievals from the MWR3C physical (x-axis)
 and neural network (y-axis, black) retrievals. ...................................................................................... 12
4 Left panel: Percentage PWV error as a function of PWV from various instruments and
 algorithms. Right panel: same as in the left panel but for LWP retrieval. Figure from (1).................. 13
5 Instantaneous Tnd values derived from tip curves (brown points) and running median values
 (black line)............................................................................................................................................ 15

 Tables
1 Status and location of the MWR3C ........................................................................................................ 1
2 Primary variables. ................................................................................................................................... 2
3 Secondary variables. ............................................................................................................................... 3
4 Diagnostic variables. .............................................................................................................................. 4
5 Data quality thresholds. .......................................................................................................................... 5
6 Dimension variables. .............................................................................................................................. 6
7 Instrument specifications. ..................................................................................................................... 11

 v
MP Cadeddu, February 2021, DOE/SC-ARM-TR-108

1.0 General Overview
 The microwave radiometer 3-channel (MWR3C) provides time-series measurements of brightness
 temperatures from three channels centered at 23.834, 30, and 89 GHz. These three channels are sensitive
 to the presence of liquid water and precipitable water vapor.

2.0 Contacts
 2.1 Mentor
 Maria Cadeddu
 Environmental Sciences Division
 Argonne National Laboratory, Building 240
 Argonne, Illinois 60439
 Ph: 630-252-7408
 mcadeddu@anl.gov

 2.2 Vendor/Instrument Developer
 Radiometrics Corporation.
 2840 Wilderness Place Unit G
 Boulder, Colorado 80301-5414
 Ph: 303-449-9192
 info@radiometrics.com

3.0 Deployment Locations and History
 Table 1. Status and location of the MWR3C
 Serial Number Manufacture Location Date Installed Date Removed Status
 Radiometrics SGP/C1 2011/10/01 2020/10/13 Retired
 Radiometrics AMF2 2011/01/11 2017/11/09 Retired
 Radiometrics AMF1 2012/07/25 2017/11/01 Retired
 Radiometrics SGP/E32 2016/06/29 Operational
 Radiometrics SGP/E41 2016/06/10 2019/03/14 Retired

 Radiometrics SGP/E39 2016/03/31 2019/08/12 Retired

 Radiometrics SGP/E37 2016/03/28 Operational
 RPG ENA 2014/03/03 Operational
 RPG OLI 2013/09/09 Operational
 RPG (G5) AMF1 2019/10/18 Operational
 RPG (G5) AMF2 2019/10/18 Operational
 RPG (G5) SGP/C1 2021/01/27 Operational
 RPG (G5) NSA/C1 2021/04 Operational

 1
MP Cadeddu, February 2021, DOE/SC-ARM-TR-108

4.0 Near-Real-Time Data Plots
 Plots of near-real-time data can be viewed at the Data Quality Explorer system accessible through the
 website: http://dq.arm.gov/. Click on “QC Metrics and Plots” and select the desired site and datastream.
 The MWR3C datastream is “sssmwr3cFF.b1” where ‘sss’ is the site (SGP, TWP, etc.) and ‘FF’ is the
 facility (C1, M1, etc.)

5.0 Data Descriptions and Examples

 5.1 Data File Contents
 Datastreams available from the ARM Data Center are named: sssmwr3cFF.b1 and contain calibrated
 brightness temperatures and retrievals. Raw data files are available upon request. For the Radiometrics
 systems, they are named sssmwr3cFF.00.yyyymmdd.hhmmss.raw.PR-2289C-SN_yyyy-mm-dd_hh-mm-
 ss.csv. Data files containing the calibration results from tip curves are named
 sssmwr3cFF.00.yyyymmdd.hhmmss.raw.PR-2289C-SN_yyyy-mm-dd_hh-mm-ss_dailytips.csv. For the
 RPG systems, they are NetCDF files (LV0.nc).

 5.1.1 Primary Variables and Expected Uncertainty 1

 The primary variables measured by the MWR3C are brightness temperatures at 23.834, 30, and 89 GHz
 for the Radiometrics system and 23.8, 31.4, and 90 GHz for the RPG system. By relating the observed
 radiances to atmospheric water vapor and liquid water it is possible to derive precipitable water vapor
 (PWV) and liquid water path (LWP) from the measurements. Retrievals of integrated water vapor and
 liquid water path obtained from brightness temperatures measured at the three frequencies are provided in
 the data files. Uncertainties in the retrieved PWV and LWP are provided in the data files as individual
 error bars.

 Table 2. Primary variables.
 Variable Name Quantity Measured Unit Uncertainty (1σ)
 Radiometrics/
 23.834 GHz sky brightness temperature K 0.5 K
 Tbsky23
 Radiometrics/
 30 GHz sky brightness temperature K 0.5 K
 Tbsky30
 Radiometrics/
 89 GHz sky brightness temperature K 1.5 K
 Tbsky89
 RPG/Tbsky23 23.8 GHz sky brightness temperature K 0.5 K
 RPG/Tbsky31 31 GHz sky brightness temperature K 0.5 K
 RPG/Tbsky90 90 GHz sky brightness temperature K 1.5 K
 lwp Liquid water path mm ~0.015 mm
 pwv Precipitable water vapor cm ~0.05 cm

 1
 See section 7.5 for a definition of uncertainty.

 2
MP Cadeddu, February 2021, DOE/SC-ARM-TR-108

5.1.2 Secondary/Underlying Variables

 Table 3. Secondary variables.
 Variable Name Quantity Measured Unit Uncertainty (1σ)
time Time offset from midnight s
Radiometrics/RPG
 Ambient temperature C 0.5
surface_temperature
Radiometrics/RPG
 Pressure KPa 0.1
surface_pressure
Radiometrics/RPG
 Relative humidity % 5
surface_relative_humidity
Radiometrics/
 Average wind direction deg 3
wind_direction_avg
Radiometrics/
 Wind direction maximum deg 3
wind_direction_max
Radiometrics/
 Wind direction minimum deg 3
wind_direction_min
Radiometrics/
 Average wind speed m/s 5%
wind_speed_avg
Radiometrics/
 Wind speed maximum m/s 5%
wind_speed_max
Radiometrics/
 Wind speed minimum m/s 5%
wind_speed_min
RPG (G5)/
 Wind speed m/s 5%
Wind_speed
RPG (G5)/
 Wind direction deg 3
Wind_direction
Radiometrics/RPG
 Zenith-pointing infrared temperature at 10µm K 0.5
infrared_temperature
Radiometrics/
 Rain accumulation mm 5%
rain_accumulation
Radiometrics/
 Rain duration s 10
rain_duration
Radiometrics/RPG (G5)
 Rain intensity mm/hr Not provided
rain_intensity
Radiometrics/
 Hail accumulation hit/cm2 Not provided
hail_accumulation
Radiometrics/
 Hail duration s 10
hail_duration
Radiometrics/
 Hail intensity hit/(hr cm2) Not provided
hail_intensity
Radiometrics/
 Rain peak intensity mm/hr Not provided
rain_peak_intensity

5.1.3 Diagnostic Variables

The following diagnostic variables are in the PR-2289C-SN_yyyy-mm-dd_hh-mm-ss_dailytips.csv files
associated with the raw datastream for the Radiometrics systems and in the
SSSmwr3ctipFF.a1.YYYYMMDD.HHMMSS.cdf for the RPG systems.

 3
MP Cadeddu, February 2021, DOE/SC-ARM-TR-108

 Table 4. Diagnostic variables.
 Variable Name Quantity Measured Unit Uncertainty (1σ)
Radiometrics/
 Physical temperature of the K-band receiver case K 5K
TcaseK
Radiometrics/
 Physical temperature of the K-band radiometer reference load K 5K
TloadK
Radiometrics/
 Physical temperature of the W-band receiver case K 1.5 K
TcaseW
Radiometrics/
 Physical temperature of the W-band radiometer reference load K 2.5 K
TloadW
Radiometrics/
 Instantaneous Tnd at 23.834 GHz from tip curves K 0.5 K
Tnd23834
Radiometrics/
 Instantaneous Tnd at 23.834 GHz at nominal temperature K 0.5 K
Tnd(0C)23834
Radiometrics/
 Temperature correction coefficient at 23.834 GHz K/K
TndTC23834
Radiometrics/
 Mean radiating temperature at 23.834 GHz K 10 K
Tmr23834
Radiometrics/
 Tip curve correlation coefficient
R23834
Radiometrics/
 Instantaneous Tnd at 30.000 GHz from tip curves K 0.5 K
Tnd30000
Radiometrics/
 Instantaneous Tnd at 30.000 GHz at nominal temperature K 0.5 K
Tnd(0C)30000
Radiometrics/
 Temperature correction coefficient at 30.000 GHz K/K
TndTC30000
Radiometrics/
 Mean radiating temperature at 30.000 GHz K 10 K
Tmr30000
Radiometrics/
 Tip curve correlation coefficient
R300000
Radiometrics/
 Instantaneous Tnd at 89.000 GHz from tip curves K 2K
Tnd89000
Radiometrics/
 Instantaneous Tnd at 89.000 GHz at nominal temperature K 2K
Tnd(0C)89000
Radiometrics/
 Temperature correction coefficient at 89.000 GHz K/K
TndTC89000
Radiometrics/
 Mean radiating temperature at 89.000 GHz K 10 K
Tmr89000
Radiometrics/
 Tip curve correlation coefficient
R89000
RPG/
 Median Tnd at 23 GHz K 0.5 K
tndmed23

RPG/
 Instantaneous Tnd at 23.000 GHz from tip curves K 2K
Tndinst23

RPG/
 Tip curve correlation coefficient at 23 GHz
r23
RPG/
 Mean radiating temperature at 23.000 GHz K 10 K
Mean_rad_temp_23
RPG/
 Median Tnd at 31 GHz K 0.5 K
Tndmed31

 4
MP Cadeddu, February 2021, DOE/SC-ARM-TR-108

 Variable Name Quantity Measured Unit Uncertainty (1σ)
RPG/
 Instantaneous Tnd at 31.000 GHz from tip curves K 2K
Tndinst31
RPG/
 Tip curve correlation coefficient at 31 GHz
R31
RPG/
 Mean radiating temperature at 31.000 GHz K 10 K
Mean_rad_temp_31
RPG/
 Median Tnd at 90 GHz K 0.5 K
Tndmed90
RPG/
 Instantaneous Tnd at 90.000 GHz from tip curves K 2K
Tndinst90
RPG/
 Tip curve correlation coefficient at 90 GHz
R90
RPG/
 Mean radiating temperature at 90.000 GHz K 10 K
Mean_rad_temp_90
RPG (G5)/
 23.84 GHz channel gain V/K N/A
gain_23
RPG (G5)/
 31.4 GHz channel gain V/K N/A
gain_31
RPG (G5)/
 90 GHz channel gain V/K N/A
gain_90
RPG (G5)/
 23.84 GHz channel gain K N/A
trec_23
RPG (G5)/
 31.4 GHz channel gain K N/A
trec_31
RPG (G5)/
 90 GHz channel gain K N/A
trec_90

5.1.4 Data Quality Flags

Data quality flags are named qc_‘fieldname’ (i.e., qc_tbsky90). Possible values for qc_flags are: 0 (value
is within the specified range), 1 (missing value), 2 (value is less than the specified minimum), 4 (value is
greater than the specified maximum), and 8 (value failed the valid “delta” check). Specified maximum
and minimum values are shown in Table 5.

 Table 5. Data quality thresholds.
 Field Name Min Max
 Radiometrics/Tbsky23 2.73 330
 Radiometrics/Tbsky30 2.73 330
 Radiometrics/Tbsky89 2.73 330
 Radiometrics/surface_temperature -50 50
 Radiometrics/surface_pressure 70 110
 Radiometrics/surface_relative_humidity 0 110
 Radiometrics/wind_direction_avg 0 360
 Radiometrics/wind_direction_max 0 360
 Radiometrics/wind_direction_min 0 360

 5
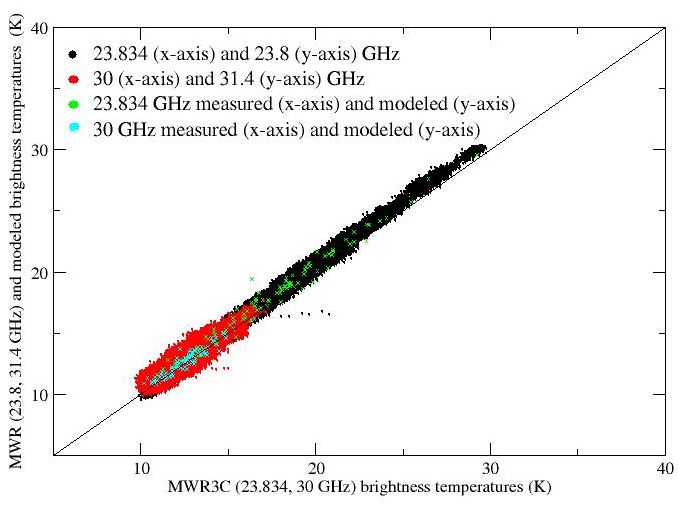
MP Cadeddu, February 2021, DOE/SC-ARM-TR-108

 Field Name Min Max
 Radiometrics/wind_speed_avg 0 30
 Radiometrics/wind_speed_max 0 30
 Radiometrics/wind_speed_min 0 30
 Radiometrics/infrared_temperature 173 305
 Radiometrics/rain_accumulation 0 30
 Radiometrics/rain_duration 0 21600
 Radiometrics/rain_intensity 0 500
 Radiometrics/hail_accumulation 0 10
 Radiometrics/hail_duration 0 3600
 Radiometrics/hail_intensity 0 500
 Radiometrics/rain_peak_intensity 0 30
 RPG/Tbsky23 2.73 330
 RPG/Tbsky31 2.73 330
 RPG/Tbsky90 2.73 330
 RPG/surface_temperature -50 50
 RPG/surface_pressure 70 110
 RPG/surface_relative_humidity 0 110

5.1.5 Dimension Variables

These variables are common to the Radiometrics and RPG systems.

 Table 6. Dimension variables.
 Field Name Quantity Unit
 base_time Base time in Epoch seconds since 1970-1-1 0:00:00 0:00
 time_offset Time offset from base_time s
 lat north latitude degrees
 lon east longitude degrees
 alt altitude meters above Mean Sea Level

5.2 Annotated Examples
In this section are some examples of data. Figure 1 (1) shows a comparison of brightness temperatures
between the microwave radiometer (MWR) and the MWR3C at the Southern Great Plains (SGP) site for
the month of November 2011. The figure shows a very good consistency of the measurements from the
two instruments. For the example shown the root-mean-square (RMS) differences between measured and
modeled brightness temperatures (green points) are 0.7 K and 0.4 K for the 23.834 and 30 GHz
respectively. The slightly higher RMS differences in the 23.834 GHz channel may be due to a residual
temperature dependence of the calibration of that channel.

 6
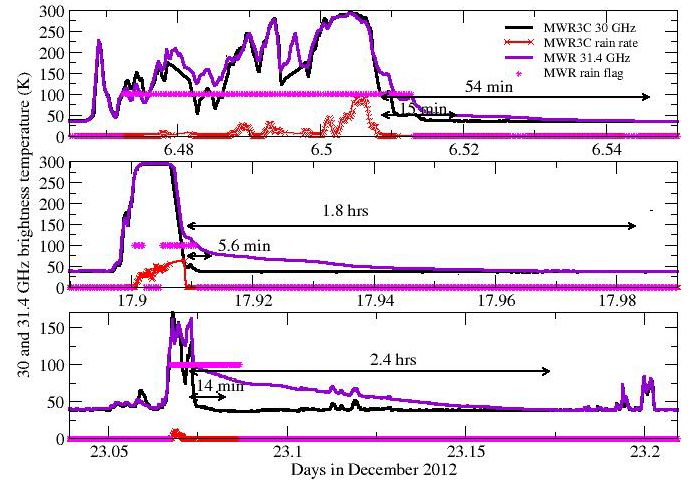
MP Cadeddu, February 2021, DOE/SC-ARM-TR-108

Figure 1. Brightness temperatures measured by the MWR3C at 23.834 and 30 GHz (black and red)
 versus MWR measurements at 23.8 and 31 GHz (y-axis). Green and cyan points are
 brightness temperatures at 23.834 and 30 GHz measured by the MWR3C (x-axis) and
 modeled (y-axis). Data were collected at the SGP during the month of November 2011.
 Figure from (1).

The rain mitigation system is designed to keep the two receivers’ lenses dry in situations of high humidity
or light rain. For this purpose a stream of warm air is blown across the lenses when the relative humidity
exceeds a user-adjustable threshold. Air is blown at high speed during rain to keep the lenses clear of
standing water. The rain detection and mitigation system of the MWR3C shows improved capability in
quickly drying the lenses after a rain event as shown in Figure 2 (1). The three panels show brightness
temperatures (30 GHz) during three rain events on Gan Island, Maldives, in December 2011. Red crosses
indicate rain rate (mm/hr) as reported by the MWR3C rain sensor. Pink crosses indicate the times when
the MWR rain flag was on (100) and off (0). During these times the heater in the MWR dew blower was
blowing warm air on the radiometer’s Teflon window. The two black lines with arrows start when the rain
stops (according to the MWR3C sensor). In general the MWR3C brightness temperatures drop back to
normal levels after approximately 5-10 minutes from the end of the rain, suggesting that this is the time
necessary to completely free the lens of standing water.

 7
MP Cadeddu, February 2021, DOE/SC-ARM-TR-108

 Figure 2. Three rain events on Gan Island, Maldives and the effect of the rain mitigation system on the
 MWR (violet line, 31.4 GHz) and the MWR3C (black line, 30 GHz). Red points are the rain
 rate (mm/hr) measured by the MWR3C weather station; pink points represent the times when
 the MWR rain flag was on. The black solid lines indicate the time between the end of the rain
 (zero rain rate according to the MWR3C) and the return of brightness temperatures to
 approximate pre-rain values. Figure from (1).

 5.3 User Notes and Known Problems
 Starting in June 2018 the E32 unit has intermittent data from the surface meteorological instrumentation
 (MET) sensor (see DQPR 7158).

 5.4 Frequently Asked Questions
 This section is not yet available.

6.0 Data Quality

 6.1 Data Quality Health and Status
 Daily quality check on this datastream can be found at the Data Quality Explorer page: http://dq.arm.gov/.
 Click on “QC Metrics and Plots” and select the desired site and datastream. For example, for the MWR3C
 located at the site “SGP”, the datastream is “sgpmwr3cC1.b1” and the facility is “C1”.

 6.2 Data Reviews by Instrument Mentor
 The instrument mentor submits a monthly summary report (instrument mentor monthly summary: IMMS)
 accessible from the instrument web page. Some of the general checks performed by the instrument mentor
 are described below.
 1. In general, the brightness temperature time series should be smooth and with low noise levels.
 2. Brightness temperatures should be greater than 2.75 K and less than approximately 330 K.

 8
MP Cadeddu, February 2021, DOE/SC-ARM-TR-108

 3. External temperature readings can be compared to tower measurements. The agreement should be
 +/- 2 K.
 4. External pressure readings can be compared to tower measurements. The agreement should be
 +/- 5 KPa.
 5. External relative humidity readings can be compared to tower measurements. The agreement should
 be +/- 5%
 6. Measured brightness temperatures are also compared with model computations as a general quality
 check.
 7. Data from the rain detection system are routinely checked against other similar measurements
 depending on their availability at a given site.

 6.3 Data Assessments by Site Scientist/Data Quality Office
 The Data Quality office daily data assessment can be view at the DQHands web page.

 6.4 Value-Added Procedures
 The MWR Retrievals (MWRRET) algorithm provides physical retrievals of water vapor and liquid water
 path.

7.0 Instrument Details

 7.1 Detailed Description
 The Radiometrics MWR3C measures sky radiances at three frequencies: 23.834, 30, and 89 GHz.
 Radiance measurements are converted to “equivalent brightness temperatures” through the calibration
 procedure.

 The RPG MWR3C measures sky radiances at three frequencies: 23.8, 31, and 90 GHz. Radiance
 measurements are converted to “equivalent brightness temperatures” through the calibration procedure.

 Below is detailed description of the instrument components for each system.

 7.1.1 List of Components

 Radiometrics:
 • RF section: 2 microwave receivers PR2289 model manufactured by Radiometrics Corp.
 • FLIR DP300 pan tilt unit
 • Main junction box
 • Embedded PC controller
 • Radiometer stand

 9
MP Cadeddu, February 2021, DOE/SC-ARM-TR-108

 • Rain Effect Mitigation (REM) system composed of a blower assembly and 2 heaters
 • Vaisala weather station WXT510
 • Garmin GPS unit
 • Heitronix KT15II infrared thermometer

RPG:
 • RF section: 2 microwave receivers
 • PC
 • Radiometer stand
 • Blower assembly
 • Vaisala weather station
 • infrared thermometer

7.1.2 System Configuration and Measurement Methods

7.1.2.1 Radiometrics

In this section we briefly describe the MWR3C hardware configuration. The MWR3C is composed of two
PR-series microwave receivers. The PR2230 is the K-band receiver and can be calibrated to up to 30
frequencies between 22 and 30 GHz. In operational mode only 2 channels (22.834 and 30 GHz) are
calibrated. The K-band channels have a bandwidth of 300 MHz. The PR8900 is the W-band receiver that
is calibrated at 89 GHz (1.9 GHz bandwidth). The receivers are enclosed in a watertight case equipped
with active moisture and pressure control. The entire receiver subsystem with the exception of the
external lens is thermally stabilized to 30 mK. Residual temperature dependences due to the external lens
are corrected in the calibration procedure with the use of additional temperature coefficients. The
radiation entering the lens passes through a feedhorn and is directed to a PIN switch. The switch is
periodically set to a load position. In this case the receiver sees the “black body” that is kept at a
temperature carefully monitored with a precision thermometer. The gain is monitored by periodically
injecting a calibrated noise through a noise diode. The receivers are moved in azimuth and elevation by a
pan tilt unit and they are equipped with internal accelerometers to precisely determine the elevation angle.
In normal operation mode the radiometers observe the sky in zenith position. Zenith measurements are
interrupted approximately every 15 minutes to collect scanning measurements used to perform the
absolute calibration. All data processing and software operations are performed by an embedded
computer located inside the main junction box.

The two receivers’ lenses are kept free of dew and water drops in drizzle conditions by the Rain Effect
Mitigation (REM) system. The system is composed of a dew blower and two heaters that blow warm air
on the lenses when the relative humidity exceeds a user-selectable threshold.

 10
MP Cadeddu, February 2021, DOE/SC-ARM-TR-108

7.1.2.2 RPG

The material in this section can be found in (1). The radiometer has two direct-detection receiver units.
An off-axis paraboloid mirror is used to focus microwave radiation onto a corrugated feed horn. The
microwave radiation entering the instrument is first decomposed into two beams. Each beam is directed in
a feed horn to generate a beam of the desired divergence (~3.3o and 1.6 o HPBW). A 40-dB low-noise
amplifier (LNA) boosts the input signal before it is filtered and boosted again by another 20-dB amplifier.
The waveguide band pass filters bandwidths and center frequencies are listed in Table 7. All channels are
detected and integrated simultaneously. The receivers are based on the direct detection technique, where
the signal is directly amplified, filtered, and detected.

The radiometer receivers are thermally stabilized to an accuracy of ± 0.02 K. Due to this extremely
accurate stability, the instrument can run without gain calibration for about 30 minutes maintaining a
radiometric accuracy of ± 0.3 K. The systems labeled as G5 have a continuous gain calibration and are
calibrated with RPG proprietary methodology.

7.1.3 Specifications

 Table 7. Instrument specifications.
 Parameter Value
 Radiometrics/
 < 500 K
 Receiver noise temperature 23.834 GHz
 Radiometrics/
 < 500 K
 Receiver noise temperature 30 GHz
 Radiometrics/
 =1 s
 Integration time
 Radiometrics/
 ~3.0o
 HPBW K-band channels
 Radiometrics/
 ~3.5o
 HPBW W-band channel
 Radiometrics/
 -40 to +45 C (environmental chamber tested)
 Temperature range
 RPG/
 < 400 K
 Receiver noise temperature 23.8 GHz
 RPG/
 < 400 K
 Receiver noise temperature 31 GHz

 11
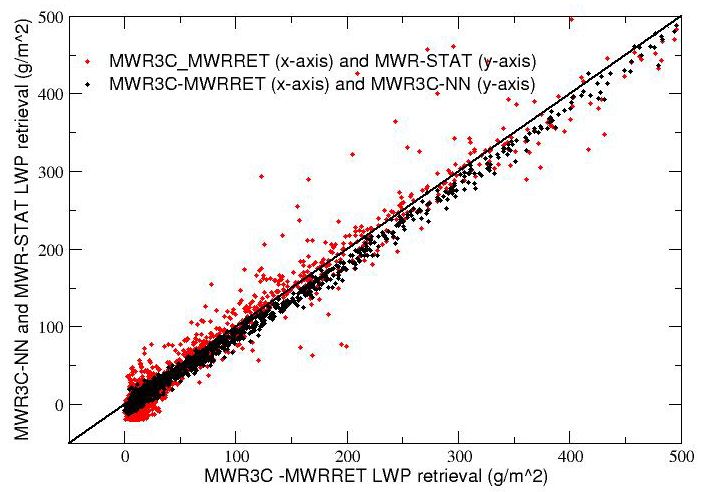
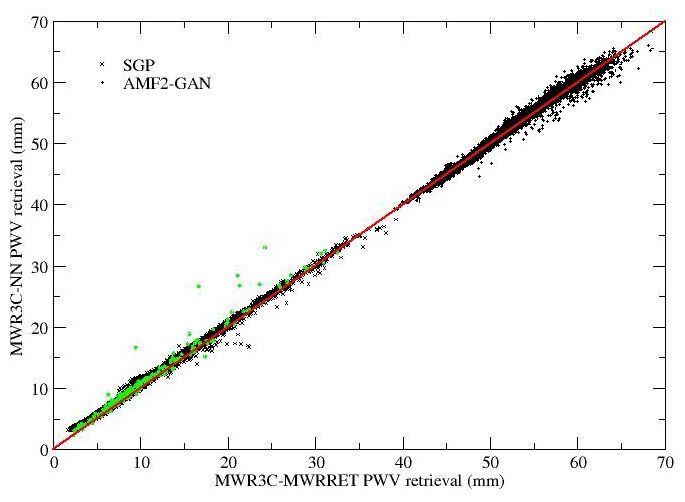
MP Cadeddu, February 2021, DOE/SC-ARM-TR-108

 Parameter Value
 RPG/
 =1 s
 Integration time
 RPG/
 ~3.0o
 HPBW K-band channels
 RPG/
 ~1.6
 HPBW W-band channel
 RPG/
 -40 to +45 C (environmental chamber tested)
 Temperature range

7.2 Theory of Operation
The three channels of the MWR3C are highly sensitive to the presence of water vapor and liquid water in
the atmosphere. The two K-band frequencies (23.834 and 30 GHz, or 23.8 and 31 GHz) are similar to the
frequencies sampled by the MWR (23.8 and 31.4 GHz) to ensure continuity of the measurements. The
additional 89 (or 90) GHz channel provides increased sensitivity to the presence of cloud liquid water.
The additional channel should therefore improve LWP retrievals, particularly when the liquid water
amount is low. Real-time retrievals of integrated water vapor and liquid water path are available from the
ARM Data Center in the datastream sssmwr3cFF.b1. The retrievals are obtained with a neural network
algorithm similar to the one described in (2). Physical retrievals are available as value-added products
(VAPs). Figure 3 (left panel, [1]) shows a comparison of PWV retrieved with the neural network and the
physical retrieval at the SGP and at the AMF2-GAN. The right panel shows LWP retrievals.

Figure 3. Left panel: comparison of PWV retrievals from the MWR3C physical (x-axis) and neural
 network (y-axis) retrievals (1). At the SGP (crosses) and AMF2-GAN (circles). Green points
 represent radiosondes measurements. Right panel: LWP retrievals from the MWR3C physical
 (x-axis) and neural network (y-axis, black) retrievals. Red points are the MWR statistical
 retrievals.

 12
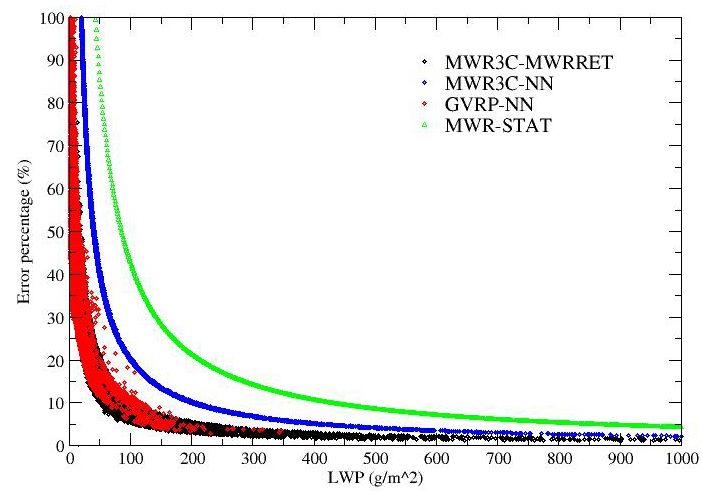
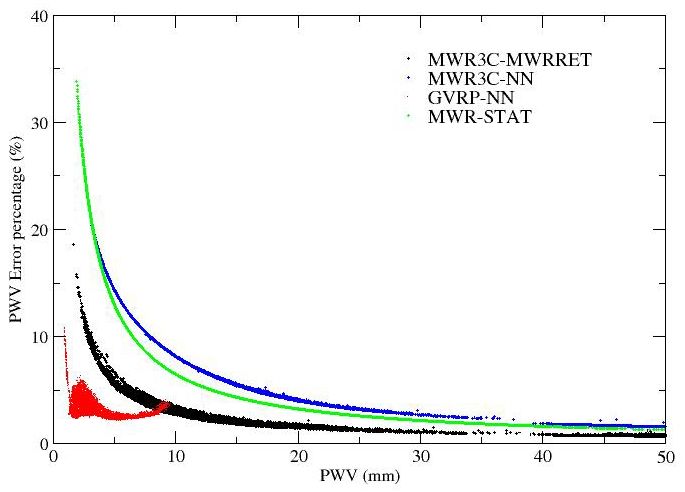
MP Cadeddu, February 2021, DOE/SC-ARM-TR-108

With the addition of the 89 (90)-GHz channel, the PWV and LWP retrieval uncertainty can be reduced as
shown in Figure 4 (1).

Figure 4. Left panel: Percentage PWV error as a function of PWV from various instruments and
 algorithms. Right panel: same as in the left panel but for LWP retrieval. Figure from (1).

7.3 Calibration

7.3.1 Theory

Once in the field, the MWR3C calibrates exclusively with tip curves. In-factory calibration determines the
receiver non-linearity coefficients and the lens temperature-dependent offset. A residual temperature
dependence of the lens is derived from the tip curves results in the Radiometrics systems. With the tip
curve algorithm, the gain and receiver temperature are uniquely determined. The processing of the tip
curves is designed to be consistent with the MWR’s (3) and MWRHF’s (1) calibration procedures. Tip
curves are collected every 15 minutes. In the tip curve procedure a linear regression is performed between
the optical thickness and the air mass. The straight line is extrapolated to zero air mass. The detector
reading at this point corresponds to a radiometric temperature, which equals the system noise temperature
plus 2.7 K. A second detector voltage is measured with the radiometer pointing at the ambient
temperature with known radiometric temperature. Various corrections are applied to achieve increased
accuracy in the results. Once a sufficiently large number of acceptable tip curves are collected (the
number of points as well as the acceptance criterion are user selectable), they are processed and a median
value is used in the computations of brightness temperatures.

7.3.2 Procedures

The calibration algorithm is based on the assumption that, although noise diodes are known to be stable
over time, the effective noise diode injection temperature as determined from tip curves will eventually
show some drift over a period of a few months. For the Radiometrics systems the radiometer equations
used to calibrate the brightness temperatures are the following:

 = ( + + ) (1)

 = ( + + + ) (2)

 = ( + ) (3)

 13
MP Cadeddu, February 2021, DOE/SC-ARM-TR-108

Where Vload and VloadND are detector voltages recorded when viewing the internal reference load with the
noise diode off and on and Vsky are voltages recorded when viewing the sky. The noise diode injection
temperature TND and the Offset have a residual temperature dependence:

 0
 = + 1 (4)

 = 0 + 2 (5)

 0
Where and 0 are the values at the nominal temperature of 0o C, c1 and c2 are coefficients, and
Tc is the physical temperature of the receiver case expressed in degrees Celsius. The gain is therefore
expressed as:

 1/ 1/
 −
 = �
 � (6)

and the receiver temperature Trcv as:

 = �
 � − − . (7)

The sky temperature is computed as:

 1/
 = �
 � − . (8)

Equation 8 is the basic equation that is used in the calibration. The gain is monitored at each measurement
point. On the other hand the noise diode is calibrated with the tip curves procedure. During tip
calibrations the radiometer scans on both sides of the window and also acquires readings of the internal
load. The noise diode is calibrated with the following equation:

 1 1

 −
 = � 1 1 � ( − − ). (9)
 −

To have an estimate of TND it is necessary to acquire an independent Tsky value. This is achieved through
frequent tip curves. In the tip curve procedure the opacity (τ) computed at each elevation angle is plotted
as a function of airmass and the slope of the regression (τz) is computed. Tsky is then determined as:

 = − + (1 − − ). (10)

where Tmr is the atmospheric mean radiating temperature. This Tsky value is then substituted in (9) to
determine the instantaneous value of Tnd. Instantaneous values of Tnd are collected and stored. Once a day
the algorithm processes the acquired tip curves and determines a median value that is used in (6) and (8).
An example of estimated TND for the 89 GHz channel is shown in Figure 5 (from [1]).

 14
MP Cadeddu, February 2021, DOE/SC-ARM-TR-108

Figure 5. Instantaneous Tnd values derived from tip curves (brown points) and running median values
 (black line). The dashed lines represent 2 standard deviations from the mean.

The RPG (not labeled as G5) system is calibrated similarly to the MWRHF. The radiometer equation
used in the algorithm is:

 Tsky = Tbb + (Vsky – Vbb)/G (11)

where Vsky is the signal recorded when the reflector is oriented towards the sky, Vbb is the signal recorded
while looking at the black body target, G is the gain, and Tbb is the physical temperature of the black body
target. Equation 11 is the basic equation used in the calibration. The radiometer performs absolute
calibrations by conducting tip curves every hour and gain calibrations every 5 minutes. During tip
calibrations the radiometer scans on both sides of the window and acquires black body readings. During
gain calibration the radiometer acquires only black body readings.

The gain G is determined by:

 + −
 =
 (12)

where Vbb+nd is the signal associated to the black body with the noise diode on.

To have an estimate of Tnd it is necessary to acquire an independent Tsky value. This is achieved through
hourly tip curves as previously described. This Tsky value is then substituted in (3) to determine the
instantaneous value of Tnd that will be called TndI (9). Scanning on both sides of the window, although it
increases the time necessary for the calibration, helps to minimize the errors due to misalignment. Notice
that only the slope (and not the intercept) is determined in the tip curve process. A tip curve is considered
good if the correlation coefficient of the regression is higher than a predefined threshold of 0.995. The
variability in the instantaneous values TndI is such that it is not desirable to introduce these single values
directly in the calibration algorithm (2) and (1). Instead, the following procedure is adopted:
Instantaneous values TndI are collected and stored in a circular array of 50 (or more) points and the
median value of the array is computed. Every time a new tip is collected, the elements of the array are
shifted one position and the newest tip is stored as the last element of the array. A new median value of
the array is then computed.

The brightness temperature is calculated from the calibrated gain as:

 = �
 � − (13)

where

 15
MP Cadeddu, February 2021, DOE/SC-ARM-TR-108

 = �
 � − .

 The systems labeled as RPG G5 follow a RPG proprietary calibration that involves continuous
 calibration with noise diode.

 7.3.3 History

 2009-2011: Initial tests, design modification, and REM system development.

 2011: Deployment of first three operational units at the AMF2, SGP, TWP C3.

 7.4 Operation and Maintenance

 7.4.1 User Manual

 User manuals are provided to the site operators during the deployment stage.

 7.4.2 Routine and Corrective Maintenance

 To be written.

 7.4.3 Software Documentation

 Available through the Data Management Facility or instrument mentor.

 7.4.4 Additional Documentation

 N/A

8.0 Glossary
 Uncertainty: We define uncertainty as the range of probable maximum deviation of a measured value
 from the true value within a 95% confidence interval. Given a bias (mean) error B and uncorrelated
 random errors characterized by a variance σ2, the root-mean-square error (RMSE) is defined as the vector
 sum of these:

 .

 (B may be generalized to be the sum of the various contributors to the bias and σ2 the sum of the
 variances of the contributors to the random errors). To determine the 95% confidence interval we use the
 Student’s t distribution: tn;0.025 ≈ 2, assuming the RMSE was computed for a reasonably large ensemble.
 Then the uncertainty is calculated as twice the RMSE.

 16
MP Cadeddu, February 2021, DOE/SC-ARM-TR-108

9.0 Acronyms
 See https://arm.gov/resources/acronyms

10.0 References
 (1) Cadeddu, MP, JC Liljegren, and DD Turner. 2013. “The atmospheric radiation measurement (ARM)
 program network of microwave radiometers: Instrumentation, data, and retrievals.” Atmospheric
 Measurement Techniques 6(9): 2359−2372, https://doi.org/10.5194/amt-6-2359-2013

 (2) Cadeddu, MP, DD Turner, and JC Liljegren, 2009. “A neural network for real-time retrievals of PWV
 and LWP from arctic millimeter-wave ground-based observations.” IEEE Transactions on Geoscience
 and Remote Sensing 47(7): 1887–1900, https://doi.org/10.1109/TGRS.2009.2013205

 (3) Liljegren, JC. 2000. “Automatic self-calibration of ARM microwave radiometers,” in Microwave
 Radiometry and Remote Sensing of the Earth’s Surface and Atmosphere, P. Pampaloni and S. Paloscia,
 Eds. VSP Book, Lorton, Virginia, pp. 433–443.

 (4) RPG_MWR_STD_Technical_Manual_2015 available for download from https://www.radiometer-
 physics.de/downloadftp/pub/PDF/Radiometers/General_documents/Manuals/2015/RPG_MWR_STD_Te
 chnical_Manual_2015.pdf

 17
You can also read