Signal Timing Optimization Program Pilot Project Northeast Ohio Areawide Coordinating Agency - STOP Pilot Project Update
←
→
Page content transcription
If your browser does not render page correctly, please read the page content below

Signal Timing Optimization Program Pilot Project
 Northeast Ohio Areawide Coordinating Agency

                                           The Mannik & Smith Group, Inc.
               STOP Pilot Project Update   Loukas Engineering, Limited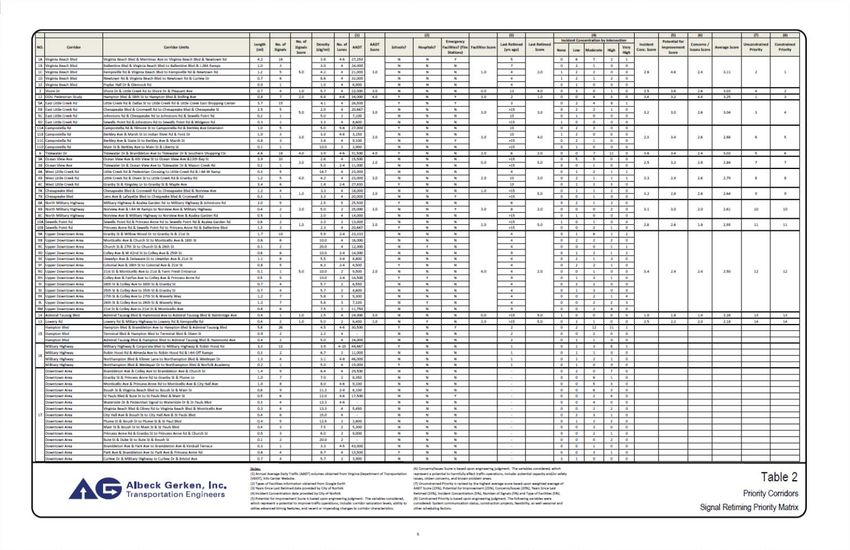
Agenda
Project Team
Project Overview
Short Term Recommendation ‐
Status
Performance Evaluation
Implementation – Lessons Learned
Future Program
Questions/Discussion
2
Project Team
Albeck Gerken, Inc.
Founded in 2000
Focus on signal timing deployment and arterial operations
The Mannik & Smith Group, Inc.
Local full service firm
60 years in Ohio engineering – 140 Ohio employees
Loukas Engineering, Limited
Local traffic data and consulting firm (DBE)
33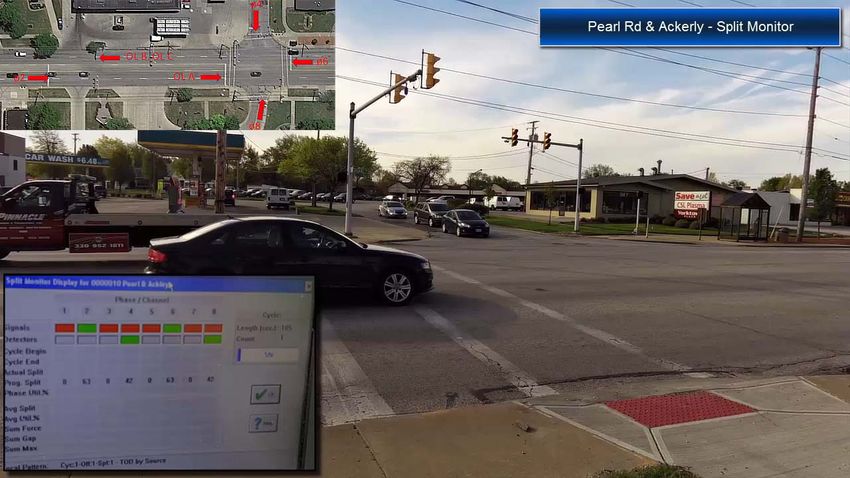
Project Overview  – Cedar Rd
               Cedar Road Corridor (29)

                                          4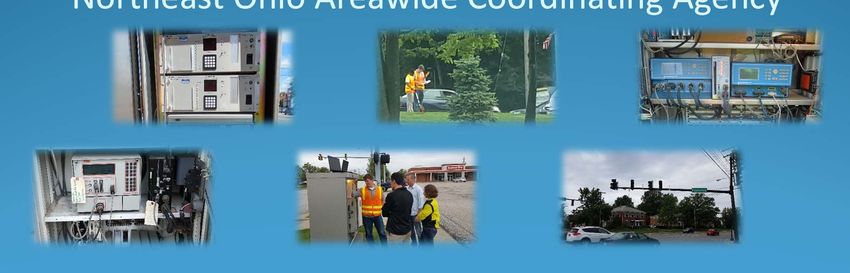
Project Overview  – Cedar Rd Equipment
               Cedar Road Corridor (29)
                                              Name                                                 Controller
                                              Cedar Rd & Lander Rd                                 Econolite ASC/2
                          Mayfield Heights
                                              Cedar Rd & Landerbrook Dr                            Econolite ASC/2
                                     ODOT     Cedar Rd & Brainard Rd                               Econolite ASC/2
                                              Cedar Rd & I‐271 On‐ramp                             Econolite ASC/2
                                              Cedar Rd & Acacia Park Dr                            Econolite ASC/2
                                              Cedar Rd & Pointe East Dr                            Econolite ASC/2
                                              Cedar Rd & David Myers Pkwy                          Econolite ASC/2
                                              Cedar Rd & George Zeiger Dr                          Econolite ASC/2
                               Beachwood
                                              George Zeiger Dr & Cleveland Clinic                  Econolite ASC/2
                                              Cedar Rd & Beachwood Place                           Econolite ASC/2
                                              Cedar Rd & Richmond Rd                               Econolite ASC/2
                                              Cedar Rd & Legacy Village                            Econolite ASC/2
                                              Cedar Rd & Halcyon Rd                                Econolite ASC/2
                                              Cedar Rd & S Green Rd                                McCain 170E
                                              Cedar Rd & Langerdale Rd‐Kerwin Rd                   McCain 170E
                                              Cedar Rd & S Belvoir Blvd                            McCain 170E
                                              Cedar Rd & Wrentford Rd                              McCain 170E
                                              Cedar Rd & Miramar Blvd                              McCain 170E
                                              Cedar Rd & University Square East                    McCain 170E
                                              Cedar Rd & University Square West                    Safetran 170E
                         University Heights   Cedar Rd & Warrensville Center Rd.                   DTS 170E
                                              Cedar Rd & Cedar Center East                         McCain 170E
                                              Cedar Rd & Cedar Center West                         TBD Brand 170E
                                              Cedar Rd & Fenwick Rd                                McCain 170E
                                              Warrensville Center Rd & Cedar Center                Safetran 170E
                                              Warrensville Center Rd & University Square           McCain 170E
                                              Warrensville Center Rd & Bushnell Rd                 Safetran 170E
                                              Warrensville Center Rd & Silsby Rd / Washington Bl   Safetran 170E
                              South Euclid    Warrensville Center Rd & Stanhope Rd / Okalona Rd    Safetran 170E
                                                                                                                     5
Project Overview – Cedar Rd Pictures

                                       6
Project Overview – Cedar Rd Videos

                                     7
Project Overview  – Road
               Pearl Pearl  Rd (20)
                         Corridor

                                      8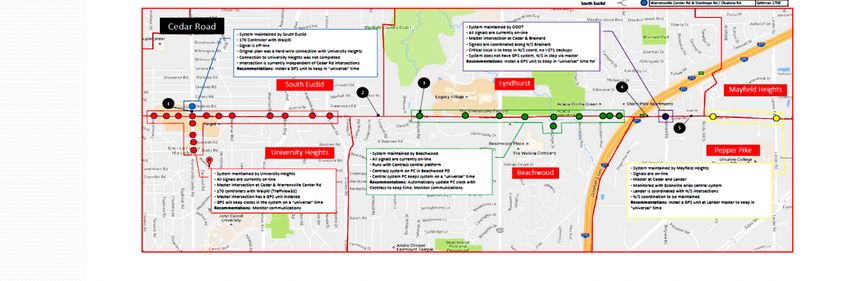
Project Overview  – Road
               Pearl Pearl  Rd Equipment
                         Corridor (20)

                                                    Name                                             Controller
                     City of Cleveland (excluded)   Pearl Rd (US 42) & Brookpark Rd                  Siemens M50
                                                    Pearl Rd (US 42) & Laverne Ave                   Transyt 1880EL
                                                    Pearl Rd (US 42) & Ridge Rd                      Econolite ASC/3
                                          Parma
                                                    Pearl Rd (US 42) & Parma Fire Station            Econolite ASC/2
                                                    Pearl Rd (US 42) & Snow Rd                       Econolite ASC/3
                                                    Pearl Rd (US 42) & Lotusdale Dr                  Peek 3000
                                                    Pearl Rd (US 42) & Reservoir Dr                  Peek 3000
                                                    Pearl Rd (US 42) & Pearl Road School             Peek 3000
                                                    Pearl Rd (US 42) & Parma Heights Fire Station    Peek 3000
                                                    Pearl Rd (US 42) & Ackley Rd                     Peek 3000
                                                    Pearl Rd (US 42) & Olde York Rd                  Peek 3000
                                                    Pearl Rd (US 42) & Greenbriar Plz Shopping Ctr   Peek 3000
                                  Parma Heights
                                                    Pearl Rd (US 42) & Stumph Rd                     Peek 3000
                                                    Pearl Rd (US 42) & Kingsdale Blvd                Peek 3000
                                                    Pearl Rd (US 42) & Rochelle Blvd                 Peek 3000
                                                    Pearl Rd (US 42) & Mandalay Dr                   Peek 3000
                                                    Pearl Rd (US 42) & Greenleaf Ave                 Peek 3000E
                                                    Pearl Rd (US 42) & Maplewood Rd/Fernhurst Ave    Peek 3000
                                                    Pearl Rd (US 42) & Lawnwood Ave                  Peek 3000
                             Middleburg Heights     Pearl Rd (US 42) & 130th St                      Econolite ASC/2

                                                                                                                  9
Project Overview – Pearl Rd Pictures

                                       1010
Project Overview – Pearl Rd Videos
1111Short Term Recommendations – Cedar Rd Status
• Since this recommendation, the master controller at Cedar Rd &
Warrensville Center Rd was hit by a vehicle and removed. The city has a
• Not critical to this project.
bid
•• It in to
does replace
appear this, however, thenot
contractorhasisdrifted
months away from
No action
Intersection isthat
as of yet. the central
However,
currently under server
will clock
be necessary
construction. from
until new universal
University
installing
time.
Heights this. controller
Allmaster
clocks will be equal, so this is not a critical issue. There are
is installed
•• times
The system
During ofour will become
dayobservations,
where unstable
the system during
have this
is coordinated
the clocks time, unless the
withHowever,
drifted. Brainard, somaster
not having a
constant
dramatically. is inFor
controllertime place.
sync If not,
would
instance, be the
the system
useful.
clocksAt will2time,
this
were degrade, but will
Brainard
to 4 seconds returnfrom
is under
different
aafter the system
construction.
universal time.and communications
In general, are back
they all drifted in place
equally (assame
in the long as the
implemented
direction. databases
However, are not changed).
any changes (such as a power outage at one
• The
intersection) will compile the clockhave
new master controller should drifta issue.
GPS clock unit, or
• communication back to complete
If possible and feasible, the central office (or
hardwire other formtoofUniversity
connection keeping the
clocks
Heightsonsystem.
a universal time). This is important for the interaction with
the
• signal in South
Not really Euclid. At this point, no cross coordination is
feasible
required between University Heights and Beachwood.
12Short Term Recommendations – Pearl Rd Status
• The city has a bid requestand
intofollow‐up,
their signal
• During
The cityimplementation
has installed this GPS clocks
unit at Pearl &
contractor.
appear to Atstaying
be last check,
in they had
universal not received the
time.
Snow Rd
bid. They plan to consult with their neighbor’s in
• GPS not required at this time for Pearl & Ridge
Parma regarding their installation. They may
request assistance on installing a unit from Parma.
13Performance Evaluation – Cedar Road Network Cedar Road from Fenwick Road to Lander Road
Warrensville Center Road from Stanhope Road/Okalona Road to Silsby Road/Washington Boulevard
Yes
AM Peak Existing Proposed Difference
Yes
Weekend
Total DelayAM
(hr)Peak Existing
588 Proposed
461 Difference
‐21.6%
TotalStops
Total Delay (hr) 276
37,112 225
33,328 ‐18.5%
‐10.2%
TotalTravel
Total Stops Time (hr) 24,715
1,045 22,082
918 ‐10.7%
‐12.2%
TotalConsumed
Fuel Travel Time (hr)
(gal) 607
1,238 555
1,127 ‐8.6%
‐9.0%
FuelPeak
MD Consumed (gal) 768
Existing 717
Proposed ‐6.6%
Difference
Yes
Yes
Weekend
Total DelayMD
(hr)Peak Existing
407 Proposed
330 Difference
‐18.9%
TotalStops
Total Delay (hr) 680
32,086 488
28,312 ‐28.2%
‐11.8%
TotalTravel
Total Stops Time (hr) 41,725
804 36,595
728 ‐12.3%
‐9.5%
Total Travel
Fuel ConsumedTime (hr)
(gal) 1,129
991 937
913 ‐17.0%
‐7.9%
FuelPeak
PM Consumed (gal) 1,311
Existing 1,141
Proposed ‐13.0%
Difference
Yes
Yes
Weekend
Total DelayPM
(hr)Peak Existing
848 Proposed
627 Difference
‐26.1%
TotalStops
Total Delay (hr) 199
45,192 181
41,310 ‐9.0%
‐8.6%
Total Stops Time (hr)
Total Travel 19,319
1,362 19,019
1,141 ‐1.6%
‐16.2%
TotalConsumed
Fuel Travel Time (hr)
(gal) 490
1,544 471
1,365 ‐3.9%
‐11.6%
FuelOff‐peak
PM Consumed (gal) 624
Existing 611
Proposed ‐2.1%
Difference
Yes
Total Delay (hr) 263 231 ‐12.2%
Total Stops 24,214 22,902 ‐5.4%
Total Travel Time (hr) 605 572 ‐5.5%
Fuel Consumed (gal) 764 736 ‐3.7%
14Westbound Eastbound
Weekend
PM
MD
AM
PMOff-peak
WeekendPeak
AM
MD Peak
Peak
Existing
Existing
Cumulative
Difference
Difference
Cumulative Travel
Travel Time
Time (sec)
(sec)
Cumulative
CumulativeTravel
TravelTime (sec)
Time(sec)
% Difference
% Difference
Implemented
Implemented
Cumulative Travel Time (sec)
200
400
600
800
200
400
600
800
200
400
600
0
Eastbound : Fenwick200
400
600
800
0000
400
600
800
Rd
0
400
600
800
Fenwick Rd
Westbound : Landerbrook
Fenwick
Fenwick
Fenwick
Fenwick Rd
Rd
Rd Rd
Fenwick Rd
Cedar
Cedar Center West
Center West
Cedar Center
Cedar West
Center
Cedar Center West West
Cedar Center West
568
509
668
575
Eastbound
Cedar Center East
-15.0%
-11.5%
Cedar
Cedar
Cedar
Cedar Center
Center
Center
Center East
EastEast
East
Cedar Center East
Travel Time (s)
Warrensville Center Rd
Eastbound
Warrensville
Warrensville Center
Warrensville Center
Center Rd
RdRd
200to Landerbrook Dr
-66
200 Dr to Fenwick Rd
Warrensville Center Rd
-100
AM Peak
University
UniversitySquare West
SquareWest
University
University Square
Square West
West
University Square West
84
162
262
150
University
UniversitySquare East
SquareEast
University
University Square
Square East
East
-38.2%
-44.0%
Average Total Travel Time & Delay
Delay (s)
University Square
Miramar
Miramar Blvd
BlvdEast
Miramar
Miramar Blvd
Miramar Blvd
Blvd
Miramar Blvd
Wrenford
WrenfordRd
Rd
634
544
665
584
Wrenford
Wrenford Rd
Wrenford
Rd Rd -7.9%
-18.2%
Wrenford Rd
Belvoir
BelvoirBlvd
Blvd
Travel Time (s)
Belvoir
Belvoir
Belvoir Blvd
Blvd
Blvd
Belvoir Blvd
-50
-121
MD Peak
Kerwin
Kerwin
Kerwin Rd/
Rd/
Rd/
Kerwin Rd/
Kerwin Rd/
Langerdale
Langerdale
Langerdale Rd
Kerwin
Rd Rd/
Rd
Langerdale
Langerdale Rd Rd
119
178
228
240
Langerdale Rd
-21.9%
-50.4%
Green RdRd
Delay (s)
SSSSGreen
Green
SGreenRd
GreenRd Rd
S Green Rd
607
628
706
762
-11.0%
-20.3%
Travel Time (s)
-78
-155
PM Peak
Halcyon Rd
223
301
183
337
Halcyon
Halcyon
Halcyon Rd
Rd
Halcyon Rd
Rd
-25.9%
-46.0%
Halcyon Rd
Delay (s)
Legacy Village
559
632
537
634
Legacy
Legacy
Legacy Village
Village
Village
Legacy Village
-11.6%
-15.3%
Legacy Village
Performance Evaluation – Cedar Rd Travel Time
Travel Time (s)
-73
-97
Richmond
Richmond
Richmond
Richmond Rd
Rd
Rd
Rd
Richmond Rd
PM Off-peak
Richmond Rd
153
226
112
209
-32.3%
-46.4%
Beachwood
Beachwood Place
Place
Delay (s)
Beachwood Place
Beachwood Place
Beachwood Place
George
George
George Zeiger
Zeiger
Zeiger
George Dr
Zeiger
DrDrDr
George Zeiger Dr
526
556
532
581
-5.4%
-8.4%
Travel Time (s)
David
David
David Myers
Myers
Myers
David Pkwy
Pkwy
Pkwy
Myers Pkwy
David Myers Pkwy
-30
-49
Point
Point
Point East
East
East
Point Dr
East
DrDrDr
Weekend AM Peak
Acacia
Acacia Point
Park
Park East
Acacia Park Dr
120
107
151
156
Acacia Park
DrDrDrDr
Acacia Park Dr
-19.9%
-31.4%
Delay (s)
I-271
I-271
I-271 SB
I-271 SB
SBSB On-ramp
On-ramp
On-ramp
On-ramp
I-271 SB On-ramp
602
572
738
674
-22.5%
-10.7%
Brainard
Brainard
Brainard Rd
Rd
BrainardRd
Rd
Brainard Rd
Travel Time (s)
-72
-166
Weekend MD Peak
Westbound
178
166
332
250
15
Landerbrook
Landerbrook
Westbound
Landerbrook Dr
-50.0%
-28.8%
Landerbrook
DrDrDr
Delay (s)
Landerbrook Dr
Cedar Rd: 3.6 milesPerformance Evaluation – Pearl Road Network Pearl Road from West 130th Street to Laverne Avenue
Yes
AM Peak Existing Proposed Difference
Total Delay (hr) 187 184 ‐1.6%
Total Stops 14,984 16,171 7.9%
Total Travel Time (hr) 526 523 ‐0.6%
Fuel Consumed (gal) 600 603 0.5%
Yes
MD Peak Existing Proposed Difference
Total Delay (hr) 144 138 ‐4.2%
Total Stops 14,438 14,531 0.6%
Total Travel Time (hr) 466 460 ‐1.3%
Fuel Consumed (gal) 541 537 ‐0.7%
Yes
PM Peak Existing Proposed Difference
Total Delay (hr) 299 278 ‐7.0%
Total Stops 18,924 19,320 2.1%
Total Travel Time (hr) 730 708 ‐3.0%
Fuel Consumed (gal) 807 792 ‐1.9%
Yes
PM Off‐peak Existing Proposed Difference
Total Delay (hr) 136 130 ‐4.4%
Total Stops 13,287 14,188 6.8%
Total Travel Time (hr) 453 446 ‐1.5%
Fuel Consumed (gal) 527 525 ‐0.4%
16PMMD
PM AM Peak
Peak
Off-peak
Westbound Eastbound
Cumulative
Cumulative Travel
Travel Time
Time (sec)
(sec)
Cumulative
Cumulative
Travel
Travel
Time
Time
(sec)
(sec)
Existing
100
Existing200
300
400
500
Eastbound100
200
300
400
00
00
100
200
200
300
300
400
400
500
500
Difference
Difference
W St
W
W 130th
130th St
StW130th
130th St
% Difference
% Difference
Implemented
Implemented
Eastbound
Eastbound
LawnwoodLawnwood
Ave Ave
Lawnwood Lawnwood
Ave Ave
Eastbound
Maplewood
Maplewood
Maplewood Rd/ Rd/
Rd/
Maplewood Rd/
Fernhurst
Fernhurst
Ave Ave
Ave
Fernhurst
FernhurstAve
416
434
420
466
-9.9%
-4.1%
:100W 130th St to Snow Rd
Westbound : Snow Rd to W 130th St
GreenleafGreenleaf
Greenleaf Ave
Greenleaf
Ave Ave
Ave
Travel Time (s)
-18
-46
AM Peak
MandalayMandalay
Mandalay Dr
Mandalay
Dr Dr
Dr
50
59
77
96
-47.9%
-23.4%
Average Total Travel Time & Delay
Delay (s)
Rochelle Blvd
Rochelle Rochelle
RochelleBlvd
Blvd Blvd
389
418
428
465
-2.3%
-16.3%
Blvd
Travel Time (s)
KingsdaleKingsdale
Kingsdale Kingsdale
Blvd Blvd
Blvd
-10
-76
MD Peak
York Rd/Stumph
York
York Rd/Stumph Rd
YorkRd/Stumph
Rd/Stumph
Rd Rd
Rd
61
71
19
95
-80.0%
-14.1%
Delay (s)
Greenbriar
Greenbriar
Center Center
Greenbriar
Greenbriar Center Center
Olde YorkOlde
Olde York Rd York
Olde
Rd YorkRd
Rd
Performance Evaluation – Pearl Rd Travel Time
Ackley RdAckley
Ackley Rd AckleyRdRd
409
445
401
496
Parma
-8.1%
Parma Heights
-19.2%
ParmaHeights
Heights Heights
Fire Fire
FireStation
Fire Station
Station Station
Travel Time (s)
Pearl RdPearl
Pearl Rd PearlRd
Rd
-36
-95
Elementary
Elementary
School School
Elementary
Elementary School School
PM Peak
52
87
31
126
-41.4%
-75.4%
Delay (s)
Dr
Reservoir
ReservoirReservoir
Reservoir Dr Dr
Dr
396
406
381
433
-2.5%
-12.0%
Travel Time (s)
Dr
Lotusdale
LotusdaleLotusdale
Lotusdale Dr Dr
Dr
-10
-52
PM Off-peak
39
49
11
63
-82.5%
-20.4%
Delay (s)
Westbound
Pearl Rd: 2.8 miles
Westbound
Westbound
17
Snow RdSnow
Snow Rd Rd
SnowRdImplementation ‐ Lessons Learned
Ensure project information makes it to the appropriate
individual(s) at the agencies
Advanced System Operation is not always the best choice
Work with the local agencies
Agencies were very responsive and helpful during
implementation
18Future Program
19Questions
Safety & Operations Council
             May 19, 2017
Action Requested No action is requested. This item is being presented for information and input from the Safety and Operations Council. Previous Action None
Background Signal Timing – Air Quality Benefits Poor signal timing negatively impacts air quality Low-cost investments can help reduce delay and improve air quality
Background In FY2017, NOACA implemented a pilot STOP Two corridors were selected with input from the SOC Preliminary results for the pilot project are positive Reduced travel time Reduced travel time variability Continuing program for FY 2018
Corridor evaluation framework
Began with most congested corridors
Corridor congestion filter
Volume-Capacity Ratio at least 1.0Corridor Evaluation
Corridor segmentation
Number of signals
Between 4-30
Signals per mile
At least 4.0
Evaluation Criteria
Volume Capacity Ratio
Average daily traffic
Average daily truck traffic
Total miles of congested roadway
Percentage of the corridor that is congested
Signals per mileTotal # of Length % Composite Corridor Length Signals VCR Rank Signals/Mile Rank ADT Rank ADTT Rank Congested Rank Congested Rank Rank Mayfield Rd 0.95 8 1.53 14 8.42 9 29740 14 2090 7 0.84 21 88% 4 69 271 EB ramp to Hill Dr State Route 83 0.53 4 1.58 14 7.55 16 30750 9 1650 14 0.53 29 100% 1 83 Detroit Rd to Chester State Route 57 1.87 8 1.79 8 4.28 69 46260 1 2450 4 1.25 9 67% 10 101 SR 113 to Beechwood Pearl Rd 3.67 20 1.44 18 5.45 43 25630 20 1730 12 2.1 2 57% 14 109 Royalton Rd to Webster Rd E 9th St 1.01 12 2.1 4 11.88 1 29879 13 605 52 0.57 27 56% 15 112 Carnegie Ave to Erieside Dr SOM Center Rd 0.78 6 1.44 18 7.69 13 28460 18 1920 9 0.39 38 50% 17 113 Aurora Rd to US 422 WB ramps Bagley Rd 2.54 17 1.73 9 6.69 23 34011 5 2828 2 0.37 39 15% 41 119 Lindbergh to 71 NB ramp Tiedeman Rd 1.65 10 1.25 32 6.06 31 23470 23 1600 15 1.11 12 67% 10 123 Brookpard Rd to Memphis E 55th St 1.51 12 1.79 8 7.95 11 19307 35 1400 22 0.57 27 38% 24 127 Francis Ave to Cedar Ave W 130th St 3.36 19 1.34 24 5.65 38 24968 22 983 38 2.67 1 79% 6 129 Plaza Dr to West Ave Chagrin Blvd 2.2 13 1.45 17 5.91 34 32390 7 2090 7 0.49 32 22% 35 132 Green Rd to Belmont Rd SOM Center Rd 3.25 14 2.47 2 4.31 68 29910 12 1440 20 1.31 8 40% 23 133 Timberline to Vine W 150th St/Warren 4.29 20 1.35 23 4.66 61 22165 26 2803 3 1.87 4 44% 20 137 Brookpark Rd to Madison Ave Pearl Rd/W 25th 4.22 29 1.36 22 6.87 22 18820 36 1190 32 1.58 6 37% 25 143 Brookpark Rd to 90 EB ramp Chester Ave 0.84 7 1.37 21 8.33 10 26570 19 1790 10 0.22 52 26% 31 143 E 13th St to E 30th St
Corridor Prioritization
Emission Reduction
Other Considerations
Potential for travel time improvements
How recently the signals were timed
Presence of coordination technology
Actual travel time
Corridor spanning multiple jurisdictions
Presence of transit facilities
If arterial is alternate route for interstates & highways
Council input
Relative importance of criteria
Other factorsNext Steps NOACA will incorporate Council input into the corridor selection process and prioritize projects accordingly
NOACA will STRENGTHEN regional
cohesion, PRESERVE existing
infrastructure, and BUILD a sustainable
multimodal transportation system to
SUPPORT economic development and
ENHANCE quality of life in Northeast Ohio.
Abbreviated HSIP Applications
PURPOSE
Crashes by Jurisdiction
Home Rule State
• Local Roads – 70% of crashes, 54% deaths, 62% SI
ELIGIBLE PROJECTS
Non-Complex Projects:
Short Timeline
Near-ready for Construction
Funding for Construction
Proven Countermeasures
Under $500,000
Project should be located on a
safety priority listODOT MAPS/LISTS
http://www.dot.state.oh.us/Divisions/Planning/ProgramManagement/HighwaySafety/HSIP/Pages/MapRo
om.aspxSafety Analyst Priority Lists
County Road High Crash Location
Maps
Application Components
Location
Cost
Construction Year
Description of the Project
Priority
Crash Patternscory.hopwood@dot.state.ohi
o.us
614.387.0112Safety and Operations Advisory Council
May 19, 2017
5-1Action Requested
No action is being requested at this time.
This item is presented for information only.
Previous Action
None
5-1Background
Purpose of CMAQ program
Advance transportation projects or programs that will
contribute to attainment or maintenance of the National
Ambient Air Quality Standards (NAAQS) for Ozone (O3),
Carbon Monoxide (CO), and Particulate Matter (both PM10
and PM2.5).
Goals
Improve Air Quality
Relieve Congestion
5-1Background
Program Administration
November, 2012 – ODOT directed the creation of a
statewide CMAQ program
Reduce amount of unspent program balances
Advance projects of statewide significance
Developed and coordinated through OARC amongst
the eight large MPOs
Cleveland, Akron, Canton, Cincinnati, Columbus, Dayton,
5-1
Toledo, and YoungstownBackground
NOACA announced solicitation of application at
March 10th Board of Directors meeting
Applications accepted March 24 - May 5, 2017
Approximately $38 million available targeted for
SFYs 2022-2023
Provides eligible project costs associated with:
Non-infrastructure activities and operating costs
Preliminary development, detailed design, right
of way acquisition, and construction costs for
5-1 infrastructure type projectsStatewide CMAQ Funding
Eligible Applicants
Qualified government entities,
including local governments, regional
transit agencies, port authorities, and
state agencies
Projects may also be implemented
through a Public Private Partnership
5-1Statewide CMAQ Funding
Eligible Project Types
Regional Rideshare/Vanpool Programs Bicycle/Pedestrian
Congestion Reduction, Traffic Flow Alternative Fuels and Vehicles - Non-
Improvements & Intelligent transit
Transportation Systems Employer-based programs
Transit Vehicle Replacement Travel Demand Management
Freight/Intermodal including diesel Modal subsidies and vouchers
engine retrofits Transit Facility Upgrades
Public Education and Outreach Other Transportation Control Measures
Transit Service Upgrades
5-1Project Evaluation Criteria
100 Total Points
1. Project Type (10):
Recognized project types with proven emissions reducing benefits
2. Cost Effectiveness (20);
Project’s ability to reduce emissions per CMAQ dollar invested
3. Other Benefits (10):
Benefits Safety, Freight, Fixed Route Transit, Bike/Ped, and EJ Areas
4. Existing Modal Quality of Service (LOS/QOS) (15):
Existing level of service facility currently operating
5. Positive Impact on QOS/LOS (15)
5-1 Projected level of service facility will operate at post projectProject Evaluation Criteria
100 Total Points
6. Status of Project (10):
Project readiness, status of project development
7. Non‐Federal Match of Requested CMAQ Funds (10):
Significance of non-CMAQ funding contribution
8. Regional Priority (10):
MPO priority points given up to four project submittals at
10,7,4, and 2
9. Past Project Delivery (-10):
Past delivery performance of the project sponsor
5-1Statewide CMAQ Funding
Program Timeline
DATE ACTIVITY
March 24, 2017 Project Solicitation Begins
April 13, 2017 CMAQ Applicant Workshop @ NOACA
May 5, 2017 Applications Due to NOACA by 4pm
NOACA and Statewide Committee Review
May 19, 2017 BPAC + SOC application review
June 15, 2017 Air Quality and Transportation Subcommittees review and input
July 14, 2017 Planning and Programming Committee Recommendation of
Priority Projects
September 8 Board Action on Priority Projects
October 2017 Statewide CMAQ Committee Evaluation and Project Funding
5-1 Recommendation2017 Statewide Congestion Mitigation and Air Quality Program Applications - NOACA
CMAQ Funds
County Sponsor Agency Project Name and Description Project Type Total Cost
Request
CUY Cleveland Metroparks Euclid Greenway 0.5 mile 10' paved trail Bike/Ped Facilities $ 628,500 $ 499,650
CUY Cleveland Lorain Avenue Cycle Track Bike/Ped Facilities $ 8,376,930 $ 6,118,792
Midway Cycle Track – A Phased Approach to Implementing the
CUY Cleveland Bike/Ped Facilities $ 16,736,354 $ 13,389,082
Network
CUY Parma West Creek Greenway Trail Bike/Ped Facilities $ 5,503,650 $ 4,402,920
Lorain County Metro
LOR Black River Trail Extension Ph. 3C Bike/Ped Facilities $ 1,495,200 $ 1,051,960
Parks
Lorain County Metro
LOR Black River Trail Extension Ph. 4C Bike/Ped Facilities $ 2,194,456 $ 1,632,364
Parks
Washington Avenue Bikeway: 14,437' (2.73 miles) of on road bicycle
LOR Lorain Bike/Ped Facilities $ 224,015 $ 179,213
facilities connecting Lorain High School to US 6/Colarado Blvd.
Bike/Ped, Roadway,
CUY Cleveland Detroit Avenue Streetscape Extension $ 726,000 $ 605,000
Transit
Bike/Ped, Roadway,
CUY Cleveland E. 140th Streetscape $ 1,659,960 $ 1,320,000
Transit
Bike/Ped, Roadway,
CUY Cleveland E. 105th E. 93rd Transportation Corridor $ 50,854,400 $ 40,832,000
Transit
CUY Cle-Cuy County Port Cleveland Bulk Terminal Tunnel Extension Project Freight/Intermodal $ 5,900,000 $ 4,720,000
Roadway
CUY Mayfield Hts. Lander Road Roundabout $ 1,719,829 $ 1,138,261
Improvmnt2017 Statewide Congestion Mitigation and Air Quality Program Applications - NOACA
Sponsor CMAQ Funds
County Project Name and Description Project Type Total Cost
Agency Request
CUY Beachwood Citywide Traffic Signal System Upgrade Signals $ 5,379,100 $ 3,185,113
CUY Broadview Hts. SR 82 Traffic Signals Signals $ 869,573 $ 513,048
CUY Cleveland Hts. Signal Replacement Ph 1 Signals $ 3,620,750 $ 2,551,160
CUY Mayfield Hts. Mayfield Road Corridor Traffic Signal Safety Upgrade & ITS Project Signals $ 3,377,906 $ 2,495,285
CUY Rocky River Center Ridge Cellular Signal Control and Pavement Markings Signals $ 654,652 $ 380,889
CUY Strongsville SR 82 & US 42 Traffic Signal Upgrade & ITS Project Signals $ 4,654,832 $ 2,559,619
CUY University Hts. Citywide Traffic Signal Update Signals $ 3,200,700 $ 2,328,560
LAK Painesville SR 283 & US 20 Signal System Upgrade Signals $ 845,000 $ 667,200
LAK Willoughby SR 84 Signal Upgrade and Coordination Signals $ 440,000 $ 352,000
LOR Lorain Traffic Signals Upgrade Project - Ph. 1 Signals $ 4,498,100 $ 4,273,195
GCRTA 2021 - 2023 Bus Improvement Program: Replace 96 total vehicles (16) Transit Vehicle
CUY GCRTA $ 59,480,500 $ 37,615,085
45' commuter vehicles, (63) 40' cng vehicles, (17) 60' diesel/cng vehicles Replacement
LAKETRAN 2018-23 Vehicles Replace 95 total vehicles (74) light transit Transit Vehicle
LAK LAKETRAN $ 24,231,546 $ 19,385,237
vehicles, (6) 40' over the road coaches, (15) 35' low floor transit vehicles Replacement
Total $ 207,271,953 $152,195,633Statewide CMAQ Funding
Contact Information
Program guidance can be found at:
http://noaca.org/index.aspx?page=4430
NOACA Staff Contact:
Jim Thompson
Jthompson@mpo.noaca.org
216.241.2414 x 275
5-1Next Steps
Staff will evaluate applications and present
recommendations to the Air Quality
Subcommittee and Transportation
Subcommittee at their June 2017 meetings
5-1NOACA will STRENGTHEN regional cohesion, PRESERVE existing infrastructure, and BUILD a sustainable multimodal transportation system to SUPPORT economic development and ENHANCE quality of life in Northeast Ohio.
You can also read