Solar supergranular fractal dimension dependence on the Solar cycle phase - arXiv
←
→
Page content transcription
If your browser does not render page correctly, please read the page content below
Solar supergranular fractal dimension
                                                      dependence on the Solar cycle phase
arXiv:2202.00447v1 [astro-ph.SR] 1 Feb 2022

                                                          Rajani G1, Sowmya G M2 , U Paniveni3,4, R. Srikanth4
                                                     1
                                                       PES College of Engineering, Mandya-571401,Karnataka,India.
                                               2
                                                   GSSS Institute of Engineering and Technology for Women, KRS Road,
                                                               Metagalli Mysuru-570016, Karnataka, India.
                                                       3
                                                         Bangalore University, Jnanabharathi, Bengaluru – 560056.
                                                       4
                                                         Poornaprajna Institute of Scientific Research, Devanahalli,
                                                                   Bangalore-562110, Karnataka, India.

                                                                                  Abstract
                                                        We study the complexity of the supergranular network through
                                                    fractal dimension by using Ca II K digitized data archive obtained
                                                    from Kodaikanal solar observatory. The data consists of 326 visually
                                                    selected supergranular cells spread across the 23rd solar cycle. Only
                                                    cells that were well-defined were chosen for the analysis and we discuss
                                                    the potential selection effect thereof, mainly that it favors cells of a
                                                    smaller size (< 20 Mm). Within this sample, we analyzed the fractal
                                                    dimension of supergranules across the Solar cycle and find that it is
                                                    anticorrelated with the activity level.

                                                Keywords : Sun: photosphere, Sun : granulation, stars: activity, Sun :
                                              magnetic fields

                                              1     INTRODUCTION
                                              Solar convection occurs over a continuum of scales, mainly around 1 Mm, cor-
                                              responding to granulation, and around 30 Mm, corresponding to supergran-
                                              ulation (Hathaway et al., 2000; Rieutord and Rincon, 2010). Meunier et al.
                                              (2007) show a low-level intensity contrast and infer a corresponding temper-
                                              ature difference of 0.8K-2.8 K between the center of the cells and boundaries,
                                              indicative of a convective origin of supergranulation. As regards the spread in
                                              scale, the kinetic energy spectrum having a distinct peak at wavelengths of ∼

                                                                                       1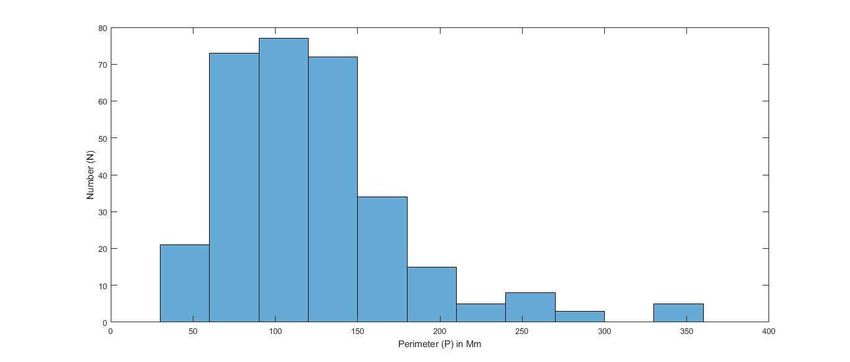
35 Mm consists of cells at least three times larger and extends to much smaller
cells of scales traditionally associated with granulation(Hathaway et al., 2000).
    However, depending on the method chosen, other comparable scales for
the latter have been reported. For example, Rieutord et al. (2008) find su-
pergranulation spectrally extending between scales 20 Mm and 75 Mm, while
peaking at 36 Mm. Chatterjee et al. (2017), using data from the Kodaikanal
Solar Observatory1 (KSO) similar to the one used in this study, report an
average scale in the range of 22–28 Mm. Using Dopplergrams obtained from
SOHO mission and Ca-K filter-grams,(Srikanth et al., 1999) using a tessella-
tion technique report a supergranular mean scale of 25 Mm, with the kurtosis
and skewness of the supergranular scale distribution being 4.6 and 1.1 respec-
tively, in agreement with values derived by other methods (reported in the
above paper).
    Interestingly, in contrast to the above estimates for cell size, (Parnell et al.,
2009) have obtained a characteristic cell diameter in the range 13-18 Mm, al-
most half the traditional cell sizes quoted above, by following the boundaries
of individual cells using a method of tesselating the Solar surface. Here, we
may also note that (De Rosa et al., 2000) and (DeRosa and Toomre, 2004),
using local correlation tracking, derived a rather small diameter in the range
12-20 Mm. Also, the average cell size is 17.06 Mm at cycle minimum and
16.11 at cycle maximum as observed by (Meunier et al., 2008) using the
granule tracking method.
    The cycle dependence remarked above is in agreement with the result
of (Singh and Bappu, 1981), who showed that size of the cells are smaller
by about 5% during the active phase of the solar cycle in comparison to
that at the quiet phase. This is consistent with the idea that network
magnetic elements having a shrinking effect on supergranules, as hinted by
(Meunier et al., 2008). However, a difference in supergranular scales for ac-
tive and quiet regions of the Sun, the former being about 1.5 Mm larger,
has been noted (Mandal et al., 2017). It is possible that some of the dis-
crepancy in the reported data about supergranular scales and their prop-
erties is due to a potential bias in studies based on tracers such as Ca II
K for indicating supergranulation (Rincon and Rieutord, 2018). A latitude-
dependence of supergranular scales, with a variation as large as 7%, has been
noted(Raju et al., 1998). Supergranules are generally known to live for about
30 hours or more., with larger cells living longer (Hirzberger et al., 2008).
    Supergranulation has dynamical interactions with the magnetic fields of
the quiet sun and most notably, supergranules are strongly correlated with
the magnetic network (Rieutord and Rincon, 2010). Solar supergranular con-
  1
      https://kso.iiap.res.in

                                         2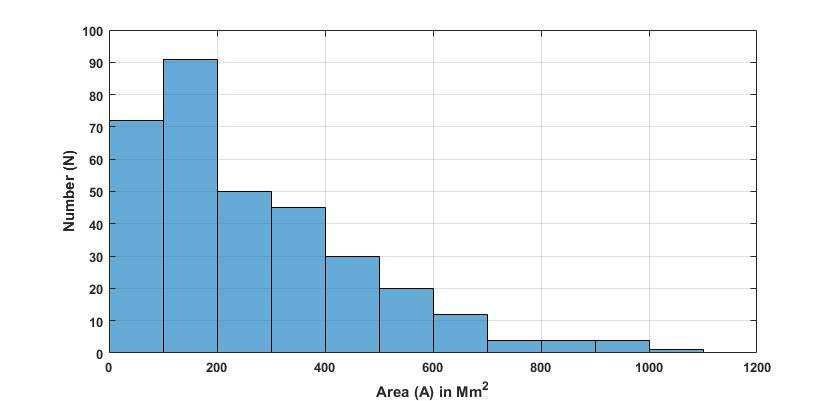
vection is understood to play a major role in the global and local structura-
tion and dynamics of solar magnetic fields at the interface between the solar
interior and corona (Rincon and Rieutord, 2018).
    Fractal dimension analysis is a powerful mathematical tool to analyze
the shape complexity of geometrical structures, by quantifying the degree of
self-similarity of a set Cannon (1984). The fractal dimension of the super-
granulation can give an indication of the turbulence in the Solar magneto-
convection. A fractal dimension D = 1 (resp., D > 1) indicates cells that
are regular (resp., more frazzled and hence space-filling).
    Fractal analysis in the context of a solar surface phenomenon was by
Muller et al. (1987) who reported a fractal dimension D = 1.25 for smaller
granules and D ≈ 2 for larger ones. Paniveni et al. (2005) obtained a fractal
dimension of about D = 1.24 for supergranules found in the SOHO doppler-
grams, which is closer to the dimension for smaller granules. Building on the
latter result, (Paniveni et al., 2011; Paniveni, 2015) studied the turbulence
in Solar magneto-convection.
    By Kolmogorov hypothesis in the context of a turbulent convection, the
horizontal velocity Vh of a convective cell varies with scale L as Vh ∝ L1/3
(Krishan et al., 2002). A direct relation between cell fractal dimension and
magnetic activity was reported by Nesme-Ribes et al. (1996), and similarly
by (Meunier, 1999) using both full disk and high-resolution MDI magne-
tograms.
    While fractal dimension of active region supergranulation is consistently
lower than that of quiet region supergranulation as reported by Chatterjee et al.
(2017), the latter cells can have higher fractal dimension during the active
phase of the Solar cycle, and the former cells contrariwise. It would appear
that the full interplay of global features such as magnetic activity and Solar
cycle phase with the supergranular outflow must be borne in mind to fully
unravel the behavior of fractal dimension, scale or any other cell parameter.
    Here, a pertinent question would be whether cell scale has a role in af-
fecting its fractal dimension across the Solar cycle, which is addressed in part
in this work. To this end, we have adopted the method of cell study used
by (Paniveni et al., 2005), which is preferential towards smaller cells. Our
analysis, restricted to the quiet region, suggests that while the cross-cycle be-
haviour remains qualitatively the same, smaller cells have larger than average
fractal dimension.

                                      3
2 DATA and ANALYSIS
The 23rd solar cycle (1996-2008) at the Kodaikanal Solar Observatory has
been used for this analysis. The Kodaikanal solar tower dual telescope houses
a K-line spectroheliograph which is a 2-prism instrument along with 7Å /mm
spectral dispersion near 3930Å. It works with a 60 mm image formed from a
30 cm Cooke photovisual triplet. A Foucault siderostat with 46 cm diameter
reflects sunlight onto the 30 cm lens. Exit slits are centered at K 232 admits
0.5 A. By using the Photo digitizing system, the images are digitized in
terms of strips which are running parallel to the equator. The resolution
of the patterns obtained are of 2 arcsec which is two times the granular
scale. Further, the data is time averaged over an interval of 10 min which is
double the 5 min period of oscillation. The signal due to granular velocity is
largely averaged out by time averaging and spatial resolution. Similarly, the
contributions to p-mode vibrations are minimized after time averaging.
Cycle 23 lasted during the period August 1996 – December 2008. The
degree of activity determines the level of dispersal of magnetic fields, which
is expected to influence properties of the cell network, in particular to lower
the fractal dimension in quiet regions. Ideally, we expect a continuous tran-
sition of this property across the cycle. For our data, this behavior can be
broadly captured by dividing the cycle into three phases– peak, minimum
and intermediate. The maximum or peak phase is identified with the period
2000–2002, during which large sunspots as well as other manifestations of
activity, such as coronal mass ejections and Solar flares, are found to occur.
The minimum phase is identified with the periods 1996–1997 and 2005–2007
during which such magnetic activity is minimal. The intermediate phase is
identified with the intervening ascending and descending phases of the solar
cycle. The threefold division here is a reasonably robust tradeoff between
statistical significance of a phase period and the number of phase periods
across the cycle.
An initial selection of frames suitable to estimate the Area and Perime-
ter of supergranular cells are made. Regions in the quiet Sun, where the
supergranules appear to be well pronounced, are delineated by visual in-
spection. Out of these regions, we selected well defined supergranular cells
between 15◦ < θ < 30◦ , θ being the angular distance of the cell from the disc
centre. Cells below the lower limit show diminished supergranular flow sig-
nature. The upper limit is chosen to keep the foreshortening effect low. The
quiet region cells were individually selected, extracted and studied as shown
in Fig 1. in a manner similar to that applied to a study of dopplergrams
(Paniveni et al., 2004, 2010).
4(a) Full disk Ca II K filtergram (b) Close-up of selected region
Figure 1: Data and cell selection: (a) A full disk Ca II K filtergram data of
Kodaikanal Solar observatory where supergranules with well-defined bound-
aries are encircled. (b) Closeup of a selected region, where the circles enclose
cells that are well-defined, and hence suitable for inclusion in this study,
whilst the rectangles enclose cells that aren’t so, and hence rejected.
5The steps involved in detecting and extracting the supergranules from
KSO intensity images are as follows. A typical full disk image that is the
basis of our data is shown in Fig. 1(a), where a few potential cells for our
analysis are encircled. In Fig. 1(b), we indicate supergranular cell that are
eventually selected by a circle, and those that are eventually rejected by
square enclosures.
Cell selection is based on the requirement that the cells are well accentu-
ated. Those so obtained are used to determine the area and perimeter for a
given cell, and hence the spectrum for all selected supergranules. The area-
perimeter relation is used to derive the fractal dimension (Paniveni et al.,
2005). We analysed 326 reasonably well-defined cells identified in the quiet
region, which is characterized by a low sunspot number, less solar irradiance
and flare emissions hence by a weak magnetic field.
The profile of the visually identified cell was scanned transversely over
the whole length: typically, we choose a fiducial y-direction on the cell and
perform intensity profile scans along the x-direction for all the pixel positions
on the y-axis (Fig. 2). In each scan, the cell extent is taken as the sum of the
distance between the two consecutive, expected peaks in the intensitygram.
The sum of these values at all y-levels multiplied by the pixel dimension
gives the area of the cell. Interactive data Language (IDL) is used for data
visualization and analysis to derive area, perimeter and other parameters of
the selected supergranular cell using this data.
This may be contrasted by other methods employed to study supergran-
ulation, some even of the present authors in their previous works, such as
cross-correlation, tessellation, etc, which are typically automated and allow
handling large regions of supergranulation at once. The manual method we
opt for here is thus biased towards cells are well defined in a qualitative sense,
implying a rejection rate by area of about 45 . Later we discuss potential ef-
fects of this selective analysis, and argue that it is consistent with our fractal
analysis.
Since the cell wall is formed by a heating of the overlying plasma by
the magnetic flux swept by the supergranular convective flow, larger cells
typically show more fluctuations and discontinuities in the cell wall. Thus,
our requirement for well defined cells creates a selection effect towards cells
that are smaller than the size scales obtained by other methods, about which
we discuss later.
6Figure 2: Intensity profile of a selected cell in Ca II K filtergram (inset):
the width of the cell at this longitudinal location is the distance between
the two peaks, representing the cell walls. The cell size is derived using the
full set of such transverse scans across the cell. (Note: For convenience of
display in terms of contrasting peaks and valleys in the intensity topography,
the intensity values are mean-shifted, so that those smaller than the mean
intensity are negative-valued.)
7Figure 3: Histogram for the area of supergranular cells of the present data
set. All cells belong to the 23rd Solar cycle based on the KSO data.
3 RESULTS
The basic statistical parameters concerning the maximum, mean, standard
deviation for supergranular cell of area A and perimeter P for the 23rd solar
cycle (1996–2007) are 1082, 269 and 199.7± 11 for Area in Mm2 , and 357,
98.9 and 46.2± 2.5 for perimeter in Mm respectively. A histogram of the
area and perimeter data is given in Figures 3 and 4, respectively.
Skewness of a distribution is a measure of its asymmetry, and may be
either a positive value, negative value or zero corresponding to a right-
skewed, left-skewed or symmetric distribution (Paniveni et al., 2005)). For
our present data, the skewness obtained is 1.2 for the area distribution, and
0.8 for Perimeter, indicating asymmetry with a bias towards larger values.
Kurtosis quantifies the clustering of distribution towards the center relative
to the tails, and thus gives a measure of how peaked a distribution is. For
our data, the values of kurtosis obtained are 1.4 and 0.6 for the area and
perimeter distributions.
The fractal dimension is generally found to be greater than 1, indicating
that the boundary of the cell is not smooth but craggy, causing greater
boundary length to enclose the same area. The degree to which the fractal
dimension exceeds 1 is a measure of how rugged the cell boundary is. The
data on area and perimeter of the cells are plotted in Figures . The linearity
in the log-log relation is quite apparent, indicating a power-law relation.
Fig. 5 is then used to read-off the fractal dimension D (Hausdorff dimension)
of the solar convection cells according to the relationship:
P = cAD/2 , (1)
8Figure 4: Histogram for the perimeter of supergranular cells of the present
data set. All cells belong to the 23rd Solar cycle based on the KSO data.
Cycle phases Fractal dimension Goodness of fit
Minimum 1.47 ± 0.02 0.99
Intermediate 1.3 ± 0.01 0.98
Peak 1.2± 0.01 0.99
Table 1: Fractal dimension with different phases of the Solar activity cycle.
where P is perimeter, C is constant, A is Area of the cell and D is fractal
dimension.
In our data, the area and perimeter are quite well correlated, with an
average correlation coefficient of 0.99. Fractal dimension D is calculated as
2 × slope and is found to be 1.2± 0.06 using Eq. (1).
Our results are comparable to that reported by Paniveni et al. (2005) for
the supergranular fractal dimension with the SOHO dopplergram data. The
slight difference of about 4% can be attributed to the differences in the data
used in that study (SoHO instead of KSO) and the differing time-frames in
the two studies.
Our main results are summarized in Table 1. This shows that the fractal
dimension of supergranular cells varies with respect to different phases across
the solar cycle. In particular, there is a marked trend for the fractal dimension
to fall with the level of activity (cf. Figure 5). The goodness of fit is quantified
by the linear regression R2 measure. The low scatter in the data (as reflected
in the high goodness of fit) suggests that the phase dependence is unlikely
to be an artefact. All the same, a more extensive investigation of fractal
exponents is necessary, with special attention paid to enhancing the sample
size, in order to obtain dimensions that are statistically more significant.
In this paper, using Ca II K digitized data obtained from Kodaikanal Solar
9(a) Minimum phase
(b) Intermediate phase
(c) Peak phase
Figure 5: Log-log plot of supergranular perimeter (in Mm) against super-
granular area (in Mm2 ) obtained for the (a) cycle minimum, (b) intermedi-
ate (middle) and (c) peak phases (base). The fractal dimensions read off the
slope of these plots are summarized in Table 1.
10Cycle phase Fractal dimension D Average cell scale (Mm)
Minimum 1.22 25.4
Intermediate 1.19 24.9
Peak 1.15 24.5
Table 2: Fractal dimension across different activity phases over all cell scales,
adapted from Figure 8 of Ref. Chatterjee et al. (2017). The anticorrelation
of scale with activity level here is consistent with a similar result reported
by Singh and Bappu (1981).
Observatory, we investigated the long-term behaviour of the supergranular
fractal dimension over a solar cycle. Our results indicate that the fractal
dimension is anti-correlated with magnetic activity, such that the fractal
dimension is just below 1.5 for the minimum phase, 1.3 during intermediate
phase and 1.2 at cycle peak. Paniveni et al. (2005) used only a time window
close to the Solar cycle minimum, whereas the sample here spans the cycle,
but is confined to low magnetic activity regions.
Our results are qualitatively consistent with those of Paniveni et al. (2011)
and Chatterjee et al. (2017). In particular, the latter report a similar anti-
correlation for quiet regions across a number of cycles obtained from KSO.
The average over about 3 cycles is summarized in Table 2. This agrees with
the anticorrelation found in our data, restricted to the smaller cells (Table
1), indicating that this behavior is scale-independent. However, our results
pertain to cells that are of a scale smaller than average. This suggests that
the anticorrelation between fractal dimension and the activity phase holds
across different scales for the quiet region. On the other hand, we find that
the fractal dimension values we obtain are slightly larger. This difference
may potentially be due to differences in the data sets and methods used to
extract D. However, in a recent work reported elsewhere (Sowmya et al.,
2022), we have been able to verify this scale-dependent fractal dimension,
suggesting that a multifractal is at play, and therefore that the properties of
the convection may evince a degree of scale-dependence.
A point worth noting here is the relatively small value of cell size ob-
tained here, which is comparable to that reported by Krishan et al. (2002)
using the same data analysis method, which preferentially selects relatively
smaller cells. Similar small scales are reported by other studies that tend
to extract individual cells, e.g., (Parnell et al., 2009), which reports a cell
diameter in the range 13-18 Mm, half of the generally quoted cell sizes that
are obtained by the autocorrelation method. These observations underscore
that the smaller scale is a selection effect due to the kind of method used.
11Here we point out that this effect can be understood in terms of the relation
between cell size and its boundary properties. The visual inspection method
picks out only well delineated cells, which can broadly be interpreted as cells
with lower fractal dimension.
Thus, the selection effect in our data can be explained if it is the case
that cell size and fractal dimension are positively correlated, which has in-
deed been reported to be the case (Srikanth, 1999). Solar magnetoconvection
is acknowledged to be a turbulent phenomenon (Krishan et al., 2002), which
suggests that small fluctations in the initial central upflow of the cell can
translate to large irregularities of the cell boundary. As a result, the bound-
aries of larger cells can be expected to be more irregular. Smaller cells are
also expected to manifest boundary irregularities, but to a relatively lesser ex-
tent. Thus, our requirement for cell boundaries to be regular or well-defined
is weighted towards smaller cells. This interpretation could be tested over a
larger sample of cells potentially using a machine learning based approach
that
4 Discussion and conclusions
An iso-surface has a fractal dimension given by DI =(Euclidean dimension)-
1/2 (exponent of the variance) proposed by (Mandelbrot, 1975) . Thus DT =
2–(1/2 × 2/3) = 5/3 ≈ 1.67 for an isotherm, considering a two-dimensional
surface of supergranulation. On the other hand, the pressure variance hp2 i is
proportional to the square of the velocity variance i.e. hp2 i ∝ r 4/3 Batchelor
(1953) and hence for an isobar it is Dp = 2 − (1/2 × 4/3) = 4/3 ≈ 1.33.
Considering the entire solar cycle, our analysis gives an averaged fractal
dimension value closer to 34 than to 53 (cf. Table 1), which indicates that the
supergranular network is closer to being isobaric than isothermal. This is
consistent also with the fractal dimension data derived by Chatterjee et al.
(2017) for supergranulation in both QRs and ARs. Our fractal dimension
data is consistent with a turbulent origin of the supergranules.
The proximity of the D values that we find to that corresponding to the
isobar limit may be accounted for by noting that the chromospheric network
is situated at the boundary of supergranules. Assuming that supergranules
are convective cells, they are expected in mixing-length theory to remain
in a full pressure balance with the ambient plasma. This may also explain
the difference between our D values and the fractal dimension reported by
Nesme-Ribes et al. (1996), who investigated regions demarcated by intensity
delimiters that correspond to isotherm surfaces.
Magnetic fields have the constricting property, by which charged particles
12cannot cut across magnetic field lines but are constrained to spiral along field
lines, essentially as a consequence of the Lorentz force law F~Lorentz = qc v × B.
As a consequence, the field lines are “frozen in” with the plasma. In the
limit of very high electric conductivity, plasma flow across a magnetic field
lines is prohibited as it would create extremely large eddy currents (Alfvén,
1942). If supergranular cells correspond to convective cells, then this mag-
netohydrodynamic effect explains why magnetic fields are swept to the net-
work boundaries. The effect can also be expected to smoothen the Ca II
K cell boundary by supressing fluctuations causing any deviation from the
underlying supergranular network boundary, thereby leading to a diminished
fractal dimension. Accordingly, during the maximum phase, when there is
a rapid dispersal of magnetically active regions, this effect should be more
pronounced, leading to a lower value of D. Correspondingly, there would
be relatively higher ruggedness of the network boundaries during the mag-
netically quiescent phase, leading to a higher value of D. This provides a
qualitative explanation for the cycle dependence of the fractal dimension that
we report in Table 1.
5 ACKNOWLEDGEMENT
We thank Professor Jagdev singh IIA, Bengaluru for providing the Ko-
daikanal solar data. RG and SGM thank Fiaz of IIA for the technical sup-
port.
References
Alfvén, H. (1942). Existence of electromagnetic-hydrodynamic waves. Na-
ture, 150(3805):405–406.
Batchelor, G. K. (1953). The theory of homogeneous turbulence. Cambridge
university press.
Cannon, J. (1984). The fractal geometry of nature. by benoit b. mandelbrot.
The American Mathematical Monthly, 91(9):594–598.
Chatterjee, S., Mandal, S., and Banerjee, D. (2017). Variation of supergran-
ule parameters with solar cycles: results from century-long kodaikanal
digitized ca ii k data. The Astrophysical Journal, 841(2):70.
13De Rosa, M., Duvall, T., and Toomre, J. (2000). Near-surface flow fields de-
duced using correlation tracking and time-distance analyses. Solar Physics,
192(1):351–361.
DeRosa, M. L. and Toomre, J. (2004). Evolution of solar supergranulation.
The Astrophysical Journal, 616(2):1242.
Hathaway, D. H., Beck, J., Bogart, R., Bachmann, K., Khatri, G., Petitto, J.,
Han, S., and Raymond, J. (2000). The photospheric convection spectrum.
Solar Physics, 193(1):299–312.
Hirzberger, J., Gizon, L., Solanki, S. K., and Duvall, T. L. (2008). Struc-
ture and evolution of supergranulation from local helioseismology. In He-
lioseismology, Asteroseismology, and MHD Connections, pages 415–435.
Springer.
Krishan, V., Paniveni, U., Singh, J., and Srikanth, R. (2002). Relationship
between horizontal flow velocity and cell size for supergranulation using
soho dopplergrams. Monthly Notices of the Royal Astronomical Society,
334(1):230–232.
Mandal, S., Chatterjee, S., and Banerjee, D. (2017). Association of super-
granule mean scales with solar cycle strengths and total solar irradiance.
The Astrophysical Journal, 844(1):24.
Mandelbrot, B. B. (1975). On the geometry of homogeneous turbulence,
with stress on the fractal dimension of the iso-surfaces of scalars. Journal
of Fluid Mechanics, 72(3):401–416.
Meunier, N. (1999). Fractal analysis of michelson doppler imager magne-
tograms: a contribution to the study of the formation of solar active re-
gions. The Astrophysical Journal, 515(2):801.
Meunier, N., Roudier, T., and Rieutord, M. (2008). Supergranules over the
solar cycle. Astronomy & Astrophysics, 488(3):1109–1115.
Meunier, N., Tkaczuk, R., and Roudier, T. (2007). Intensity variations inside
supergranules. Astronomy & Astrophysics, 463(2):745–753.
Muller, R., Roudier, T., Malherbe, J., and Mein, P. (1987). Dynamics of
the solar granulation. Publications of the Astronomical Institute of the
Czechoslovak Academy of Sciences, 1:175.
14Nesme-Ribes, E., Meunier, N., and Collin, B. (1996). Fractal analysis of
magnetic patterns from meudon spectroheliograms. Astronomy and As-
trophysics, 308:213–218.
Paniveni, U. (2015). Supergranulation, a convective phenomenon. IAU Gen-
eral Assembly, 29:2146218.
Paniveni, U., Krishan, V., Singh, J., and Srikanth, R. (2004). Relationship
between horizontal flow velocity and cell lifetime for supergranulation from
soho dopplergrams. Monthly Notices of the Royal Astronomical Society,
347(4):1279–1281.
Paniveni, U., Krishan, V., Singh, J., and Srikanth, R. (2005). On the fractal
structure of solar supergranulation. Solar Physics, 231(1):1–10.
Paniveni, U., Krishan, V., Singh, J., and Srikanth, R. (2010). Activity de-
pendence of solar supergranular fractal dimension. Monthly Notices of the
Royal Astronomical Society, 402(1):424–428.
Paniveni, U., Krishan, V., Singh, J., and Srikanth, R. (2011). Solar cycle
phase dependence of supergranular fractal dimension. Journal of Astro-
physics and Astronomy, 32(1-2):265.
Parnell, C., DeForest, C., Hagenaar, H., Johnston, B., Lamb, D., and Welsch,
B. (2009). A power-law distribution of solar magnetic fields over more than
five decades in flux. The Astrophysical Journal, 698(1):75.
Raju, K., Srikanth, R., and Singh, J. (1998). The dependence of chromo-
spheric ca ii k network cell sizes on solar latitude. Solar Physics, 180(1):47–
51.
Rieutord, M., Meunier, N., Roudier, T., Rondi, S., Beigbeder, F., and Pares,
L. (2008). Solar supergranulation revealed by granule tracking. Astronomy
& Astrophysics, 479(1):L17–L20.
Rieutord, M. and Rincon, F. (2010). The sun’s supergranulation. Living
Reviews in Solar Physics, 7(1):1–82.
Rincon, F. and Rieutord, M. (2018). The sun’s supergranulation. Living
Reviews in Solar Physics, 15(1):1–74.
Singh, J. and Bappu, M. (1981). A dependence on solar cycle of the size of
the ca+ network. Solar Physics, 71(1):161–168.
15Sowmya, G. M., Rajani, G., Paniveni, U., and Srikanth, R. (2022). Super-
granular fractal dimension and solar rotation. Under submission.
Srikanth, R. (1999). Studies on the Solar Chromospheric Network. PhD
thesis, Indian Institute of Science, Bangalore.
Srikanth, R., Raju, K., and Singh, J. (1999). The chromospheric network:
Dependence of cell lifetime on length-scale. Solar Physics, 184(2):267–280.
16You can also read