Somatic mutation rates scale with lifespan across mammals

Page created by Lewis Schneider
 
CONTINUE READING
Somatic mutation rates scale with lifespan across mammals
Article

Somatic mutation rates scale with lifespan
across mammals
­­­­­
https://doi.org/10.1038/s41586-022-04618-z                      Alex Cagan1,15 ✉, Adrian Baez-Ortega1,15, Natalia Brzozowska1, Federico Abascal1,
                                                                Tim H. H. Coorens1, Mathijs A. Sanders1,2, Andrew R. J. Lawson1, Luke M. R. Harvey1,
Received: 17 August 2021
                                                                Shriram Bhosle1, David Jones1, Raul E. Alcantara1, Timothy M. Butler1, Yvette Hooks1,
Accepted: 7 March 2022                                          Kirsty Roberts1, Elizabeth Anderson1, Sharna Lunn1, Edmund Flach3, Simon Spiro3,
                                                                Inez Januszczak3,4, Ethan Wrigglesworth3, Hannah Jenkins3, Tilly Dallas3, Nic Masters3,
Published online: 13 April 2022
                                                                Matthew W. Perkins5, Robert Deaville5, Megan Druce6,7, Ruzhica Bogeska6,7,
Open access                                                     Michael D. Milsom6,7, Björn Neumann8,9, Frank Gorman10, Fernando Constantino-Casas10,
                                                                Laura Peachey10,11, Diana Bochynska10,12, Ewan St. John Smith13, Moritz Gerstung14,
        Check for updates
                                                                Peter J. Campbell1, Elizabeth P. Murchison10, Michael R. Stratton1 & Iñigo Martincorena1 ✉

                                                                The rates and patterns of somatic mutation in normal tissues are largely unknown
                                                                outside of humans1–7. Comparative analyses can shed light on the diversity of
                                                                mutagenesis across species, and on long-standing hypotheses about the evolution of
                                                                somatic mutation rates and their role in cancer and ageing. Here we performed
                                                                whole-genome sequencing of 208 intestinal crypts from 56 individuals to study the
                                                                landscape of somatic mutation across 16 mammalian species. We found that somatic
                                                                mutagenesis was dominated by seemingly endogenous mutational processes in all
                                                                species, including 5-methylcytosine deamination and oxidative damage. With some
                                                                differences, mutational signatures in other species resembled those described in
                                                                humans8, although the relative contribution of each signature varied across species.
                                                                Notably, the somatic mutation rate per year varied greatly across species and
                                                                exhibited a strong inverse relationship with species lifespan, with no other life-history
                                                                trait studied showing a comparable association. Despite widely different life histories
                                                                among the species we examined—including variation of around 30-fold in lifespan
                                                                and around 40,000-fold in body mass—the somatic mutation burden at the end of
                                                                lifespan varied only by a factor of around 3. These data unveil common mutational
                                                                processes across mammals, and suggest that somatic mutation rates are
                                                                evolutionarily constrained and may be a contributing factor in ageing.

Somatic mutations accumulate in healthy cells throughout life. They                             age, some human tissues are colonized by mutant cells that contain
underpin the development of cancer9 and, for decades, have been                                 cancer-driving mutations, and how this clonal composition changes
speculated to contribute to ageing10–12. Directly studying somatic muta-                        with age and disease. With the exception of some initial studies, far less
tions in normal tissues has been challenging owing to the difficulty of                         is known about somatic mutation in other species1–7. Yet, comparative
detecting mutations present in single cells or small clones in a tissue.                        analyses of somatic mutagenesis would shed light on the diversity of
Only recent technological developments, such as in vitro expansion of                           mutagenic processes across species, and on long-standing questions
single cells into colonies13,14, microdissection of histological units8,15,                     regarding the evolution of somatic mutation rates and their role in
single-cell sequencing16,17 or single-molecule sequencing18, are begin-                         cancer and ageing.
ning to enable the study of somatic mutation in normal tissues.                                    A decades-long hypothesis on the evolution of somatic mutation
   Over the last few years, studies in humans have started to provide                           rates pertains to the relationship between body mass and cancer risk.
a detailed understanding of somatic mutation rates and the contri-                              Some models predict that the risk of cancer should increase propor-
bution of endogenous and exogenous mutational processes across                                  tionally to the number of cells at risk of transformation. However, there
normal tissues8,13,14,19,20. These studies are also revealing how, as we                        appears to be no correlation between body mass and cancer risk across

1
 Cancer, Ageing and Somatic Mutation (CASM), Wellcome Sanger Institute, Hinxton, UK. 2Department of Hematology, Erasmus MC Cancer Institute, Rotterdam, the Netherlands. 3Wildlife
Health Services, Zoological Society of London, London, UK. 4The Natural History Museum, London, UK. 5Institute of Zoology, Zoological Society of London, London, UK. 6Division of
Experimental Hematology, German Cancer Research Center (DKFZ), Heidelberg, Germany. 7Heidelberg Institute for Stem Cell Technology and Experimental Medicine GmbH (HI-STEM),
Heidelberg, Germany. 8Wellcome Trust–Medical Research Council Cambridge Stem Cell Institute, University of Cambridge, Cambridge, UK. 9Department of Clinical Neurosciences, University
of Cambridge, Cambridge, UK. 10Department of Veterinary Medicine, University of Cambridge, Cambridge, UK. 11Bristol Veterinary School, Faculty of Health Sciences, University of Bristol,
Langford, UK. 12Department of Pathology, Faculty of Veterinary Medicine, Universitatea de Stiinte Agricole si Medicina Veterinara, Cluj-Napoca, Romania. 13Department of Pharmacology,
University of Cambridge, Cambridge, UK. 14European Molecular Biology Laboratory, European Bioinformatics Institute (EMBL-EBI), Hinxton, UK. 15These authors contributed equally: Alex Cagan,
Adrian Baez-Ortega. ✉e-mail: ac36@sanger.ac.uk; im3@sanger.ac.uk

                                                                                                                                         Nature | Vol 604 | 21 April 2022 | 517
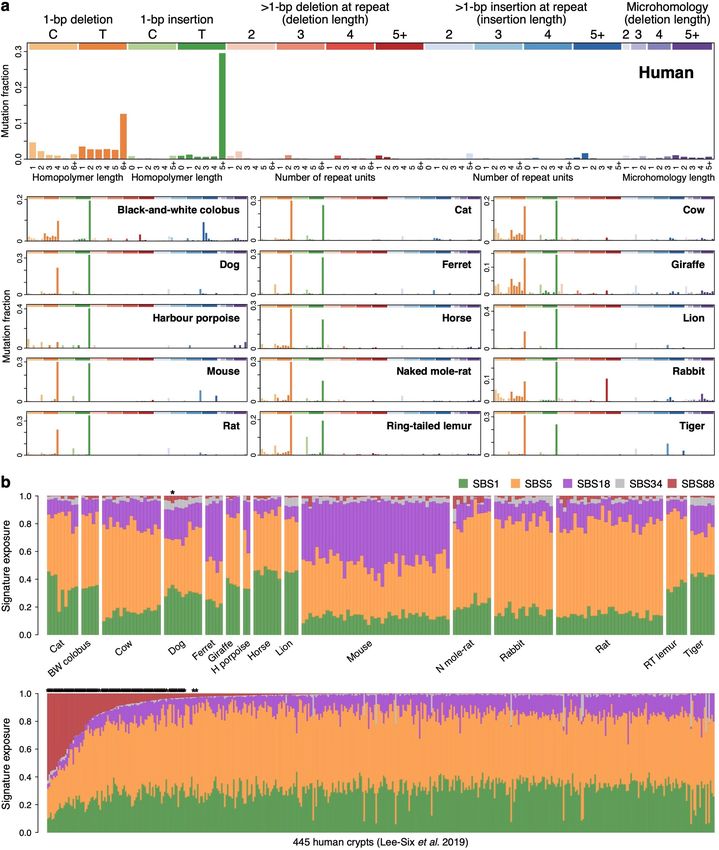
Somatic mutation rates scale with lifespan across mammals
Article
species21,22. This observation, known as Peto’s paradox, suggests that          individual (Supplementary Table 4). The number of somatic insertions
the evolution of larger body sizes is likely to require the evolution of        and deletions (indels) was consistently lower than that of substitutions
stronger cancer suppression mechanisms23,24. Whether evolutionary               in all crypts (Fig. 1b), in agreement with previous findings in humans8.
reduction of cancer risk across species is partly achieved by a reduction
of somatic mutation rates remains unknown.
   A second long-standing hypothesis on the evolution of somatic muta-          Mutational signatures across mammals
tion rates relates to the proposed role of somatic mutations in ageing.         Somatic mutations can be caused by multiple mutational processes, involv-
Multiple forms of molecular damage, including somatic mutations,                ing different forms of DNA damage and repair. Different processes cause
telomere attrition, epigenetic drift and loss of proteostasis, have been        characteristic frequencies of base substitution types and indels at different
proposed to contribute to ageing, but their causal roles and relative con-      sequence contexts, often referred to as mutational signatures, which can
tributions remain debated25,26. Evolutionary theory predicts that species       be inferred from mutation data30. Across species, the mutational spectra
will evolve protection or repair mechanisms against life-threatening            showed clear similarities, with a dominance of cytosine-to-thymine (C>T)
damage to minimize death from intrinsic causes, but that selection is           substitutions at CpG sites, as observed in human colon, but with consid-
too weak to delay ageing far beyond the typical life expectancy of an           erable variation in the frequency of other substitution types (Fig. 2a).
organism in the wild (Supplementary Note 1). If somatic mutations               To quantify the contribution of different mutational processes to the
contribute to ageing, theory predicts that somatic mutation rates may           observed spectra, we applied mutational signature decomposition8,30.
inversely correlate with lifespan across species27,28. This prediction has      We used a Bayesian model to infer mutational signatures de novo, while
remained largely untested owing to the difficulty of measuring somatic          accounting for differences in genome sequence composition across
mutation rates across species.                                                  species, and using the COSMIC human signature SBS1 (C>T substitu-
                                                                                tions at CpG sites) as a fixed prior to ensure its complete deconvolution31
                                                                                (Methods). This approach identified two signatures beyond SBS1, labelled
Detection of somatic mutations across species                                   SBSB and SBSC, which resemble COSMIC human signatures SBS5 and
The study of somatic mutations with standard whole-genome sequenc-              SBS18, respectively (cosine similarities 0.93 and 0.91) (Fig. 2b).
ing requires isolating clonal groups of cells recently derived from a              This analysis suggests that the same three signatures that dominate
single cell8,13,14. To study somatic mutations across a diverse set of          somatic mutagenesis in the human colon are dominant in other mam-
mammals, we isolated 208 individual intestinal crypts from 56 indi-             mals: SBS1, which is believed to result from the spontaneous deamina-
viduals across 16 species with a wide range of lifespans and body sizes:        tion of 5-methylcytosine8,32; SBSB (SBS5), a common signature across
black-and-white colobus monkey, cat, cow, dog, ferret, giraffe, har-            human tissues that may result from endogenous damage and repair18,33;
bour porpoise, horse, human, lion, mouse, naked mole-rat, rabbit, rat,          and SBSC (SBS18), which is dominated by C>A substitutions and attrib-
ring-tailed lemur and tiger (Supplementary Table 1). We chose intestinal        uted to oxidative DNA damage30. Signature SBSC contains a minor
crypts for several reasons. First, they are histologically identifiable units   component of T>A substitutions (resembling COSMIC SBS34), which
that line the epithelium of the colon and small intestine and are amena-        appear to be the result of DNA polymerase slippage at the boundaries
ble to laser microdissection. Second, human studies have confirmed              between adjacent adenine and thymine homopolymer tracts, but could
that individual crypts become clonally derived from a single stem cell          also reflect assembly errors at those sites33. Although all of the spe-
and show a linear accumulation of mutations with age, which enables             cies that we examined shared the three mutational signatures, their
the estimation of somatic mutation rates through genome sequencing              contributions varied substantially across species (Fig. 2c). SBSC was
of single crypts8. Third, in most human crypts, most somatic mutations          particularly prominent in mouse and ferret, and the ratio of SBS1 to
are caused by endogenous mutational processes common to other                   SBSB/5 varied from approximately 1.2 in rat or rabbit to 6.4 in tiger.
tissues, rather than by environmental mutagens8,18.                             In several species with data from multiple individuals, separate linear
   A colon sample was collected from each individual, with the excep-           regressions for each signature confirmed that mutations from all three
tion of a ferret from which only a small intestine sample was available.        signatures accumulate with age (Fig. 2d, Extended Data Fig. 5).
This sample was included because results in humans have shown that                 Although signature deconvolution identified three signatures that
the mutation rates of colorectal and small intestine epithelial stem cells      are active across species, we noticed some differences in the muta-
are similar14,20 (Extended Data Fig. 1). We then used laser microdissection     tional profile of signature SBSB among species. To investigate this
on histological sections to isolate individual crypts for whole-genome          further, we inferred independent versions of SBSB from each species,
sequencing with a low-input library preparation method29 (Fig. 1a,              while accounting for differences in genome sequence composition
Extended Data Fig. 2, Supplementary Table 2), with the exception of             (Methods). This revealed inter-species variability in the mutational
human crypts, for which sequencing data were obtained from a pre-               profile of this signature, particularly in the C>T component (Extended
vious study8. A bioinformatic pipeline was developed to call somatic            Data Fig. 6). Species-specific versions of SBSB showed different simi-
mutations robustly in all these species despite the variable quality of         larities to the related human signatures SBS5 and SBS40. For example,
their genome assemblies (Methods). The distribution of variant allele           SBSB inferred from the human data showed a stronger similarity with
fractions of the mutations detected in each crypt confirmed that crypts         the reference human signature SBS5 (cosine similarities with SBS5
are clonal units in all species, enabling the study of somatic mutation         and SBS40: 0.93 and 0.84), whereas SBSB from rabbit more closely
rates and signatures (Extended Data Fig. 3).                                    resembled the reference human signature SBS40 (0.87 and 0.91). These
   We found substantial variation in the number of somatic single-base          observations are consistent with the hypothesis that SBS5 and SBS40
substitutions across species and across individuals within each species         result from a combination of correlated mutational processes, with
(Fig. 1b). For five species with samples from multiple individuals (dog,        some variation across human tissues18,33 and across species.
human, mouse, naked mole-rat and rat), linear regression confirmed                 Analysis of the indel mutational spectra revealed a dominance of
a clear accumulation of somatic mutations with age (Fig. 1c, Extended           the human indel signatures ID1 and ID2, which are characterized by
Data Fig. 4, Supplementary Table 3). All linear regressions were also con-      single-nucleotide indels at A/T homopolymers, and probably caused
sistent with a non-significant intercept. This resembles observations           by strand slippage during DNA replication30 (Extended Data Fig. 7a).
in humans20 and suggests that the time required for a single stem cell          The ratio of insertions (ID1) to deletions (ID2) appears to vary across
to drift to fixation within a crypt is a small fraction of the lifespan of a    species, possibly reflecting a differential propensity for slippage of the
species. This facilitates the estimation of somatic mutation rates across       template and nascent DNA strands30. In addition, the indel spectra sug-
species by dividing the number of mutations in a crypt by the age of the        gest a potential contribution of signature ID9 (the aetiology of which

518 | Nature | Vol 604 | 21 April 2022
Somatic mutation rates scale with lifespan across mammals
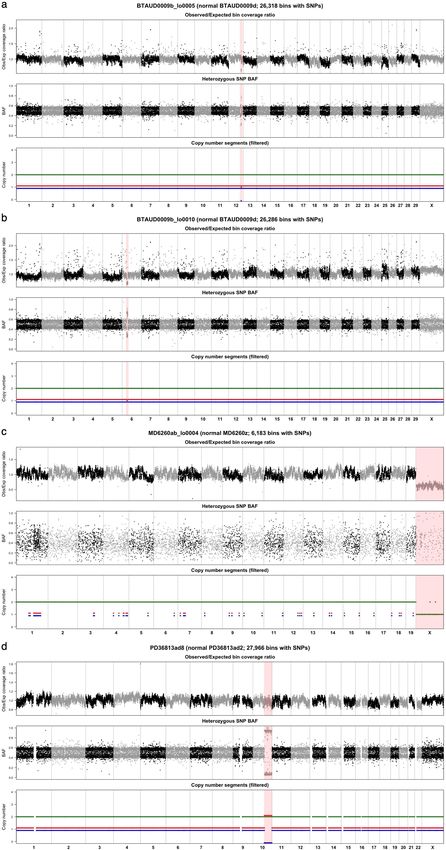
a                                                           Horse                                            Lion                                    Naked mole-rat                                                   Rat

    b                                     Substitutions              Indels

                          4,000
  Mutations per genome

                          3,000

                          2,000

                          1,000

                                  0                                                                                               e s                                                         r
                                              t             it
                                                                              Ra
                                                                                   t
                                                                                                                 us
                                                                                                                   e
                                                                                                                               ois bu aff
                                                                                                                                          e                w           g      rse
                                                                                                                                                                                           t
                                                                                                                                                                                      Ca lemu
                                                                                                                                                                                                                       n            er ion ret
                                        -ra             bb                                                                   rp olo Gir                  Co          Do    Ho                                       ma           Tig L Fer
                                     le               Ra                                                     Mo            o                                                                                      Hu
                                  mo                                                                                    r p te
                                                                                                                                c
                                                                                                                                                                                      ail
                                                                                                                                                                                          e d
                           ke
                              d                                                                                       ou hi                                                         -t
                         Na                                                                                       a rb d-w                                                      ng
                                                                                                                H an                                                        Ri
                                                                                                                   k-
                                                                                                             B lac

    c                                                      Dog                                               Human                                                    Mouse                                            Naked mole-rat
                         3,000                                                            4,000                                                                                                         800
                                                                                                                                             2,000

                                                                                          3,000                                              1,500                                                      600
 Mutations

                                                                              Mutations

                                                                                                                                 Mutations

                                                                                                                                                                                            Mutations
                         2,000
                                                                                          2,000                                              1,000                                                      400
                         1,000
                                                                                          1,000                                               500                                                       200

                                0                                                            0                                                  0                                                        0
                                    0     2       4    6 8 10 12 14                               0   20     40     60      80                       0        0.5    1.0 1.5 2.0                              0        2      4      6      8
                                                      Age (years)                                          Age (years)                                              Age (years)                                            Age (years)

Fig. 1 | Somatic mutation burden in mammalian colorectal crypts. a,                                                               mutation burden. c, Linear regression of somatic substitution burden
Histology images of colon samples from horse, lion, naked mole-rat and rat,                                                       (corrected for analysable genome size) on individual age for dog, human,
with one colorectal crypt marked in each. Scale bars, 250 µm. b, Burden of                                                        mouse and naked mole-rat samples. Samples from the same individual are
somatic substitutions and indels per diploid genome in each colorectal crypt                                                      shown in the same colour. Regression was performed using mean mutation
sample (corrected for the size of the analysable genome). Samples are grouped                                                     burdens per individual. Shaded areas indicate 95% confidence intervals of the
by individual, with samples from the same individual coloured in the same                                                         regression line.
shade. Species, and individuals within each species, are sorted by mean

remains unknown) to human, colobus, cow, giraffe and rabbit. Analysis                                                             mutagenesis in 21% of human crypts, but only uncertain evidence
of indels longer than one base pair also suggested the presence of a                                                              of colibactin in one non-human crypt (0.6%) (Extended Data Fig. 7b,
signature of four-base-pair insertions at tetrameric repeats, which was                                                           Methods). This revealed a significant depletion of colibactin mutagen-
particularly prevalent in mouse and tiger; a pattern of insertions of five                                                        esis in the non-human crypts studied (Fisher’s exact test, P = 7 × 10–14).
or more base pairs at repeats in colobus; and a pattern of deletions of                                                           The apparent difference in colibactin mutagenesis observed between
five or more base pairs at repeats, which was prominent in rabbit and                                                             species, or between the cohorts studied, might result from a different
resembles ID8 (a signature possibly caused by double-strand break                                                                 prevalence of pks+ E. coli strains36 or a different expression of colibactin
repair through non-homologous end joining30) (Extended Data Fig. 7a).                                                             by pks+ E. coli across species37. Finally, we also searched for evidence of
                                                                                                                                  APOBEC signatures (SBS2 and SBS13), which have been reported in a
                                                                                                                                  small number of human crypts and are believed to be caused by APOBEC
Other mutational processes and selection                                                                                          DNA-editing cytidine deaminases. We detected APOBEC signatures in
The apparent lack of additional mutational signatures is noteworthy.                                                              2% (n = 9) of human crypts and found only uncertain evidence in one
A previous study of 445 colorectal crypts from 42 human donors found                                                              non-human crypt (P = 0.30).
that many crypts were affected by a signature that was later attrib-                                                                Beyond substitutions and indels, crypts from the eight species with
uted to colibactin, a genotoxin produced by pks+ strains of Escheri-                                                              chromosome-level genome assemblies were inspected for large-scale
chia coli8,34,35. Analysing the original human data and our non-human                                                             copy number changes (at least 1 Mb) (Methods). Studies in humans
data with the same methodology, we found evidence of colibactin                                                                   have found that large-scale copy number changes are relatively rare in

                                                                                                                                                                                         Nature | Vol 604 | 21 April 2022 | 519
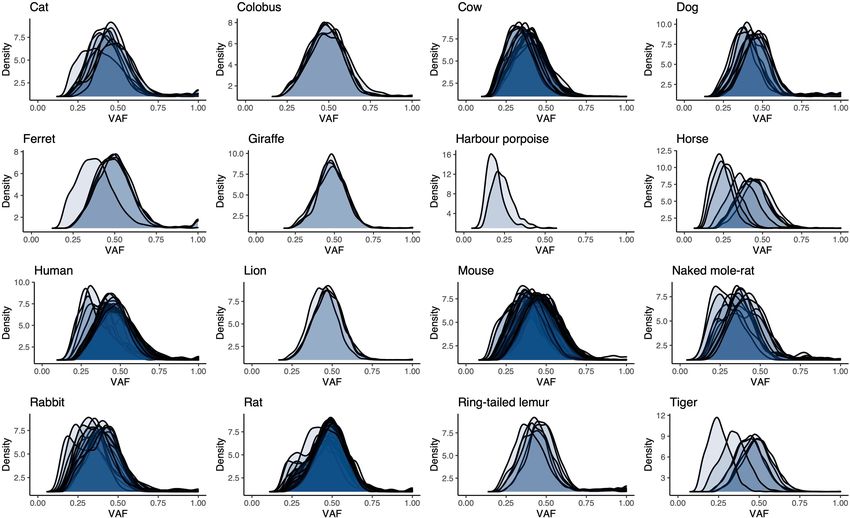
Somatic mutation rates scale with lifespan across mammals
Article
       a                                          C>A                                C>G                                                 C>T                            T>A                                                         T> C                             T>G
                          0.15
     Mutation fraction

                                          Human
                          0.10

                          0.05

                               0

                                   77*
                                   $&$
                                   $&&
                                   $&*
                                   $&7
                                   &&$
                                   &&&
                                   &&*
                                   &&7
                                   *&$
                                   *&&
                                   *&*
                                   *&7
                                   7&$
                                   7&&
                                   7&*
                                   7&7
                                   $7$
                                   $7&
                                   $7*
                                   $77
                                   &7$
                                   &7&
                                   &7*
                                   &77
                                   *7$
                                   *7&
                                   *7*
                                   *77
                                   77$
                                   77&
                                   77*
                                   777
                                   $7$
                                   $7&
                                   $7*
                                   $77
                                   &7$
                                   &7&
                                   &7*
                                   &77
                                   *7$
                                   *7&
                                   *7*
                                   *77
                                   77$
                                   77&
                                   777
                                    &
                                    &
                                    &
                                    &
                                    &
                                    &
                                    &
                                    &
                                    &
                                    &
                                    &
                                    &
                                    &
                                    &
                                    &
                                    &
                                    &
                                    &
                                    &
                                    &
                                    &
                                    &
                                    &
                                    &
                                    &
                                    &
                                    &
                                    &
                                    &
                                    &
                                    &
                                    &
                                    &
                                    &
                                    &
                                    &
                                    &
                                    &
                                    &
                                    &
                                    &
                                    &
                                    &
                                    &
                                    &
                                    &
                                    &
                                    &
                                    7
                                    7
                                    7
                                    7
                                    7
                                    7
                                    7
                                    7
                                    7
                                    7
                                    7
                                    7
                                    7
                                    7
                                    7
                                    7
                                    7
                                    7
                                    7
                                    7
                                    7
                                    7
                                    7
                                    7
                                    7
                                    7
                                    7
                                    7
                                    7
                                    7
                                    7
                                    7
                                    7
                                    7
                                    7
                                    7
                                    7
                                    7
                                    7
                                    7
                                    7
                                    7
                                    7
                                    7
                                    7
                                    7
                                    7
                                    7
                             0.1                               Black-and-white colobus                                   0.1                                                    Cat                                  0.05                                                         Cow

                               0                                                                                           0                                                                                               0
                             0.1                                                                                         0.1
                                                                                      Dog                                                                                     Ferret                                   0.1                                                      Giraffe

                               0                                                                                          0                                                                                                0

                                                                                                    Mutation fraction

                                                                                                                                                                                                 Mutation fraction
     Mutation fraction

                             0.1                                       Harbour porpoise                                                                                       Horse                                                                                               Lion
                                                                                                                         0.1                                                                                           0.1

                               0                                                                                          0                                                                                                0

                          0.05                                                       Mouse                                                                          Naked mole-rat                                   0.05                                                       Rabbit
                                                                                                                        0.05

                               0                                                                                          0                                                                                                0

                          0.05                                                         Rat                               0.1                                    Ring-tailed lemur                                                                                                Tiger
                                                                                                                                                                                                                       0.1

                               0                                                                                          0                                                                                                0
       b
                                                                                                                        0.05
     probability

                                                                                                probability

                                                                                                                                                                                              probability
                                                                                                                                                                                                                       0.1
      Mutation

                                                                                                 Mutation

                                                                                                                                                                                               Mutation
                             0.3                                                     SBS1                                                                                     SBSB                                                                                               SBSC

                               0                                                                                          0                                                                                                0

     c                                 SBS1       SBSB          SBSC
                             1.0
                             0.8
    Exposure

                             0.6
                             0.4
                             0.2
                               0
                                    -ra
                                        t
                                                   bb
                                                       it
                                                                          Ra
                                                                            t
                                                                                                                               us
                                                                                                                                 e                     ise us ffe        w                g                          rse        Ca emu
                                                                                                                                                                                                                                       t    r             n                er      n et
                                                                                                                                                    po lob Gira        Co            Do                Ho                                               ma             Tig      Lio Ferr
                               mo
                                  le             Ra                                                                       Mo                      or co                                                                                   l           Hu
                                                                                                                                              r p   te                                                                             i l ed
                         ked                                                                                                                ou hi                                                                              -ta
                   Na                                                                                                                     rb -w                                                                            ng
                                                                                                                                       Ha -and                                                                         Ri
                                                                                                                                          k
                                                                                                                                     Blac
       d                                                     Human                                                                                     Mouse                                                                                        Naked mole-rat

                         3,000            SBS1                                                                   1,000
                                                                                                                                                                                                                      500
                                          SBSB
                                          SBSC                                                                          800
                                                                                                                                                                                                                      400
                         2,000
                                                                                                                                                                                                    Mutations
                                                                                                    Mutations
      Mutations

                                                                                                                        600
                                                                                                                                                                                                                      300

                                                                                                                        400                                                                                           200
                         1,000
                                                                                                                        200                                                                                           100

                               0                                                                                          0                                                                                                0
                                   0              20             40             60         80                                   0          0.5      1.0        1.5            2.0                                               0               2         4            6                  8
                                                            Age (years)                                                                            Age (years)                                                                                         Age (years)

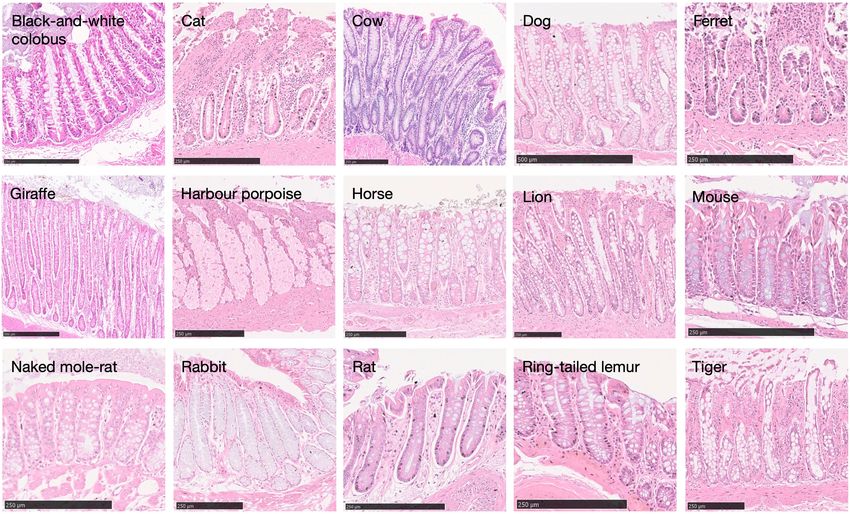
Fig. 2 | Mutational processes in the mammalian colon. a, Mutational spectra                                                                           contribution of each signature to each sample. Samples are arranged
of somatic substitutions in each species. The x axis shows 96 mutation types on                                                                       horizontally as in Fig. 1b. d, Linear regression of signature-specific mutation
a trinucleotide context, coloured by base substitution type. b, Mutational                                                                            burdens (corrected for analysable genome size) on individual age for human,
signatures inferred from (SBSB, SBSC) or fitted to (SBS1) the species                                                                                 mouse and naked mole-rat samples. Regression was performed using mean
mutational spectra shown in a, and normalized to the human genome                                                                                     mutation burdens per individual. Shaded areas indicate 95% confidence
trinucleotide frequencies. The y axis shows mutation probability. c, Estimated                                                                        intervals of the regression line.

normal tissues, including colorectal epithelium8. Consistent with these                                                                                  Previous analyses in humans have shown that most somatic muta-
results, we only identified 4 large copy number changes across the 162                                                                                tions in colorectal crypts accumulate neutrally, without clear evidence
crypts included in this analysis: 2 megabase-scale deletions in 2 crypts                                                                              of negative selection against non-synonymous mutations and with a
from the same cow; the loss of an X chromosome in a female mouse                                                                                      low frequency of positively selected cancer-driver mutations8. To study
crypt; and a 52-Mb segment with copy-neutral loss of heterozygosity                                                                                   somatic selection in our data, we calculated the exome-wide ratio of
in a human crypt (Extended Data Fig. 8, Methods). These results sug-                                                                                  non-synonymous to synonymous substitution rates (dN/dS) in each of the
gest that large-scale somatic copy number changes in normal tissues                                                                                   12 species with available genome annotation. To do so and to detect genes
are also rare in other mammalian species.                                                                                                             under positive selection, while accounting for the effects of trinucleotide

520 | Nature | Vol 604 | 21 April 2022
Somatic mutation rates scale with lifespan across mammals
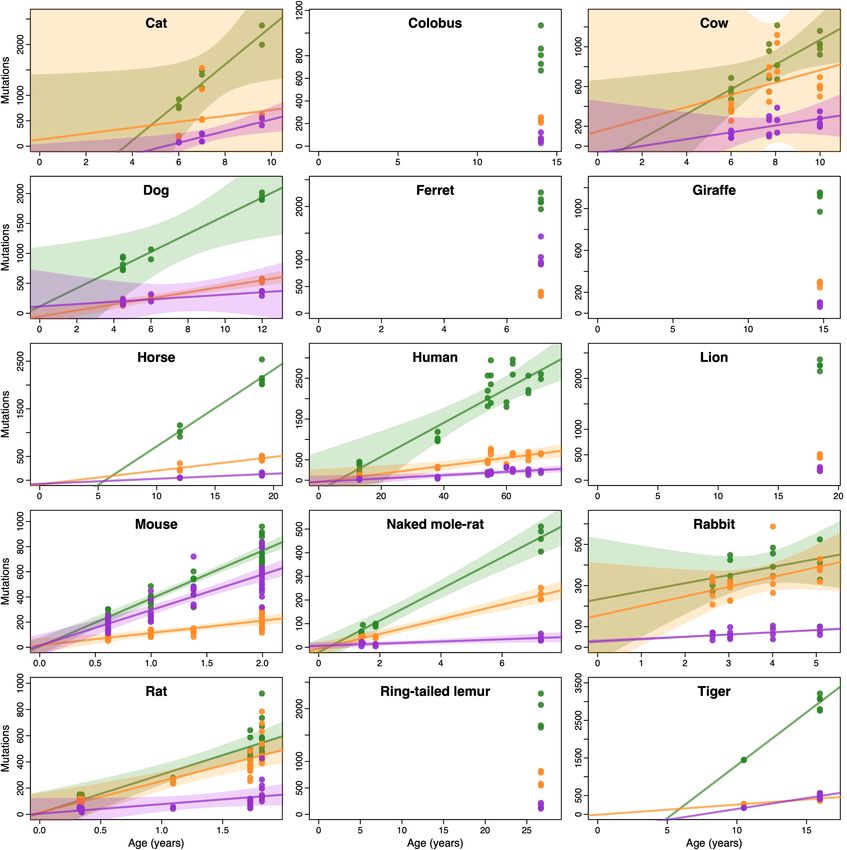
a                                           Substitutions                    Indels
                                   1,200
 Mutation rate per year

                                    900

                                    600

                                    300

                                          0

                                   8,000
 End-of-lifespan burden

                                   6,000

                                   4,000

                                   2,000

                                          0
                                                     rat                 it
                                                                                                     Ra
                                                                                                       t                                                                 e                                                   s
                                                                                                                                                                                                                           bu ffe                                       w                 g
                                                                                                                                                                                                                                                                                                   rse
                                                                                                                                                                                                                                                                                                                  t
                                                                                                                                                                                                                                                                                                              Ca lem
                                                                                                                                                                                                                                                                                                                         ur                                                                                              n              er      n     et
                                                  le-                  bb                                                                                              us
                                                                                                                                                                                                                        olo Gira                                    Co               Do                                                                                                                                ma            Tig     Lio Ferr
                                            o                    Ra                                                                                                 Mo                                    c                                                                                      Ho                   ed                                                                                           Hu
                                         dm                                                                                                                                                           ite                                                                                                         i l
                                     ke                                                                                                                                                     h                                                                                                                 -ta
                                   Na                                                                                                                                                   -w                                                                                                                 ng
                                                                                                                                                                                    and                                                                                                                  Ri
                                                                                                                                                                                 k-
                                                                                                                                                                            B lac
   b                                                                                                                                                                                                                               d

                                                                                                                                                                                                                                                                                                                        Mutation rate residual (allometric)
                                                                                                           Mutation rate residual (allometric)

                                                                                                                                                 0.4
                                                                                FVE = 0.85                                                                                  FVE = 0.82                                                                                                          FVE = 0.21                                                                                                         FVE = 0.06

                                                                                                                                                                                                                              log10(mutation rate per year)
                                        3.0                                                                                                                                                                                                                   3.0                                                                                              0.2
 log10(mutation rate per year)

                                                                                P = 1.0 × 10⁻⁶                                                                              P = 3.2 × 10⁻⁶                                                                                                      P = 0.085                                                                                                          P = 0.39
                                                                                                                                                                                                                                                                                                                                                               0.1
                                        2.5                                                                                                       0                                                                                                           2.5
                                                                                                                                                                                                                                                                                                                                                                                0

                                        2.0                                                                                                                                                                                                                   2.0
                                                                                                                                                                                                                                                                                                                                                              –0.1
                                                    Slope = –0.86                                                                            –0.4
                                        1.5         95% CI: (–1.08, –0.65)                                                                                                                                                                                    1.5                                                                                             –0.2

                                                        0.5        1.0       1.5               2.0                                                       –0.4         0         0.4                                                                                 1        2       3     4    5             6                                                                                               –3      –2     –1      0       1      2
                                                                 log10(lifespan)                                                                        Lifespan residual (allometric)                                                                                           log10(adult mass)                                                                                                                 Adult mass residual (allometric)

                                                                                                                                                                                                                                                                                                                                                                                                                             Individually
         c                                                                                                                                                                                     e                                                                                                                                                                         f                                     1.0
                                                                                                                                                                                                                                                                                                                                                                                                                             Paired with 1/lifespan

                                    800                 Mouse                                                                                                                                                                                                  Mouse

                                                                                                                                                                                                                                                                                                                                                               Fraction of inter-species variance explained
                                                                                                           k = 3,206.4                                                                                                  800                                                           Intercept = 678.94
                                                                                                           95% CI: 2,683.9–3,728.9                                                                                                                                                    Slope = –108.54                                                                                                          0.8
                                                                                                           FVE = 0.82                                                                                                                                                        Rat      FVE = 0.44
     Mean mutation rate per year

                                                                                                                                                                                          Mean mutation rate per year

                                              Rat
                                    600                                                                    ELB range: 1,828.1–5,378.7
                                                                                                                                                                                                                        600
                                                                                                                                                                                                                                                                                 Ferret                                                                                                                        0.6
                                                              Ferret

                                    400                                                                                                                                                                                 400
                                                                                                                                                                                                                                                                                                                                                                                                               0.4
                                                                                                                                                                                                                                                                                          Cat
                                                                Dog           Cat                                                                                                                                                                                                                 Dog
                                                   Rabbit                 Tiger                                                                                                                                                                                                    Rabbit
                                                                                                                                                                                                                                                                              Tiger Cow
                                    200                                 Cow Ring-tailed lemur                                                                                                                           200                                                      Lion                                                                                                                          0.2
                                                               Lion                                                                                                                                                                                         Ring-tailed lemur
                                                                                Horse                                                                                                                                                        Naked mole-rat                         Horse
                                                                 Giraffe                                                                                                 Human                                                                                             Human
                                                  Black-and-white colobus                    Naked mole-rat                                                                                                                                        Black-and-white colobus
                                          0                                                                                                                                                                              0                                                     Giraffe                                                                                                                             0
                                              0                         20                       40                                                    60                80                                                   0                                 1        2         3       4             5          6
                                                                                                                                                                                                                                                                                                                                                                                                                             ize

                                                                                                                                                                                                                                                                                                                                                                                                                               s
                                                                                                                                                                                                                                                                                                                                                                                                                               n

                                                                                                                                                                                                                                                                                                                                                                                                                              R)
                                                                                                                                                                                                                                                                                                                                                                                                                              s)

                                                                                                                                                                                                                                                                                                                                                                                                                            al
                                                                                                                                                                                                                                                                                                                                                                                                                           pa

                                                                                                                                                                                                                                                                                                                                                                                                                           as

                                                                                                                                                                                                                                                                                                                                                                                                                           M
                                                                                                                                                                                                                                                                                                                                                                                                                          rs

                                                                                                                                                                                                                                                                                                                                                                                                                          du
                                                                                                                                                                                                                                                                                                                                                                                                                         es

                                                                                             Lifespan (years)
                                                                                                                                                                                                                                                                                                                                                                                                                         m

                                                                                                                                                                                                                                                                                                                                                                                                               BM 10 (B

                                                                                                                                                                                                                                                                             log10(adult mass)
                                                                                                                                                                                                                                                                                                                                                                                                                      tte

                                                                                                                                                                                                                                                                                                                                                                                                                       si
                                                                                                                                                                                                                                                                                                                                                                                                                     lif

                                                                                                                                                                                                                                                                                                                                                                                                                     lt

                                                                                                                                                                                                                                                                                                                                                                                                                    re
                                                                                                                                                                                                                                                                                                                                                                                                                   Li
                                                                                                                                                                                                                                                                                                                                                                                                              1/

                                                                                                                                                                                                                                                                                                                                                                                                                        du

                                                                                                                                                                                                                                                                                                                                                                                                                   g
                                                                                                                                                                                                                                                                                                                                                                                                                 lo

                                                                                                                                                                                                                                                                                                                                                                                                                 R
                                                                                                                                                                                                                                                                                                                                                                                                                     (a
                                                                                                                                                                                                                                                                                                                                                                                                                    10
                                                                                                                                                                                                                                                                                                                                                                                                                 g
                                                                                                                                                                                                                                                                                                                                                                                                               lo

Fig. 3 | Associations between somatic mutation rates and life-history traits.                                                                                                                                                 darker shaded area indicates 95% CI of the regression line, and the lighter
a, Somatic mutation rate per year and expected end-of-lifespan mutation                                                                                                                                                       shaded area marks a twofold deviation from the line. Point estimate and 95% CI
burden (ELB) per crypt. Samples are arranged horizontally as in Fig. 1b; harbour                                                                                                                                              of the regression slope (k), FVE and range of end-of-lifespan burden are
porpoise samples were excluded owing to the age of the sampled individual                                                                                                                                                     indicated. d, Allometric regression and linear regression of lifespan-adjusted
being unknown. b, Left, allometric regression of somatic mutation rate on                                                                                                                                                     residuals, for somatic mutation rate and body mass (elements as described in b).
lifespan. Right, regression of body-mass-adjusted residuals for somatic                                                                                                                                                       e, Free-intercept LME regression of somatic mutation rate on log-transformed
mutation rate and lifespan (partial correlation; Methods). Regression was                                                                                                                                                     body mass. The y axis shows mean mutation rates per species, although rates
performed using mean mutation rates per species. Shaded areas represent 95%                                                                                                                                                   per crypt were used in the regression. Shaded area indicates 95% bootstrap
confidence intervals (CI) of regression lines. FVE and P values (by F-test) are                                                                                                                                               interval of the regression line (n = 10,000 replicates). Point estimates of the
indicated (note that, for simple linear regression, FVE = R 2). The dashed line                                                                                                                                               regression intercept and slope, and FVE, are indicated. f, FVE values for
denotes a reference slope of –1. c, Zero-intercept LME regression of somatic                                                                                                                                                  free-intercept LME models using 1/lifespan or other life-history variables
mutation rate on inverse lifespan (1/lifespan), presented on the scale of                                                                                                                                                     (alone or combined with 1/lifespan) as explanatory variables. Error bars
untransformed lifespan (x axis). For simplicity, the y axis shows mean mutation                                                                                                                                               indicate 95% bootstrap intervals (n = 10,000).
rates per species, although rates per crypt were used in the regression. The

                                                                                                                                                                                                                                                                                                                  Nature | Vol 604 | 21 April 2022 | 521
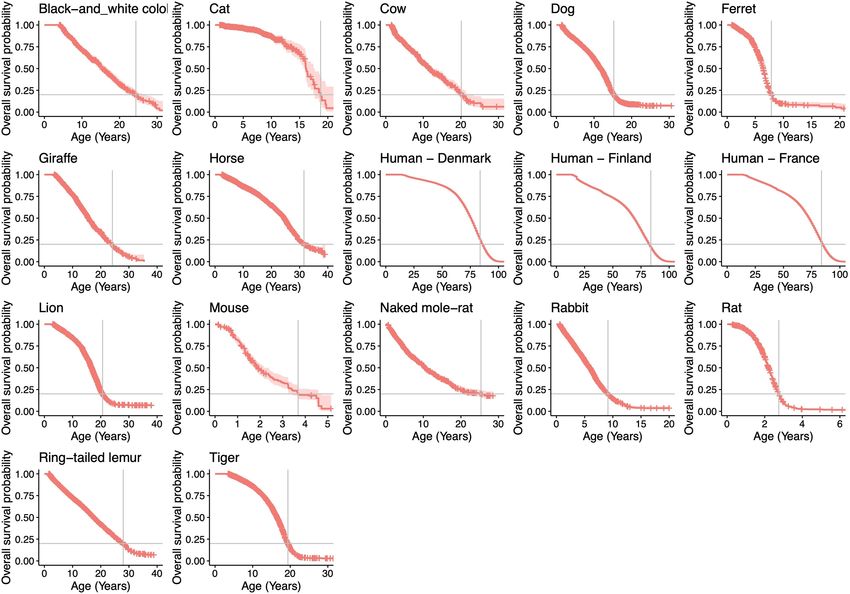
Somatic mutation rates scale with lifespan across mammals
Article
Table 1 | Variation in adult body mass, lifespan, somatic                                the protein-coding mutation rate, which may be a better proxy for the
mutation rate and end-of-lifespan mutation burden across                                 functional effect of somatic mutations (85% of variance explained; ELB:
the 16 mammalian species surveyed                                                        31 coding substitutions per crypt) (Extended Data Fig. 11, Methods).
                                                                                            We next examined the association between somatic mutation rates
Variable                           Minimum          Maximum             Fold variation
                                                                                         and adult body mass, which is known to be a common confounder in cor-
Adult mass (g)                     20.50            800,000.00          39,024.39        relations that involve lifespan40,41. An anticorrelation between somatic
Lifespan (years)                   2.75             83.67               30.44            mutation rates and body mass may be expected if the modulation of
Mutation rate per year             47.12            796.42              16.90            cancer risk across species of vastly different sizes has been a major
(substitutions per genome)                                                               factor in the evolution of somatic mutation rates. We observed that
End-of-lifespan burden             1,828.08         5,378.73            2.94             log-transformed adult body mass was less strongly associated with
(substitutions per genome)                                                               somatic substitution rates than the inverse of lifespan (allometric regres-
Species-level estimates are provided in Supplementary Tables 3 and 6.                    sion FVE = 0.21, Fig. 3d; LME regression FVE = 0.44, Fig. 3e). Given that
                                                                                         lifespan is correlated with body mass, we performed two tests to assess
                                                                                         whether body mass explained any variation in somatic mutation rates
sequence context and mutation rate variation across genes, we used                       that was not explained by lifespan. First, including both the inverse of
the dNdScv model38 (Methods). Although the limited number of coding                      lifespan and log-transformed adult body mass in the regression model
somatic mutations observed in most species precluded an in-depth analy-                  suggested that body mass does not explain a significant amount of
sis of selection, exome-wide dN/dS ratios for somatic substitutions were                 variance in somatic mutation rates across species after accounting for
not significantly different from unity in any species, in line with previous             the effect of lifespan (likelihood ratio tests: P = 0.16 for body mass on
findings in humans8 (Extended Data Fig. 9). Gene-level analysis did not                  a model with lifespan; P < 10–4 for lifespan on a model with body mass;
find genes under significant positive selection in any species, although                 Fig. 3f, Methods). Second, partial correlation analyses using allometric
larger studies are likely to identify rare cancer-driver mutations8.                     regressions further confirmed that the association between somatic
                                                                                         mutation rates and lifespan is unlikely to be mediated by the effect of
                                                                                         body mass on both variables (lifespan residuals: P = 3.2 × 10⁻⁶, FVE = 0.82,
Correlation with life-history traits                                                     Fig. 3b; body mass residuals: P = 0.39, FVE = 0.06, Fig. 3d; Methods).
Whereas similar mutational processes operate across the species sur-                        The fact that the variation in somatic mutation rates across species
veyed, the mutation rate per genome per year varied widely. Across                       appears to be dominated by lifespan rather than body size is also appar-
the 15 species with age information, we found that substitution rates                    ent when looking at particularly informative species. Giraffe and naked
per genome ranged from 47 substitutions per year in humans to 796                        mole-rat, for instance, have similar somatic mutation rates (99 and 93
substitutions per year in mice, and indel rates from 2.5 to 158 indels per               substitutions per year, respectively), in line with their similar lifespans
year, respectively (Fig. 3a, Supplementary Table 4, Methods).                            (80th percentiles: 24 and 25 years, respectively), despite a difference
   To investigate the relationship between somatic mutation rates,                       of around 23,000-fold in adult body mass (Fig. 3c, e). Similarly, cows,
lifespan and other life-history traits, we first estimated the lifespan                  giraffes and horses weigh much more than an average human, and yet
of each species using survival curves. We used a large collection of                     have somatic mutation rates that are several fold higher, in line with
mortality data from animals in zoos to minimize the effect of extrin-                    expectation from their lifespan but not their body mass. Altogether, the
sic mortality (Extended Data Fig. 10). We defined lifespan as the age                    weak correlation between body mass and somatic mutation rates after
at which 80% of individuals reaching adulthood have died, to reduce                      correction for lifespan suggests that the evolution of larger body sizes
the effects of outliers and variable cohort sizes that affect maximum                    may have relied on alternative or additional strategies to limit cancer
lifespan estimates39 (Methods). Notably, we found a tight anticor-                       risk, as has been speculated24,42 (Supplementary Note 2). Of note, the
relation between somatic mutation rates per year and lifespan across                     low somatic mutation rate of naked mole-rats, which is unusual for their
species (Fig. 3b). A log-log allometric regression yielded a strong                      body mass but in line with their long lifespan (Fig. 3c, e), might contrib-
linear anticorrelation between mutation rate per year and lifespan                       ute to the exceptionally low incidence rates of cancer in this species43.
(fraction of inter-species variance explained (FVE) = 0.85, P = 1 × 10⁻⁶),                  We found similar results for other life-history variables that have been
with a slope close to and not significantly different from –1. This sup-                 proposed to correlate with lifespan, namely basal metabolic rate (BMR)
ports a simple model in which somatic mutation rates per year are                        and litter size44 (Fig. 3f). With the caveat that estimates for these variables
inversely proportional to the lifespan of a species (rate ∝ 1/lifespan),                 vary in quality, they showed weaker correlations with the somatic mutation
such that the number of somatic mutations per cell at the end of the                     rate as single predictors, and small non-significant increases in explana-
lifespan (the end-of-lifespan burden; ELB) is similar in all species.                    tory power when considered together with lifespan (likelihood ratio tests:
   To further study the relationship between somatic mutation rates                      P = 0.92 for litter size; P = 0.083 for log-BMR; P = 0.79 for allometric BMR
and life-history variables, we used linear mixed-effects (LME) regres-                   residuals; Fig. 3f, Methods). We note that the results above are robust to
sion models. These models account for the hierarchical structure of                      the use of alternative measures of the somatic mutation rate, including
the data (with multiple crypts per individual and multiple individuals                   the rate per exome or mutations per Mb (Extended Data Fig. 11, Methods);
per species), as well as the heteroscedasticity of somatic mutation rate                 alternative estimates of lifespan, including maximum lifespan (Extended
estimates across species (Methods). Using these models, we estimated                     Data Fig. 12, Methods); alternative regression models, including a Bayesian
that the inverse of lifespan explained 82% of the inter-species variance                 hierarchical model and a phylogenetic generalised least-squares regres-
in somatic substitution rates (rate = k/lifespan) (P = 2.9 × 10⁻⁹; Fig. 3c),             sion, which accounts for the effect of phylogenetic relationships (Extended
with the slope of this regression (k) representing the mean estimated                    Data Fig. 13a, b, Methods); and bootstrapping analyses at the level of indi-
ELB across species (3,206.4 substitutions per genome per crypt, 95%                      viduals or species (Extended Data Fig. 13c, Methods).
confidence interval 2,683.9–3,728.9). Of note, despite uncertainty
in the estimates of both somatic mutation rates and lifespans, and
despite the diverse life histories of the species surveyed—including                     Mutational processes and lifespan
around 30-fold variation in lifespan and around 40,000-fold variation in                 To investigate whether a single biological process could drive the asso-
body mass—the estimated mutation load per cell at the end of lifespan                    ciation between somatic mutation rates and lifespan, we analysed each
varied by only around threefold across species (Table 1). Analogous                      mutational signature separately. SBS1, SBSB/5 and SBSC/18 are believed
results were obtained when repeating the analysis with estimates of                      to result from different forms of DNA damage and are expected to be

522 | Nature | Vol 604 | 21 April 2022
Somatic mutation rates scale with lifespan across mammals
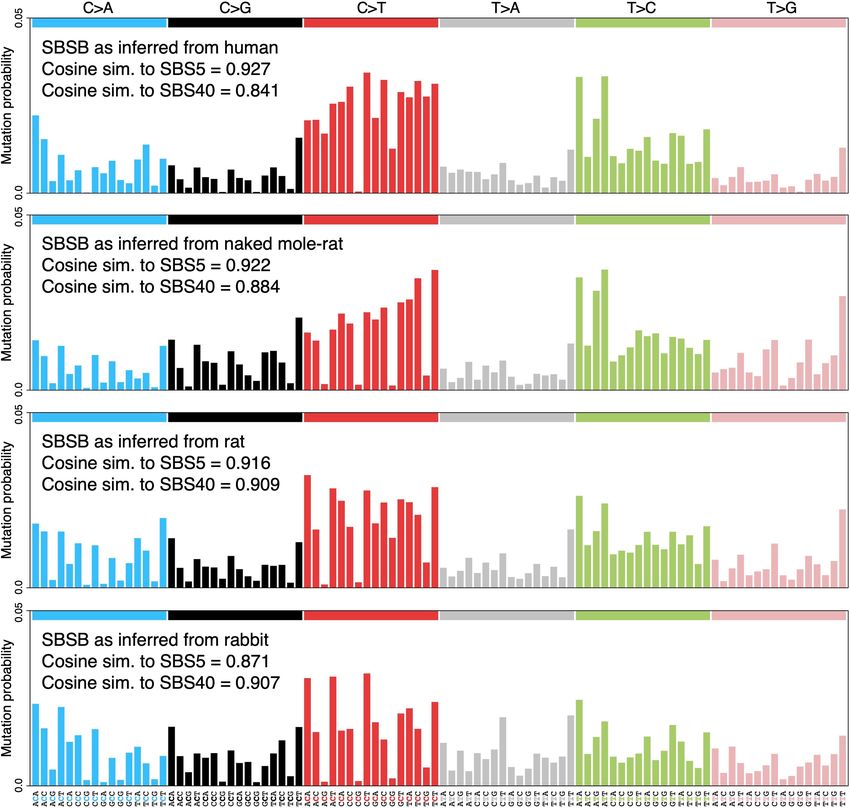
400                                                                                                                            that are believed to result from mitochondrial DNA (mtDNA) replication
SBS1 mutations per genome per year

                                                                                         SBSB mutations per genome per year
                                                          k = 2,129.3
                                                                                                                              250                                        errors rather than DNA damage46 (Extended Data Fig. 14b). Although the
                                                                                                                                             k = 673.0
                                          300             95% CI: 1,687.2–2,571.4
                                                                                                                              200            95% CI: 530.8–815.1         low number of mitochondrial mutations detected per species precludes
                                                          FVE = 0.69                                                                         FVE = 0.85                  a detailed analysis, the estimated number of somatic mutations per copy
                                                          ELB: 870.9–3,423.9                                                                 ELB: 397.6–1,612.5
                                          200
                                                                                                                              150                                        of mtDNA also appears to show an anticorrelation with lifespan. Across
                                                                                                                              100
                                                                                                                                                                         species, we obtained an average of 0.23 detectable mutations per copy
                                          100                                                                                                                            of the mitochondrial genome by the end of lifespan (Fig. 4, Methods)—a
                                                                                                                               50                                        considerable burden given the coding-sequence density and the func-
                                            0                                                                                   0
                                                                                                                                                                         tional relevance of the mitochondrial genome.

                                          300
SBSC mutations per genome per year

                                                                                                                              150
                                          250             k = 393.7
                                                                                         Indels per genome per year
                                                                                                                                             k = 374.1                   Discussion
                                                          95% CI: 224.1–563.2                                                                95% CI: 267.4–480.8
                                          200             FVE = 0.30                                                                         FVE = 0.78                  Using whole-genome sequencing of 208 colorectal crypts from 56
                                                                                                                              100
                                                          ELB: 113.4–1,171.3                                                                 ELB: 171.8–801.9            individuals, we provide insights into the somatic mutational landscape
                                          150
                                                                                                                                                                         of 16 mammalian species. Despite their different diets and life histo-
                                          100                                                                                  50
                                                                                                                                                                         ries, we found considerable similarities in their mutational spectra.
                                           50
                                                                                                                                                                         Three main mutational signatures explain the spectra across species,
                                                                                                                                                                         albeit with varying contributions and subtle variations in the profile
                                            0                                                                                   0
                                                                                                                                    0   20          40         60   80
                                                                                                                                                                         of signature SBSB. These results suggest that, at least in the colorectal
mtDNA mutations per mtDNA copy per year

                                                                                                                                              Lifespan (years)           epithelium, a conserved set of mutational processes dominate somatic
                                          0.08            k = 0.23                                                                                                       mutagenesis across mammals.
                                                          95% CI: 0.21–0.26                                                                                                 The most notable finding of this study is the inverse scaling of somatic
                                                          FVE = 0.94
                                          0.06
                                                          ELB: 0.00–0.85                                                                                                 mutation rates with lifespan—a long-standing prediction of the somatic
                                                                                                                                                                         mutation theory of ageing11,27. Considering evolutionary and mechanis-
                                          0.04
                                                                                                                                                                         tic models of ageing together provides a framework for discussing the
                                          0.02
                                                                                                                                                                         possible implications of these results for ageing (see Supplementary
                                                                                                                                                                         Note 1). Jointly, these models predict ageing to be multifactorial, with
                                            0                                                                                                                            multiple forms of molecular and cellular damage contributing to organ-
                                                 0   20         40         60       80
                                                          Lifespan (years)
                                                                                                                                                                         ismal ageing owing to evolutionary limits to selection acting on the rates
                                                                                                                                                                         of these processes. The inverse scaling of somatic mutation rates and
Fig. 4 | Association between mutation rate subtypes and species lifespan.                                                                                                lifespan is consistent with somatic mutations contributing to ageing
Zero-intercept LME regression of somatic rates of signature-specific
                                                                                                                                                                         and with somatic mutation rates being evolutionarily constrained,
substitutions, indels and mtDNA mutations on inverse lifespan (1/lifespan),
                                                                                                                                                                         although we discuss alternative explanations below. This interpreta-
presented on the scale of untransformed lifespan (x axis). For simplicity, y axes
                                                                                                                                                                         tion is also supported by studies reporting more efficient DNA repair
present mean mutation rates per species, although mutation rates per crypt
were used in the regressions. The darker shaded areas indicate 95% confidence
                                                                                                                                                                         in longer-lived species47,48. Somatic mutations could contribute to
intervals (CI) of the regression lines, and the lighter shaded areas mark a                                                                                              ageing in different ways. Traditionally, they have been proposed to
twofold deviation from the regression lines. Point estimates and 95% CI of the                                                                                           contribute to ageing through deleterious effects on cellular fitness11,49,
regression slope (k), fraction of inter-species variance explained by for each                                                                                           but recent findings question this assumption (Supplementary Note 1).
model (FVE) and ranges of end-of-lifespan burden (ELB) are indicated.                                                                                                    Instead, the discovery of widespread clonal expansions in ageing human
                                                                                                                                                                         tissues19,50–52 raises the possibility that some somatic mutations con-
                                                                                                                                                                         tribute to ageing by driving clonal expansions of functionally altered
subject to different DNA repair pathways18,33. They also appear to differ                                                                                                cells at a cost to the organism49,53,54. Examples include the possible links
in their association with the rate of cell division in humans, with SBS1                                                                                                 between clonal haematopoiesis and cardiovascular disease54; between
being more common in fast-proliferating tissues, such as colon and                                                                                                       mutations in liver disease and insulin resistance55; and between driver
embryonic or foetal tissues, and SBS5 dominating in post-mitotic cells                                                                                                   mutations in cavernomas and brain haemorrhages49,53,56. Detailed stud-
in the absence of cell division14,18,20. Overall, we found clear anticor-                                                                                                ies on the extent and effect of somatic mutations and clonal expansions
relations between mutation rates per year and lifespan for the three                                                                                                     on age-related diseases and ageing phenotypes may help to clarify
substitution signatures and for indels, suggesting that a single biologi-                                                                                                the precise role—if any—of somatic mutations in ageing. Even if clear
cal process or DNA repair pathway is unlikely to be responsible for this                                                                                                 causal links between somatic mutations and ageing are established,
association (Fig. 4). The total mutation burden also appears to show a                                                                                                   ageing is likely to be multifactorial. Other forms of molecular damage
closer fit with lifespan than individual mutational processes, as meas-                                                                                                  involved in ageing could be expected to show similar anticorrelations
ured by the range of end-of-lifespan burden for each process across                                                                                                      with lifespan and, indeed, such anticorrelations have been reported
species (Fig. 4). This might be expected if the observed anticorrelation                                                                                                 for telomere shortening and protein turnover57,58.
were the result of evolutionary pressure on somatic mutation rates.                                                                                                         Alternative non-causal explanations for the observed anticorrelation
   DNA damage and somatic mutations in the mitochondrial genome                                                                                                          between somatic mutation rates and lifespan need to be considered.
have also attracted considerable interest in the ageing field45. Our                                                                                                     One alternative explanation is that cell division rates could scale with
whole-genome sequencing of individual crypts provided high coverage                                                                                                      lifespan and explain the observed somatic mutation rates. Available
of the mitochondrial genome, ranging from 2,188- to 29,691-fold. Nor-                                                                                                    estimates of cell division rates, although imperfect and limited to a few
malized against the nuclear coverage, these data suggest that colorectal                                                                                                 species, do not readily support this argument (Methods). More impor-
crypts contain on the order of around 100–2,000 mitochondrial genomes                                                                                                    tantly, studies in humans have shown that cell division rates are not a
per cell (Extended Data Fig. 14a). Using a mutation-calling algorithm that                                                                                               major determinant of somatic mutation rates across human tissues14,18.
is sensitive to low-frequency variants, we found a total of 261 mitochon-                                                                                                Another alternative explanation for the observed anticorrelation might
drial mutations across 199 crypts (Extended Data Fig. 14a, Methods). The                                                                                                 be that selection acts to reduce germline mutation rates in species with
mutational spectra across species appeared broadly consistent with that                                                                                                  longer reproductive spans, which in turn causes an anticorrelation of
observed in humans, with a dominance of C>T and A>G substitutions                                                                                                        somatic mutation rates and lifespan. Although selective pressure on

                                                                                                                                                                                                          Nature | Vol 604 | 21 April 2022 | 523
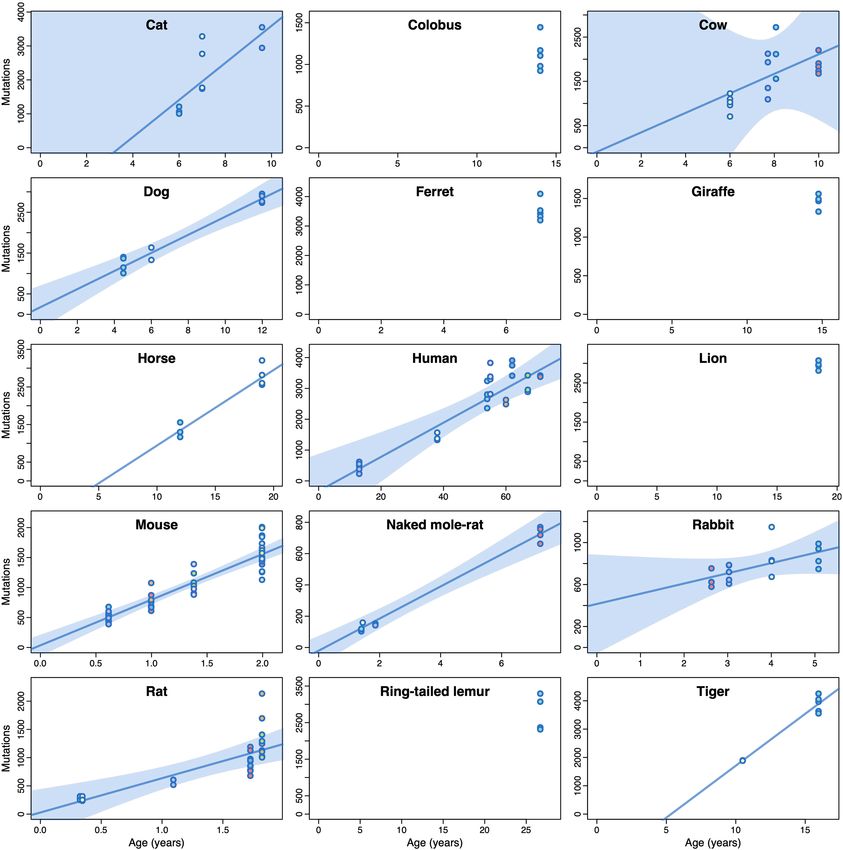
Somatic mutation rates scale with lifespan across mammals
Article
germline mutation rates could influence somatic mutation rates, it is                             26. Schumacher, B., Pothof, J., Vijg, J. & Hoeijmakers, J. H. J. The central role of DNA damage
                                                                                                      in the ageing process. Nature 592, 695–703 (2021).
unlikely that germline mutation rates tightly determine somatic muta-                             27. Burnet, M. Intrinsic Mutagenesis: a Genetic Approach to Ageing (Springer, 1974).
tion rates: somatic mutation rates in humans are 10–20 times higher                               28. Kirkwood, T. B. & Holliday, R. The evolution of ageing and longevity. Proc. R. Soc. B 205,
than germline mutation rates, show variability across cell types and                                  531–546 (1979).
                                                                                                  29. Ellis, P. et al. Reliable detection of somatic mutations in solid tissues by laser-capture
are influenced by additional mutational processes18,20. Overall, the                                  microdissection and low-input DNA sequencing. Nat. Protoc. 16, 841–871 (2021).
strong scaling of somatic mutation rates with lifespan across mammals,                            30. Alexandrov, L. B. et al. The repertoire of mutational signatures in human cancer. Nature
despite the different rates between germline and soma and the variable                                578, 94–101 (2020).
                                                                                                  31. Gori, K. & Baez-Ortega, A. sigfit: flexible Bayesian inference of mutational signatures.
contributions of different mutational processes across species, sug-                                  Preprint at bioRxiv https://doi.org/10.1101/372896 (2020).
gests that somatic mutation rates themselves have been evolutionarily                             32. Lindahl, T. & Nyberg, B. Heat-induced deamination of cytosine residues in
constrained, possibly through selection on multiple DNA repair path-                                  deoxyribonucleic acid. Biochemistry 13, 3405–3410 (1974).
                                                                                                  33. Zou, X. et al. A systematic CRISPR screen defines mutational mechanisms underpinning
ways. Alternative explanations need to be able to explain the strength                                signatures caused by replication errors and endogenous DNA damage. Nat. Cancer 2,
of the scaling despite these differences.                                                             643–657 (2021).
   Altogether, this study provides a detailed description of somatic                              34. Wilson, M. R. et al. The human gut bacterial genotoxin colibactin alkylates DNA. Science
                                                                                                      363, eaar7785 (2019).
mutation across mammals, identifying common and variable features                                 35. Pleguezuelos-Manzano, C. et al. Mutational signature in colorectal cancer caused by
and shedding light on long-standing hypotheses. Scaled across the tree                                genotoxic pks+ E. coli. Nature 580, 269–273 (2020).
of life and across tissues, in species with markedly different physiolo-                          36. Smati, M. et al. Quantitative analysis of commensal Escherichia coli populations reveals
                                                                                                      host-specific enterotypes at the intra-species level. MicrobiologyOpen 4, 604–615 (2015).
gies, life histories, genome compositions and mutagenic exposures,                                37. Oliero, M. et al. Oligosaccharides increase the genotoxic effect of colibactin produced by
similar studies promise to transform our understanding of somatic                                     pks+ Escherichia coli strains. BMC Cancer 21, 172 (2021).
mutation and its effects on evolution, ageing and disease.                                        38. Martincorena, I. et al. Universal patterns of selection in cancer and somatic tissues. Cell
                                                                                                      171, 1029–1041 (2017).
                                                                                                  39. Moorad, J. A., Promislow, D. E. L., Flesness, N. & Miller, R. A. A comparative assessment of
                                                                                                      univariate longevity measures using zoological animal records. Aging Cell 11, 940–948
Online content                                                                                        (2012).
                                                                                                  40. Speakman, J. R. Correlations between physiology and lifespan—two widely ignored
Any methods, additional references, Nature Research reporting sum-                                    problems with comparative studies. Aging Cell 4, 167–175 (2005).
maries, source data, extended data, supplementary information,                                    41. de Magalhães, J. P., Costa, J. & Church, G. M. An analysis of the relationship between
                                                                                                      metabolism, developmental schedules, and longevity using phylogenetic independent
acknowledgements, peer review information; details of author contri-
                                                                                                      contrasts. J. Gerontol. A 62, 149–160 (2007).
butions and competing interests; and statements of data and code avail-                           42. Vazquez, J. M. & Lynch, V. J. Pervasive duplication of tumor suppressors in Afrotherians
ability are available at https://doi.org/10.1038/s41586-022-04618-z.                                  during the evolution of large bodies and reduced cancer risk. eLife 10, e65041 (2021).
                                                                                                  43. Smith, E. S. J., Schuhmacher, L.-N. & Husson, Z. The naked mole-rat as an animal
                                                                                                      model in biomedical research: current perspectives. Open Access Anim. Physiol. 7,
1.  Garcia, A. M. et al. Age- and temperature-dependent somatic mutation accumulation in              137–148 (2015).
    Drosophila melanogaster. PLoS Genet. 6, e1000950 (2010).                                      44. Millar, J. S. & Zammuto, R. M. Life histories of mammals: an analysis of life tables. Ecology
2.  Behjati, S. et al. Genome sequencing of normal cells reveals developmental lineages and           64, 631–635 (1983).
    mutational processes. Nature 513, 422–425 (2014).                                             45. Kauppila, T. E. S., Kauppila, J. H. K. & Larsson, N.-G. Mammalian mitochondria and aging:
3.  Milholland, B. et al. Differences between germline and somatic mutation rates in humans           an update. Cell Metab. 25, 57–71 (2017).
    and mice. Nat. Commun. 8, 15183 (2017).                                                       46. Ju, Y. S. et al. Origins and functional consequences of somatic mitochondrial DNA
4. Schmid-Siegert, E. et al. Low number of fixed somatic mutations in a long-lived oak tree.          mutations in human cancer. eLife 3, e02935 (2014).
    Nat. Plants 3, 926–929 (2017).                                                                47. Hall, K. Y., Hart, R. W., Benirschke, A. K. & Walford, R. L. Correlation between
5.  Jager, M. et al. Deficiency of nucleotide excision repair is associated with mutational           ultraviolet-induced DNA repair in primate lymphocytes and fibroblasts and species
    signature observed in cancer. Genome Res. 29, 1067–1077 (2019).                                   maximum achievable life span. Mech. Ageing Dev. 24, 163–173 (1984).
6.  Orr, A. J. et al. A phylogenomic approach reveals a low somatic mutation rate in a            48. Zhang, L. et al. Maintenance of genome sequence integrity in long- and short-lived
    long-lived plant. Proc. R. Soc. B 287, 20192364 (2020).                                           rodent species. Sci. Adv. 7, eabj3284 (2021).
7.  López, E. H. & Palumbi, S. R. Somatic mutations and genome stability maintenance in           49. Smith, J. M. Review lectures on senescence—I. The causes of ageing. Proc. R. Soc. B 157,
    clonal coral colonies. Mol. Biol. Evol. 37, 828–838 (2020).                                       115–127 (1962).
8.  Lee-Six, H. et al. The landscape of somatic mutation in normal colorectal epithelial cells.   50. Jaiswal, S. et al. Age-related clonal hematopoiesis associated with adverse outcomes.
    Nature 574, 532–537 (2019).                                                                       N. Engl. J. Med. 371, 2488–2498 (2014).
9.  Stratton, M. R., Campbell, P. J. & Futreal, P. A. The cancer genome. Nature 458, 719–724      51. Martincorena, I. et al. Somatic mutant clones colonize the human esophagus with age.
    (2009).                                                                                           Science 362, 911–917 (2018).
10. Szilard, L. On the nature of the aging process. Proc. Natl Acad. Sci. USA 45, 30–45           52. Yokoyama, A. et al. Age-related remodelling of oesophageal epithelia by mutated cancer
    (1959).                                                                                           drivers. Nature 565, 312–317 (2019).
11. Morley, A. A. The somatic mutation theory of ageing. Mutat. Res. 338, 19–23 (1995).           53. Ren, A. A. et al. PIK3CA and CCM mutations fuel cavernomas through a cancer-like
12. Vijg, J. & Dong, X. Pathogenic mechanisms of somatic mutation and genome mosaicism                mechanism. Nature 594, 271–276 (2021).
    in aging. Cell 182, 12–23 (2020).                                                             54. Jaiswal, S. & Libby, P. Clonal haematopoiesis: connecting ageing and inflammation in
13. Welch, J. S. et al. The origin and evolution of mutations in acute myeloid leukemia. Cell         cardiovascular disease. Nat. Rev. Cardiol. 17, 137–144 (2020).
    150, 264–278 (2012).                                                                          55. Ng, S. W. K. et al. Convergent somatic mutations in metabolism genes in chronic liver
14. Blokzijl, F. et al. Tissue-specific mutation accumulation in human adult stem cells during        disease. Nature 598, 473–478 (2021).
    life. Nature 538, 260–264 (2016).                                                             56. Jaiswal, S. & Ebert, B. L. Clonal hematopoiesis in human aging and disease. Science 366,
15. Moore, L. et al. The mutational landscape of normal human endometrial epithelium.                 eaan4673 (2019).
    Nature 580, 640–646 (2020).                                                                   57. Swovick, K. et al. Interspecies differences in proteome turnover kinetics are correlated
16. Lodato, M. A. et al. Aging and neurodegeneration are associated with increased                    with life spans and energetic demands. Mol. Cell. Proteomics 20, 100041 (2021).
    mutations in single human neurons. Science 359, 555–559 (2018).                               58. Whittemore, K., Vera, E., Martínez-Nevado, E., Sanpera, C. & Blasco, M. A. Telomere
17. Zhang, L. et al. Single-cell whole-genome sequencing reveals the functional landscape             shortening rate predicts species life span. Proc. Natl Acad. Sci. USA 116, 15122–15127
    of somatic mutations in B lymphocytes across the human lifespan. Proc. Natl Acad. Sci.            (2019).
    USA 116, 9014–9019 (2019).
18. Abascal, F. et al. Somatic mutation landscapes at single-molecule resolution. Nature 593,     Publisher’s note Springer Nature remains neutral with regard to jurisdictional claims in
    405–410 (2021).                                                                               published maps and institutional affiliations.
19. Martincorena, I. et al. Tumor evolution. High burden and pervasive positive selection of
    somatic mutations in normal human skin. Science 348, 880–886 (2015).                                             Open Access This article is licensed under a Creative Commons Attribution
20. Moore, L. et al. The mutational landscape of human somatic and germline cells. Nature                            4.0 International License, which permits use, sharing, adaptation, distribution
    597, 381–386 (2021).                                                                                             and reproduction in any medium or format, as long as you give appropriate
21. Peto, R., Roe, F. J., Lee, P. N., Levy, L. & Clack, J. Cancer and ageing in mice and men.     credit to the original author(s) and the source, provide a link to the Creative Commons license,
    Br. J. Cancer 32, 411–426 (1975).                                                             and indicate if changes were made. The images or other third party material in this article are
22. Vincze, O. et al. Cancer risk across mammals. Nature 601, 263–267 (2022).                     included in the article’s Creative Commons license, unless indicated otherwise in a credit line
23. Peto, R. Epidemiology, multistage models, and short-term mutagenicity tests.                  to the material. If material is not included in the article’s Creative Commons license and your
    Int. J. Epidemiol. 45, 621–637 (2016).                                                        intended use is not permitted by statutory regulation or exceeds the permitted use, you will
24. Tollis, M., Boddy, A. M. & Maley, C. C. Peto’s paradox: how has evolution solved the          need to obtain permission directly from the copyright holder. To view a copy of this license,
    problem of cancer prevention? BMC Biol. 15, 60 (2017).                                        visit http://creativecommons.org/licenses/by/4.0/.
25. López-Otín, C., Blasco, M. A., Partridge, L., Serrano, M. & Kroemer, G. The hallmarks of
    aging. Cell 153, 1194–1217 (2013).                                                            © The Author(s) 2022

524 | Nature | Vol 604 | 21 April 2022
Somatic mutation rates scale with lifespan across mammals
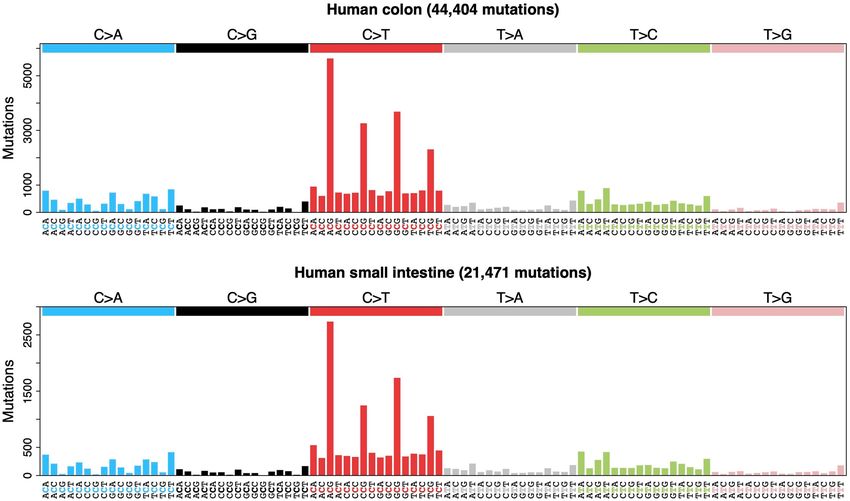
Methods                                                                       Samples were multiplexed and sequenced using Illumina XTEN and
                                                                              Novaseq 6000 machines to generate 150 base pair (bp) paired-end
Data reporting                                                                reads. Samples were sequenced to around 30× depth (Supplementary
No statistical methods were used to predetermine sample size.                 Table 2).
The experiments were not randomized and the investigators were not
blinded to allocation during experiments and outcome assessment.              Sequence read alignment
                                                                              For each species, sequences were aligned to a reference assembly
Ethics statement                                                              (Supplementary Table 2) using the BWA-MEM algorithm59 as imple-
All animal samples were obtained with the approval of the local ethical       mented in BWA v.0.7.17-r1188, with options ‘-T 30 -Y -p -t 8’. The aligned
review committee (AWERB) at the Wellcome Sanger Institute and those           reads were sorted using the bamsort tool from the biobambam2
at the holding institutions.                                                  package (v.2.0.86; gitlab.com/german.tischler/biobambam2), with
                                                                              options ‘fixmates=1 level=1 calmdnm=1 calmdnmrecompindetonly=1
Sample collection                                                             calmdnmreference= outputthreads=7 sortthreads=7’.
We obtained colorectal epithelium and skin samples from a range of            Duplicate reads were marked using the bammarkduplicates2 tool from
sources (Supplementary Table 1). For comparability across species an          biobambam2, with option ‘level = 0’.
approximately 1-cm biopsy of the colorectal epithelium was taken from
the terminal colon during necropsy. All necropsies occurred as soon as        Variant calling
possible post-mortem to minimize tissue and DNA degradation. Tissue           Identification of somatic substitutions and short indels was divided
samples taken later than 24 h post-mortem typically showed extensive          into two steps: variant calling, and variant filtering to remove spuri-
degradation of the colorectal epithelium, making the identification of        ous calls (see ‘Variant filtering’ below). For human colorectal crypts,
colorectal crypts challenging. These samples were also associated with        we obtained previously sequenced and mapped reads from a study in
poor DNA yields and so were not included in the study. Sampled tissue         which colorectal crypts were isolated by LCM8, and processed them
was fixed in PAXgene FIX (PreAnalytiX, Switzerland), a commercially           using the sample variant calling and filtering process that was applied
available fixative, during the necropsy. After 24 h in the fixative at room   to the non-human samples.
temperature, samples were transferred into the PAXgene STABILIZER                Substitutions were identified using the cancer variants through
and stored at –20 °C until further processing.                                expectation maximization (CaVEMan) algorithm60 (v.1.13.15). CaVE-
                                                                              Man uses a naive Bayesian classifier to perform a comparative analysis
Sample processing                                                             of the sequence data from a target and control sample from the same
Samples were processed using a workflow designed for detection of             individual to derive a probabilistic estimate for putative somatic sub-
somatic mutations in solid tissues by laser-capture microdissection           stitutions at each site. The copy number options were set to ‘major
(LCM) using low-input DNA sequencing. For a more detailed descrip-            copy number = 5’ and ‘minor copy number = 2’, as in our experience
tion see the paraffin workflow described in another study29. In brief,        this maximizes the sensitivity to detect substitutions in normal tissues.
PAXgene-fixed tissue samples of the colorectal epithelium were                CaVEMan identifies and excludes germline variants shared in the target
paraffin-embedded using a Sakura Tissue-Tek VIP tissue processor. Sec-        (colorectal crypt) and matched normal (skin or muscle tissue) samples,
tions of 16 µm were cut using a microtome, mounted on PEN-membrane            and produces a list of putative somatic mutations that are present only
slides and stained with Gill’s haematoxylin and eosin by sequential           in the target sample. CaVEMan was run separately for each colorectal
immersion in the following: xylene (two minutes, twice), ethanol (100%,       crypt, using either bulk skin or muscle microdissected from the sam-
1 min, twice), deionized water (1 min, once), Gill’s haematoxylin (10 s,      ple colorectal biopsy as the matched normal control (Supplementary
once), tap water (20 s, twice), eosin (5 s, once), tap water (20 s, once),    Table 2). For two human donors for whom an alternative tissue was not
ethanol (70%, 20 s, twice) and xylene or Neo-Clear, a xylene substitute       available, a colonic crypt not included as a target sample was used as
(20 s, twice).                                                                the matched normal control.
   High-resolution scans were obtained from representative sections              Indels were identified using the Pindel algorithm61 (v.3.3.0), using
of each species. Example images are shown in Fig. 1a, Extended Data           a second sample from the same individual as a matched control. The
Fig. 2. Individual colorectal crypts were isolated from sections on poly-     indel calls produced by Pindel were subsequently re-genotyped using
ethylene naphthalate (PEN) membrane slides by LCM with a Leica LMD7           the vafCorrect tool (https://github.com/cancerit/vafCorrect), which
microscope. Haematoxylin and eosin histology images were reviewed             performs a local sequence assembly to address alignment errors for
by a veterinary pathologist. For some samples we also cut a section of        indels located at the end of sequence reads, and produces corrected
muscle tissue from below the colorectal epithelium of the section to          counts of sequence reads supporting the indel and corrected estimates
use as a germline control for variant calling (Supplementary Table 2).        of variant allele fraction (VAF; the fraction of reads supporting the
Pre- and post-microdissection images of the tissue were recorded for          alternate allele at the variant site).
each crypt and muscle sample taken. Each microdissection was col-
lected in a separate well of a 96-well plate.                                 Variant filtering
   Crypts were lysed using the Arcturus PicoPure Kit (Applied Biosys-         A number of post-processing filters were applied to the variant calls
tems) as previously described8,29. Each crypt then underwent DNA              to remove false positives (Supplementary Fig. 1a, b).
library preparation, without a quantification step to avoid loss of
DNA, following a protocol described previouslyl29. For some animals,          Quality flag filter. CaVEMan and Pindel annotate variant calls using
a PAXgene fixed bulk skin biopsy was used as the germline control.            a series of quality flags, with the ‘PASS’ flag denoting no quality issues
For these skin samples, DNA was extracted using the DNeasy Blood &            affecting the call60,61. Variant calls presenting any flag other than ‘PASS’
Tissue Kit (Qiagen).                                                          were discarded.

Library preparation and sequencing                                            Alignment quality filter. Variants were excluded if more than half of the
Libraries from microdissected samples were prepared using enzymatic           supporting reads were clipped. The library preparation methods create
fragmentation, adapter ligation and whole-genome sequencing follow-           short insert size libraries that can result in reads overlapping. To avoid
ing a method described previously29. Libraries from skin samples were         the risk of double counting mutant reads we used fragment-based sta-
prepared using standard Illumina whole-genome library preparation.            tistics. Variants without at least four high-quality fragments (alignment
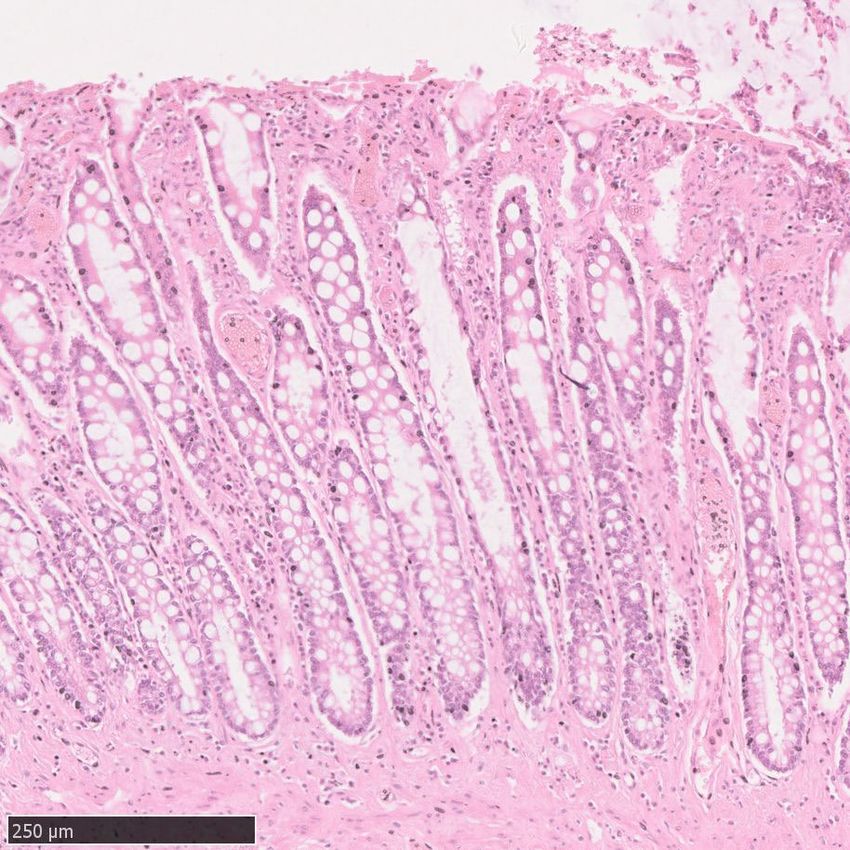
Somatic mutation rates scale with lifespan across mammals
You can also read