SOYBEAN RESEARCH - Volume 11, Number 1: 2013 - (SSRD), Indore
←
→
Page content transcription
If your browser does not render page correctly, please read the page content below
ISSN 0973-1830            Volume 11, Number 1: 2013

        SOYBEAN
        RESEARCH

   Society for Soybean Research and Development
          Directorate of Soybean Research
            Khandwa Road, Indore 452 001
               Madhya Pradesh, India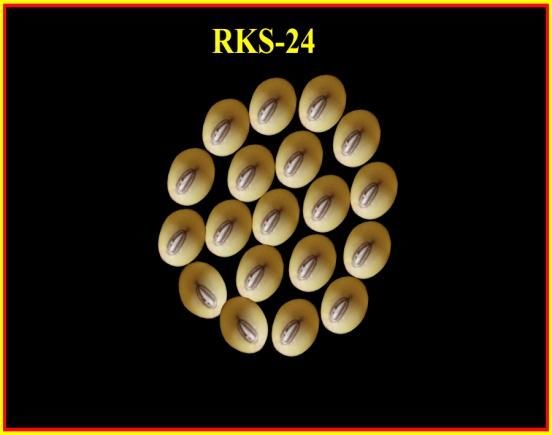
Society for Soybean Research and Development
                                         (Founded in 2003)
                               (Registration No. 03/27/03/07918/04)

EXECUTIVE COUNCIL

President                      : Dr. S. K. Srivastava
Vice President                 : Dr. Girish Kumar Gupta
                               : Dr. Guriqbal Singh
General Secretary              : Dr. Amar Nath Sharma
Joint Secretary                : Dr. S.D. Billore
Treasurer                      : Dr. Mohd. Masaud Ansari
Members                        : Central Zone         : Dr. S.K. Sharma and Dr. Y.Sridhar
                               : North Plain Zone     : Dr. Kamendra Singh
                               : North Hill Zone      : Dr. Jaidev
                               : North Eastern Zone : Dr. (Mrs) Nutan Verma
                               : Southern Zone        : Dr. G.T. Basavaraja

EDITORIAL BOARD
Editor-in-Chief                : Dr. O. P. Joshi
Editor (Crop Improvement)      : Dr. H. N. Pandey, Head (Retd.), IARI Regional Station, Indore
Editor (Crop Production)       : Dr. S. C. Deshmukh, Retd. Prof. (Agronomy),
                                 College of Agriculture, Indore
Editor (Crop Protection)       : Dr. H. C. Phatak, Visiting Professor (Plant Pathology),
                                 DAVV, Indore
Editor (Processing)            : Dr. A. P. Gandhi, Principal Scientist, CIAE, Bhopal

                                   MEMBERSHIP TARIFF

  Annual Subscription           India          Abroad
  Individual                    Rs. 500/-      US$ 125/-
  Students                      Rs. 250/-      UD$ 100/-
  Institutions                  Rs. 2000/-     US$ 200/-
  Corporate                     Rs. 20000/-    US$ 2000/-
  Life Membership               Rs. 3000/-     US$ 1000/-
  (Add Admission Fees Rs. 50/- or US$ 5/- to above subscription)

                                 ADVERTISEMENT TARIFF

  Back cover (inside) colour             Full page               Rs. 7500/-
  Inside page (B&W)                      Full page               Rs. 3000/-
                                         Half page               Rs. 2000/-
  Size                                   Full page               20 x 14 cm
                                         Half page               9 x 14 cm

                                    NAAS RATING 3.4
SOYBEAN RESEARCH
ISSN 0973-1830 Volume 11, Number 1 : 2013
_____________________________________________________________________
CONTENTS
Research papers
Variability and Character Association Studies Among Different Germplasm Sub- 1
groups in Soybean [Glycine max (L.) Merrill]
Dinesh K Agarwal and Gajendra Bhawsar
Effect of Sulphur and Boron Levels on Productivity, Quality and Profitability 14
of Soybean [Glycine max (L.) Merrill] in Vertisols under Rainfed Conditions
M D Vyas and Rupendra Khandwe
Effect of Organic and Inorganic Farming Systems on Physico-chemical 22
Properties of Vertisols under Soybean - Wheat Cropping System
R Gallani, S K Sharma, P Sirothia and O P Joshi
Effect of Gypsum as a Source of Sulphur on Soybean [Glycine max (L.) Merrill] 29
at Farmers Field on Malwa Region of Madhya Pradesh
S K Verma, SRS Raghuwanshi, S C Tiwari and R Jain
Impact of New Water Management Practices on Productivity and 36
Sustainability of Soybean Grown in the Chambal Command Area of South-
Eastern Rajasthan
R S Narolia, Pratap Singh, I N Mathur and L L Panwar
Productivity, Sustainability and Stability of Soybean Based Cropping Systems 43
under Different Tillage Systems
S D Billore, O P Joshi, A Ramesh and A K Vyas
A Study on Farmers’ Seed Replacement Rate of Soybean and Related Problems 58
in Major Soybean Growing States
B U Dupare, S D Billore and S K Verma
Yield Performance of Soybean in Vindhyan Plateau of Madhya Pradesh 66
R K Singh, S R K Singh, T K Singh, U S Gautam and A K DixitShort communications
Assessment of Improved Weeding Technology for Reducing Drudgery of 74
Farm Women while Weeding Soybean Crop
Rekha Tiwari, A K Dixit and S K Deshpande
Effect of Sulphur on Seed Yield, Nutrient Content and Uptake by Soybean 80
[Glycine max (L.) Merrill]
S R S Raghuwanshi, O P S Raghuwanshi, R Umat, G R Ambawatia and K S
Bhargav
84
Pratap Raj 24 (RKS 24) – A High Yielding Variety of Soybean for Rajasthan
R K Mahawar, D S Meena, H R Chaudhary, V P Gupta and Mashiat Ali
An official publication of Society for Soybean Research and Development, Indore
The ‘Soybean Research’ is indexed in Soybean Abstract of CAB International, UK
Society for Soybean Research and Development thankfully acknowledges the
financial assistance received from the Indian Council of Agricultural Research,
New Delhi for printing of the Journal.Soybean Research 11(1): 1-13 (2013)
Variability and Character Association Studies Among Different
Germplasm Sub-groups in Soybean [Glycine max (L.) Merrill]
DINESH K AGARWAL1 and GAJENDRA BHAWSAR2
Directorate of Soybean Research, Khandwa Road, Indore 452 001, Madhya Pradesh
E mail: agarwaldk4@gmail.com
Received: 01.04.2013; Accepted 14.05.2013
ABSTRACT
Principal componenet analysis was carried out on a set of 1680 soybean [Glycine max (L.) Merrill]
germplasm accessions that were evaluated for various morphological and agro-economic traits.
Further, sub-groups based on flower colour, seed coat colour and growth habits were also studied for
their grouping behavior. First three principal components accounted for more than 80 per cent of total
variation in data. Characters like 100 seed weight and seed yield per plant recorded maximum
variability among the germplasm accessions. The distribution of germplasm accessions was scattered
among all the four quadrants signifying the distinctness of germplasm accessions for the recorded traits
indicating the utility of this information to select discreet types among germplasm accessions for further
use in breeding programmes.
Key words: Character association, soybean, variability principal component analysis
Soybean [Glycine max (L.) Merrill], (PCA) developed by Pearson (1901) is a
contributes to 25 per cent to the global mathematical procedure that uses An orthogonal
vegetable oil production and about two transformation to convert a set of
thirds of the world‟s protein concentrate for observations of possibly correlated
livestock feeding and is also a valuable variables into a set of values of linearly
ingredient in formulated feeds for poultry un-correlated variables called principal
and fish. In India it is cultivated in an area of components. It is a data reduction technique
more than 10 million ha area in 2012. The which utilizes information arising from
major soybean growing states are Madhya inherent relationship among a number of
Pradesh, Maharashtra, Rajasthan, Karnataka, related attributes and generates a
Andhra Pradesh and Chattisgarh. few principal components which could
Principal component analysis then easily be deciphered.
1
Senior Scientist; 2 M.Sc. (Ag.) Student, RVSKV, Gwalior (M. P.)
1MATERIAL AND METHODS by taking average. In present investigation,
principal component analysis was taken up
The present investigation was carried among total germplasm evaluated along with
out in the experimental fields of Directorate separately among sub-groups based on
of Soybean Research (ICAR) Indore (Madhya flower colour, seed coat colour and growth
Pradesh) during kharif season of 2011-12. habit. The growth habit is an important trait
Indore is situated between latitude 22°43' N defining suitability of a variety in any
and longitude 75°66' E and at an altitude of production niche while seed coat colour is
555.7 metres above the mean sea level. Indore the trait that affects its market value;
belongs to sub-tropical semi-arid region with moreover these traits are important in
an average annual rainfall of 954.5 mm. Most germplasm studies as categorization
of the rains are received through South West benchmark. The basic purpose of this study
Monsoon during rainy season (mid-June to was to investigate whether variability pattern
third week of September). The total rainfall and character inter-relationship was same
received during the crop season 2011-12 was across these groups or formed a distinct
1377.8 mm with 56 rainy days, the maximum pattern.
temperature ranged from 26.20 to 33.30C,
minimum temperature from 14.80 to 24.50 C RESULTS AND DISCUSSION
and range of relative humidity was 78 to 94.2
per cent. Performing classificatory analysis on
A set of 1680 soybean germplasm a group of entities based on observations on
accessions have been evaluated in multiple variables is a tedious job even with
augmented design. All the recommended an aid of a computer. If entities concerned are
package of practices was followed to harness germplasm accessions, grouping analysis
the maximum potential of genotypes under assumes special importance. The use of
study. The genotypes were planted in a row established multivariate statistical algorithms
(single or double) length of 3 m The is an important strategy for classifying
observations on the following agro- germplasm, ordering variability for a large
economical traits namely, plant height (cm), number of accessions, or analyzing genetic
days to flowering, days to maturity, number relationships among traits in any breeding
of nodes per plant-1, number of branches per materials. Multivariate analytical techniques,
plant-1, number of pod clusters per plant-1, which simultaneously analyze multiple
number of pods per plant-1, seed yield per measurements on each individual under
plant-1 and seed index (g/100 seeds) were investigation, are widely used in analysis of
recorded on five randomly selected plants for genetic diversity irrespective of the dataset
following characters in each genotypes. The (morphological, bio-chemical, or molecular
mean value for the treatment was computed marker data). Only if available
2genetic diversity could be categorized in to also scattered among all the four quadrants
distinct categories along with an insight of signifying the distinctness of germplasm
genetic variability within each sub group, the accessions for all the recorded traits. This
information could be utilized in formulating information can very well be utilized while
a proper breeding strategy in a trait specific selecting discreet types among germplasm
improvement programme. Principal accessions for further use in breeding
Component Analysis (PCA) as a data programmes. The traits that share same sign
reduction technique is one of the most for PCA 1 and PCA 2 are positively
important technique that helps in arriving at correlated and this information can be taken
such meaningful information. account of while formulating selection
In the present investigation, PCA indices. As is evident from Figure 1, seed
analysis was performed for entire collection yield is positively correlated with number of
as well as sub-categories based on flower pod clusters per plant, total number of pods
colour, growth habit, seed coat colour etc. per plant and 100 seed weight. The
Principal component analysis in all these sets accessions having higher number for these
and sub-sets revealed that there is a traits could be utilized in breeding
tremendous variability among the programmes that aim at increasing seed yield
germplasm accessions. There are a number of through associated traits.
genotypes that are scattered far across the Among purple flower accessions also
origin point, manifesting presence of many the trend depicted was very similar to that
distinct types from the average registered in case of whole group analysis
representative. Presence of distinct types (Fig. 2). The first three principal components
among the main set and various sub-sets explained more than 85 per cent variation in
could directly be utilized in secondary data. Among traits, 100 seed weight, seed
selections for the trait of interest or through yield per plant, total number of pods per
hybridization in an appropriate breeding plant and days to flowering recorded
programme. maximum variability among the pink
Among total 1680 germplasm evaluated, flowered germplasm accessions. The
Figure 1 describes that first three principal character association also depicted the same
components describe more than 80 per cent trend as was evident in case of whole group.
of total variation in data. As is evident from Among white flower accession, first three
vector length for various quantitative traits; principal components explained only 60 per
characters like seed yield per plant, total cent of variation among data and biplot
number of pods per plant and days to depicting traits and accessions on PCA 1 and
flowering recorded maximum variability PCA 2 could only explain 50 per cent of
among the germplasm accessions. Similarly, variation through these two axes (Fig. 3). As
the distribution of germplasm accessions is per vector length, highest variability was
3recorded for 100 seed weight, seed yield per Seed coat colour is a factor that
plant, total number of pods per plant and largely determines the consumer preference
days to flowering; but character association towards a variety. Therefore, the
among this group registered a different experimental lot was subdivided into two
pattern. Days to flowering and 100 seed categories of black seeded and yellow/green
weight recorded a much higher significant seeded type to further subject them to PCA
association with seed yield per plant than analysis so as to ascertain the variability
previous two groups (Fig. 3). parameters and character association among
Soybean is a photosensitive crop and these two groups. Among black seeded
has a narrow adaptation to varying climatic types, first three principal components
conditions; hence, the growth habit of explained only 63 per cent of variation
genotypes to a large extent determines its among data and biplot depicting traits and
specific adaptation to a given agro-ecological accessions on PCA 1 and PCA 2 could only
niche. Among growth habit patterns, for explain 42 per cent of variation through these
determinate growth habit, first three two axes (Fig. 6). Traits namely, seed yield
principal components explained only 51 per per plant, total number of pods per plant and
cent of variation among data and biplot days to flowering recorded highest
depicting traits and accessions on PCA 1 and variability among accessions. Germplasm
PCA 2 could only explain 42 per cent of accessions were also scattered among all the
variation through these two axes (Fig. 4). four quadrants signifying the distinctness of
Traits namely, plant height, seed yield per germplasm accessions for all the recorded
plant, total number of pods per plant and traits. Among character association, seed
days to flowering recorded highest yield per plant recorded significantly similar
variability among accessions. Similarly, the trends with total number of pods and
distribution of germplasm accessions is also number of pod clusters per plant (Fig. 6).
very scattered among all the four quadrants Among yellow/green seeded types,
signifying the distinctness of germplasm first three PCA explained 55 per cent of
accessions for all the recorded traits. Among variation in data while the biplot
character association, seed yield per plant depicting first two components accounted
recorded significantly similar trends with for nearly 45 per cent of total variation.
number of pods, number of nodes, leaf Similar to black-seeded types, traits
length: breadth ratio and seed index (Fig. 4). namely, seed yield per plant, total number of
Seed yield like determinate growth habit pods per plant and days to flowering
displayed a greater harmony with total recorded highest variability among
number of pods per plant, number of pod accessions (Fig. 7). While seed yield per plant
clusters per plant and plant height (Fig. 5). among yellow/green seeded type
4appeared to be a function of 100 seed weight, components. The metric observations were
total number of pods, number of pod clusters analysed using principal component analysis
per plant and leaf length breadth ratio (Fig. and significant diversity was observed for
7). these traits. Zafar Iqbal et al. (2008) and Malik
Similar variability has been studied et al. (2011) also in their respective studies
by a number of workers in soybean and other involving soybean germplasm accessions
agricultural crops using principal component recorded significant diversity for yield and
analysis. Broschat (1979) considered PCA as associated traits using principal component
powerful technique for data reduction which analysis. Principal component analysis is
removes inter-relationships among comparatively better than other diversity
components. Results reported by various measures owing to its data reduction abilities
researchers showed multivariate analysis as a which otherwise are possible with other
valid system to deal with germplasm techniques, hence, the classification of a large
collection. Smith et al. (1995) conducted group for a number of attributes becomes
average linkage cluster and principal less cumbersome.
component analyses, and reported the utility The present investigation in light of
of these results in preservation and results obtained and other germplasm
utilization of germplasm. Extent of diversity studies based on Principal Component
and relationship among Brassica juncea Analysis demonstrated that days to
germplasm from Pakistan for 35 flowering, days to maturity, number of
morphological characters in 52 accessions branches, number of nodes, number of pod
were determined by Rabbani et al. (1998) the clusters, total number of pods, number of
using cluster and principal component seeds per plant and 100 seed weight are the
analysis. Ghafoor et al. (2001) studied genetic important agro-economic traits that
diversity in blackgram germplasm individually or as an yield associated trait
accessions. In yet another study involving hold special importance for all the soybean
PCA, Elizabeth et al. (2001) investigated 19 breeders. Principal component analysis
sesbania accessions to characterize them on among the whole set as well as subsets
basis of morphological and agronomic data. emphasized the presence of significant
Ghafoor et al. (2003) evaluated chickpea diversity albeit in varying magnitude among
accessions by using multivariate techniques. different groups for days to flowering, days
The first three principal components with to maturity, number of pod clusters, total
eigenvalues >1 contributed 83.3 per cent of number of pods, seed yield per plant and 100
the variability amongst genotypes. seed weight. This variability could be
Among soybean agronomic traits, significantly harnessed through a soybean
Truong et al. (2005) studied yield and yield breeding programme.
5Fig. 1. Principal Componet Analysis for total germplasm evaluated
6Fig. 2. Principal Componet Analysis for germplasm accessions sub-class –purple flowered
7Fig. 3. Principal Componet Analysis for germplasm accessions sub-class –white flowered
8Fig. 4. Principal Componet Analysis for germplasm accessions sub-class – determinate
9Fig. 5. Principal Componet Analysis for germplasm accessions sub-class – semi and indeterminate
10Fig. 6. Principal Componet Analysis for germplasm accessions sub-class –black seeded
11Fig. 7. Principal Componet Analysis for germplasm accessions sub-class – yellow and green seeded
12REFERENCES
Broschat T K. 1979. Principal component analysis Rabbani M A, Iwabuchi A, Murakami Y, Suzuki T
in horticultural research. Horticulture and Takayanagi K. 1998. Phenotypic
Science 14: 114-17. variation and the relationship among
Ghafoor A, Gulbaaz F N, Afzal M, Ashraf M and mustard (Brassica juncea L.) germplasm
Arshad M. 2003. Inter-relationship between from Pakistan. Euphytica 101: 357-66.
SDS-PAGE markers and agronomic traits in Smith S E, Guarino L, Doss A A and Conta D M.
chickpea (Cicer arietinum L.). Pakistan 1995. Morphological and agronomic
Journal of Botany 35(4): 613-24. affinities among Middle Eastern alfalfas
Ghafoor A, Sharif A, Ahmad Z, Zahid M A and accessions from Oman and Yemen. Crop
Rabbani M A. 2001. Genetic diversity in Science 35: 1188-1194.
blackgram (Vigna mungo (L.) Hepper). Field Truong Ngon T, Jae-Gyun Gwag, Yong-Jin Park,
Crops Research 69: 183-190. and Suk-Ha Lee. 2005. Genetic diversity of
Malik M F A, Ashraf M, Qureshi A S and Khan M soybean pod shape based on elliptic fourier
R. 2011. Investigation and comparison of descriptors. Korean Journal of Crop Science
some morphological traits of the soybean 50(1): 60-6.
populations using cluster analysis. Pakistan Zafar Iqbal, Arshad M, Ashraf M, Naeem R,
Journal of Botany 43(2): 1249-55. Malik M F and Waheed A. 2010. Genetic
Pearson K. 1901. On Lines and Planes of Closest divergence and correlation studies of
Fit to Systems of Points in soybean [Glycine Max (L.) Merrill]
Space(PDF). Philosophical Magazine 2(11): genotypes. Pakistan Journal of Botany 42(2):
559–72. 971-6.
13Soybean Research 11(1): 14-21 (2013)
Effect of Sulphur and Boron Levels on Productivity, Quality and
Profitability of Soybean [Glycine max (L.) Merrill] in Vertisols
under Rainfed Conditions
M D VYAS1 and RUPENDRA KHANDWE2
RAK, College of Agriculture, Rajmata Vijyaraje Scindia Krishi Vishwa
Vidyalaya, Sehore 466 001, Madhya Pradesh
(E-mail: vyasmd@rediffmail.com)
Received: 19.12.2011; Accepted 04.09.2012
ABSTRACT
A field experiment was conducted on clayey loam soil of Sehore, Madhya Pradesh, during kharif
seasons of 2007 and 2008, to study the effect of sulphur and boron levels on physiological parameters,
productivity, soil fertility and economics of soybean under rainfed conditions. The twenty five
treatment combinations comprised of five sulphur levels viz., 0, 10, 20, 30, 40 and five boron levels
viz., 0, 0.5, 1.0, 1.5, 2.0 kg per ha as basal. Progressive increase in sulphur and boron levels increased
crop growth rate, total chlorophyll content, pods per plant and seed yield. But significant response of
sulphur application was obtained up to 20 kg per ha and it gave CGR (10.94 g/m 2/day), total
chlorophyll content (2.55 mg/g/fresh weight), number of pods per plant (24.19), harvest index (42.91
%), and seed yield (2 059 kg/ha), being 33.74, 13.33, 9.35, 4.92 and 12.14 per cent higher, respectively
over control. The crop responded up to 0.5 kg boron per ha which increased the pods per plant by 7.04
and seed yield by 6.33 per cent over non application of boron. CGR and total chlorophyll content were
found significantly superior at 1.5 kg B per ha. The uptake of sulphur in seed (6.82 kg/ha) and straw
(4.8 kg/ha 9) was significantly higher up to 10 kg S per ha. The significant higher value of oil was
obtained at 10 kg S per ha and 0.5 kg B per ha whereas, protein was significantly higher at 30 kg S per
ha and 2.0 kg B per ha. The interaction effect between sulphur and boron in all the parameters was not
significant.
Key words: Boron, economics, nutrient uptake, soybean, sulphur
Soybean (Glycine max L. Merrill) with potential (4.5 tonnes/ha), soybean
its 40-42 per cent protein and 20-22 per cent productivity is much less in India (1.07
oil has already emerged as one of the major tonnes/ha) than the world average of 2.43
oilseed crop in India. In spite of its high yield tonnes per ha (FAOSTAT, 2011).
1Principle Scientist; 2Associate Professor
14Among the factors responsible for low College of Agriculture, Sehore, replicated
productivity, inadequate fertilizer use and three times in factorial randomized block
emerging secondary and micronutrient design. The soil was Vertisols (Chromusterts)
deficiencies play an important role. Several clayey loam with organic carbon content 0.42
workers reported sulphur deficiency in per cent and available N, P2O5 and K2O 210.6,
soybean crop in Madhya Pradesh due to use 15.80 and 285 kg per ha, respectively. Soil
of S–free fertilizers and adoption of high was neutral in reaction (pH 7.50) with initial
yielding varieties that remove more S from status of sulphur 5 ppm and boron 1.09 ppm.
soil. Besides, sulphur requirement of soybean The twenty-five treatment combination
crop is high which remains uncared because comprised of five sulphur levels viz., 0, 10, 20,
of practice of applying high analysis fertilizer 30, 40 kg per ha and five boron levels viz., 0,
like di-ammonium phosphate. Adequate 0.5, 1.0, 1.5, 2.0 kg per ha as basal application
supply of sulphur has been reported to through gypsum and borax, respectively. A
enhance photosynthetic efficiency and uniform basal dose of NPK fertilizers and all
productivity of Brassica genotypes (Ahmad the recommended package of practices were
and Abdin, 2000). Boron is one of the followed for raising the crop. Seeds of
essential micronutrient and it enhances the soybean „JS 93-05‟ inoculated with
crop yields. It has seen that places of high Bradyrhizobium japonicum and PSB were sown
metabolic activities i.e. cell division, at 45 cm row spacing on 29th June, 2007 and
flowering, fruiting and seed development etc. 27th June, 2008. The total rainfall received
in a plant requiring more quantities of sugar. during the crop season was 766 and 706 mm
It is believed that boron facilitates the in 2007 and 2008, respectively. Chlorophyll
translocation of sugars in plants. Moreover, content in leaves of soybean was determined
due to low crop productivity in the rainfed at 45 DAS using standard procedure
regions, it is assumed that mining of (Yoshida et al., 1972). The crop growth rate
secondary and micronutrients are much less was worked out in between 30 - 45 and 45 -
as compared to irrigated agriculture (Rego et 60 DAS (Watson, 1952), and economics was
al., 2003). A field experiment was, therefore, calculated as per prevailing market prices.
conducted to study the effect of sulphur and
boron levels on crop growth, yield, nutrient RESULTS AND DISCUSSION
uptake, soil fertility status and economics of
soybean. Morphological and physiological parameters
MATERIAL AND METHODS The significant effect of sulphur on
The field experiment was conducted CGR and total chlorophyll content with
during the kharif seasons of 2007 and 2008 at successive increase of S levels was noted.
15While non-significant differences were per cent was recorded with 30 and 40 kg S
recorded with plant height and branches per per ha, respectively over the control. The
plant. The maximum CGR (8.60 and 11.52 difference in yield between 30 and 40 kg S
g/m2/day) was recorded with highest S level per ha levels was statistically non-significant.
40 kg per ha and the lowest (CGR 5.35 and The increased yield under sulphur
8.18 g/m2/day) with control in between 30– fertilization might be ascribed to increased
45 and 45–60 days after sowing (DAS), pods per plant and seeds per pod with
respectively (Table 1). Total chlorophyll heavier seeds. A significant and positive
content differed significantly with S levels 20, correlation was noted in between seed yield
30 and 40 kg per ha over control and 10 kg S with pods per plant (r = 0.99) and seeds per
per ha. Tandon et al. (2007) reported that pod (r = 0.85). It indicated that when sulphur
sulphur functions in many ways resembling was applied, a significant and strong
those of nitrogen in enhancement of crop correlation was observed. Similarly, when
growth and formation of chlorophyll that boron was applied, a significant positive
permits the photosynthesis. correlation was noted between seed yield
Application of boron @ 1.5 and 2.0 kg and pods per plant (r = 0.98). Whereas, non-
per ha increased CGR by 8.70 and 8.85 g per significant weak correlation were observed
m2 per day at 30–45 DAS, 11.08 and 11.16 g between seed yield and seeds per pod (r =
per m2 per day at 45–60 DAS and total 0.64). Thus, significant improvement in yield
chlorophyll content 2.55 and 2.58 mg per g obtained under sulphur fertilization seems to
fresh weight at 45 DAS, respectively. have resulted owing to increased
However, the differences among 0, 0.5 and concentration of sulphur in various parts of
1.0 kg B per ha were recorded statistically plant that helped maintain the critical
non-significant. Molegarrd and Hardman balance of other essential nutrients in the
(1980) also reported that B deficiency caused plant and resulted in enhanced metabolic
flowering and reproductive failure, rosetting processes. Vyas et al. (2006) and Khatik et al.
of terminal buds, small leaves and chlorosis. (1992) also noticed increased yield of soybean
with application of sulphur. Sulphur plays a
Yield and yield attributes vital role in improving vegetative structure
for nutrient absorption, strong sink strength
Sulphur @ 30 and 40 kg per ha through development of reproductive
increased the pods per plant by 11.88 and structures and production of assimilates to
14.33 per cent, seeds per pod by 2.10 and 3.60 fill economically important sink (Sharma and
per cent, harvest index by 6.77 and 7.77 per Singh, 2005).
cent and straw yield by 4.73 and 4.54 per
Application of boron 0.5, 1.0, 1.5 and
cent, respectively over the control (Table 1).
2.0 kg per ha significantly increased
The increase in seed yield by 17.32 and 18.57
16Table 1. Effect of levels of sulphur and boron on morphological, physiological parameters, yield attributes and yield
on soybean (Pooled data of 2007 and 2008)
Treatments Plant Bran- CGR Total Pods Seeds Seed Straw Harvest
height ches (g/m2/day) chlorophyll (No/plant)) (No/pod) yield yield index
(cm) (No/ 30 -45 45 -60 (mg/g fresh (kg/ha) (kg/ha) (%)
plant) DAS DAS weight)
Sulphur level ( kg/ha)
0 59.04 2.32 5.35 8.18 2.25 22.12 3.33 1836 2638 40.87
10 61.14 2.35 7.82 10.88 2.48 23.29 3.36 1937 2675 41.89
20 60.54 2.33 8.10 10.94 2.55 24.19 3.35 2059 2721 42.91
30 61.48 2.38 8.30 11.16 2.78 24.75 3.40 2154 2763 43.64
40 60.47 2.32 8.60 11.52 2.80 25.29 3.45 2177 2758 44.04
SEm (+) 0.91 0.15 0.70 0.90 0.10 0.53 0.04 36.89 88 0.91
CD at 5% NS NS 2.18 2.65 0.30 1.53 NS 105.62 NS 2.57
Boron level (kg/ha)
0 59.54 2.30 5.90 8.38 2.22 22.00 3.30 1910 2661 41.46
0.5 60.64 2.37 6.92 9.30 2.38 23.55 3.45 2031 2624 43.59
1.0 60.57 2.32 7.25 9.45 2.45 24.40 3.38 2054 2733 42.68
1.5 60.08 2.30 8.70 11.08 2.55 24.53 3.39 2064 2734 42.77
2.0 60.84 2.40 8.85 11.16 2.58 25.34 3.38 2102 2801 42.76
SEm (+) 0.91 0.15 0.70 0.90 0.10 0.53 0.04 36.89 88 0.91
CD at 5% NS NS 2.18 2.65 0.30 1.53 NS 105.62 NS NS
17Table 2. Effect of levels of sulphur and boron on available sulphur in soil and sulphur
uptake
Treatments Available S content (%) S uptake (kg/ha)
sulphur Seed Straw Seed Straw Total
at harvest
(ppm)
Sulphur levels ( kg/ha)
0 4.54 0.21 0.12 4.69 3.42 8.11
10 5.14 0.30 0.17 6.82 4.89 11.72
20 6.81 0.40 0.23 9.75 6.55 16.31
30 7.56 0.48 0.30 12.32 8.46 20.78
40 8.12 0.54 0.37 13.53 10.39 23.93
SEm (+) 0.05 0.003 0.002 0.13 0.28 0.22
CD at 5% 0.16 0.009 0.006 0.37 0.63 0.62
Boron levels (kg/ha)
0 6.21 0.35 0.21 8.07 6.19 14.27
0.5 6.44 0.38 0.23 9.12 6.42 15.54
1.0 6.48 0.40 0.24 9.80 6.95 16.58
1.5 6.49 0.41 0.26 10.19 7.38 17.58
2.0 6.55 0.40 0.24 9.93 6.78 16.71
SEm (+) 0.05 0.003 0.002 0.13 0.28 0.22
CD at 5% 0.16 0.009 0.006 0.37 0.63 0.62
to sink and growth of pollen grain thereby
the pods per plant and seed yield but harvest markedly increased seed yield of crops (Sakal
index, straw yield and seeds per pods et al., 1991).
showed statistically non-significant
differences. The significant enhancement in The relationship between nutrients
seed yield with boron application was and soybean yield was worked out by using
obtained only up to 0.5 kg B per ha, the quadratic equation and the relationship
thereafter the response of boron was non- was found to be curvilinear. The equations
significant and all application rates 0.5, 1.0, were as follows.
1.5 and 2.0 kg B per ha remained at par
(Table 1). Ahmad Khan et al. (1990) also Sulphur: Y= 1826 + 14.21x -0.130x2
reported that increase in yield attributes of Boron: Y= 1923 + 185.60x – 51.14 x2
some oilseeds crop with the boron
application. This might be because of the role The physical optimum level of
of boron in fertility improvement and sulphur and boron was worked out to be
translocation of photosynthate from sources 61.78 and 1.81 kg per ha, respectively.
18Table 3. Effect of levels of sulphur and boron on oil and protein content, net returns and
cost benefit ratio (Pooled data of 2007 and 2008)
Treatments Oil content Protein content Net returns B:C ratio
(%) (%) (INR/ha)
Sulphur level (kg/ha)
0 18.02 35.55 18824 2.92
10 19.15 36.66 20388 3.07
20 19.37 37.77 22178 3.24
30 19.75 38.74 23558 3.35
40 19.79 39.66 23910 3.36
SEm (+) 0.01 0.95 -- --
CD at 5% 0.05 2.86 -- --
Boron level (kg/ha)
0 18.62 35.29 21269 3.47
0.5 19.06 37.51 22510 3.41
1.0 19.33 37.76 22114 3.20
1.5 19.36 37.94 21530 3.00
2.0 19.37 38.39 21435 2.86
SEm (+) 0.01 0.95 -- --
CD at 5% 0.05 2.86 -- --
However, the economic optimum level of kg S per ha. The crop fertilized with 10, 20, 30
sulphur and boron was 56.83 and 1.58 kg per and 40 kg S per ha recorded 44.44, 100.99,
ha with the yield levels of 2, 213.70 and 2, 156.11 and 194.94 per cent higher total S
088.58 kg per ha, respectively. uptake, respectively over the control (8.112
kg/ha). Increase in net depletion of soil S was
Nutrient uptake not only by the removal of the seed, but also
by the straw from the field (Tandon et al.,
Sulphur application induced marked 2007). Similarly the increase in B levels from
increase in the S content and uptake in seed 0 to 2.0 kg per ha, improved the S content in
and straw. Sulphur levels 10 to 40 kg per ha seed and straw and S uptake by seed, straw
recorded significant differences with S and total biomass produced but the margin
content in seed and straw and S uptake by between successive level was significant only
seed, straw and total uptake over control. up to 1.5 kg B per ha.
Successive increase in S fertilization Available S at harvest ranged from
significantly increased the S uptake up to 40 5.14 to 8.12 and 6.44 to 6.55 ppm with
19application of 10 to 40 kg S per ha and 0.5 to reported by Chaturvedi et al. (2010).
2.0 kg B per ha, respectively (Table 2). This
increase in S can be ascribed to the influence Economics
of applied S on availability of S in the soil
and its extraction by plants as well as Among the S levels, maximum net
increase in crop yield returns was recorded with 40 kg S per ha,
whereas benefit cost ratio 3.36 and 3.35 was
Quality parameters mostly equal with 40 and 30 kg S per ha,
respectively. In case of boron, net returns
The increasing levels of sulphur increased with successive fertilization rate.
significantly improved the quality of soybean However, the cost benefit ratio recorded with
in terms of protein and oil content. The control was superior 3.47 followed by 3.41,
increase in oil content by 1.77 percentage 3.20, 3.00 and 2.86 with 0.5, 1.0, 1.5 and 2.0 kg
points and protein by 4.11 percentage points B per ha.
with the application of 40 kg S per ha over This behaviour of economic
control (18.02 and 35.55 %, respectively) was parameters due to S and B levels was change
noticed (Table 3). Increase in oil content due in marginal seed yield of the crop with
to sulphur application can be attributed to successive increase in fertilizer nutrient and
the key role played by sulphur in relative cost of inputs in relation to output.
biosynthesis of oil in oilseed plants. The Tandon et al. (2007) also reported that S
increase in protein content may be accounted application is highly profitable as shown by
for the increase in synthesis of sulphur value cost ratio of 21.2 in soybean under field
containing amino acids. Such beneficial condition.
effects of sulphur fertilization were also Thus, it may be concluded that
reported by Sharma (2003), Tandon et al. application of sulphur @ 20 kg per ha and
(2007) and Raghuwanshi et al. (2009). Boron boron @ 0.5 kg per ha were found beneficial
application up to 2 kg per ha increased the for enhancing soybean productivity in
protein and oil content but was at par with Vertisols under rainfed conditions of Madhya
1.5 kg per ha dose. Similar results have also Pradesh.
REFERENCES
Ahmad A and Abdin M Z. 2000. Photosynthesis Ahmad Khan, Venugopal T, Devaih K C and
and its related physiological variables in Seenapa K. 1990. Effect of secondary
the leaves of Brassica genotypes as nutrients and boron on growth characters
influenced by sulphur fertilization. and yield in sunflower. Journal of Oilseeds
Physiologia Planetarium 110: 144–149. Research 7(2): 136-9.
20Chaturvedi Sumit, Chandel A S, Dhyani V C and crop responses. Journal of Plant Nutrition 30:
Singh A P. 2010. Productivity, profitability 1569–83.
and quality of soybean (Glycine max) and Sakal R. 1991. Relative susceptibility of some
residual soil fertility as influenced by important varieties of sesame and mustard
integrated nutrient management. Indian to boron deficiency in calcareous soil.
Journal of Agronomy 55(2): 133-7. Fertilizer News 36(3): 43-6
FAOSTAT. 2011. A publication of Statistics Division Sharma O P and Singh G D. 2005. Effect of
of Food and Agriculture Organization, United sulphur in conjunction with growth
Nations. substances on productivity of cluster bean
Khatik S K, Mahajan J P and Vishwakarma S K. and their residual effect on barley. Indian
1992. Effect of sulphur and phosphorus Journal of Agronomy 50(1): 16-8.
levels on phosphorus, sulphur, calcium and Sharma R K. 2003. Effect of sulphur application
magnesium content at different growth on seed yield, nutrient content and uptake
stages of soybean in Vertisol. JNKVV by soybean (Glycine max (L.) Merrill).
Research Journal 28(1): 56–9. Haryana Journal of Agronomy 19: 71-3.
Tandon H L S and Messick D L. 2007. Practical
Molegarrd P and Hardman R. 1980. Effect of
Sulphur Guide, pp 1-22. The Sulphur
boron on growth and yield of various
Institute, Washington, D.C.
crops. Journal of Agriculture Sciences 94: 455-
Vyas A K, Billore S D, Joshi O P and Pachlania N.
60.
2006. Productivity of soybean (Glycine max)
Raghuwanshi S R S, Raghuwanshi O P S, Umat R, genotypes as influenced by nitrogen and
Ambawatia G R and Bhargav K S. 2009. sulphur nutrition. Indian Journal of
Effect of different doses of sulphur on Agricultural Sciences 76(4): 272-3.
productivity and quality of soybean Watson D J. 1952. The physiological basis of
(Glycine max). Soybean Research 7: 93-5. variation in yield. Advances in Agronomy 4:
Rego T J, Sahrawat K L, Wani S P and 101–144.
Pardhasaradhi G. 2003. Widespread Yoshida S, Forno D A, Loc J H and Gomez K A.
deficiencies of sulphur, boron and zinc in 1972 Laboratory Manual of Physiological
Indian semi-arid tropical soils: on farm Studies of Rice, IRRI. Pp. 30.
21Soybean Research 11(1): 00-00
Effect of Organic and Inorganic Farming Systems on Physico-
chemical Properties of Vertisols under Soybean - Wheat
Cropping System
R GALLANI1, S K SHARMA2, P SIROTHIA3 and O P JOSHI4
Mahatma Gandhi Chitrakoot Gramodaya Vishwavidyalaya,
Chitrakoot, Madhya Pradesh
E mail: roshanjgallani@yahoo.co.in
Received: 29.11.2011; Accepted: 15.10.2012
ABSTRACT
Physico-chemical properties of Vertisols were studied under organic and inorganic farming systems
during 2008-09 and 2009-10 at farmers’ fields of Indore district. Experiment was carried out in
randomized block design with four treatments and five replications. Treatments comprised of organic
farming ≥ 3 years, organic farming (< 3 years), RDF and farmers’ practice of nutrient application.
Each farmer was taken as one replication. Significantly higher values for soil organic carbon content,
available zinc content along with soil porosity and soil aggregation were recorded with organic farming
systems. The soil N, P and K status were maximum in inorganic farming system followed by organic
farming systems and farmers’ practice of nutrient application. The contrasting results were found in
crop productivities of the two crops. Soybean productivity was higher in organic farming system (≥ 3
years) by 3.69 per cent over RDF (2088 kg/ha), while wheat productivity was higher in later one by
16.92 per cent over formers’ practice of nutrient application (3417 kg/ha). Non-significant differences
were observed among the treatments for pH, EC and for available Cu, Fe and Mn.
Key words: Physico-chemical properties, organic and inorganic farming systems
„Green Revolution‟ has shown path to the agro- ecological regions now showing
the country for self-sufficiency in food grain reduction in soil organic carbon contents
production, but the indigenous consequent upon adoption of intensive
knowledge and local wisdom was cropping and improper crop management
ignored in adopting scientific approach, practices (Srinivasarao et al., 2006). As a
particularly in applying fertilizers. Most of result, soils are encountering
1SubjectMatter Specialist; 2Senior Scientist, College of Agriculture, Indore; 3Associate Professor (MGCGVV),
Chitrakoot; 4Emeritus Scientist, DSR, Indore
22diversity of constraints broadly on account of Semliyachau, Asrawad Khurd, Badiya
physical, chemical and biological health and Khema, Ralamandel and Morod Haat of
ultimately leading to poor soil quality. This Indore district. These bio-villages were
shows signs of reversing trend in production adopted by the Department of Farmers‟
at several places, in spite of increased inputs Welfare and Agriculture Development
(Srinivasarao, 2011). (Government of Madhya Pradesh), where in
Several scientists and activists believe farmers have been practicing organic farming
that agriculture in general and organic for last 2-7 years.
farming in particular is more specific with The two organic farming treatments
respect to local than global level due to vide received NADEP compost @ 7.5 t per ha,
variations in soil, climate and captive water vermicompost @ 2.5 t per ha, bio-gas slurry @
resources. Since it is site specific farmer‟s 2.0 t per ha and biofertilizers Rhizobium
knowledge and identification of local japonicum + PSB (for soybean) and
practices are important to create new azotobacter + PSB (for wheat) as seed
approaches to achieve sustainability (Shroff, inoculants @10 g per kg seed each and soil
1994 and Deshpande, 2009). To evaluate the application @ 2 kg per ha. Inorganic farming
influence of organic and inorganic treatment involved application of
management, the present study is planned recommended levels of NP2O5K2O (120:60:30
with soybean [Glycine max (L.) Merrill] - kg/ ha) to wheat and NP2O5K2O (20:60:20
wheat (Triticum aestivum L.) cropping system kg/ha) to soybean through chemical
on Vertisols of Central India. fertilizers. The above three treatments were
evaluated over farmers‟ practice of
MATERIAL AND METHODS application of NP2O5K2O (150:50:0 kg/ ha) to
wheat and NP2O5K2O (40:40:0 kg/ha) to
The experiment was laid out at the soybean through chemical fertilizers. The
farmers‟ field located at different sites of popular variety Lok-1 of wheat and JS-335 of
Indore district (Madhya Pradesh) using soybean were grown in the experiment
randomized block design with four following standard package and practices.
treatments, namely organic farming (≥ 3 The data on various parameter recorded in
years), organic farming (< 3 years), inorganic both the years were pooled, statistically
farming with recommended dose of analysed and presented in the manuscript.
fertilizers and farmers‟ practice of nutrient Soil samples (0-15 cm and 15-30 cm)
application, replicated 5 times (each farmer were collected from the four systems
was taken as one replication). The study was evaluated and analysed. The soils of the
carried out during rabi and kharif seasons of study area was medium black (Sarol series),
2008-09 and 2009-10 in five villages namely, belonging to fine, Montmorillonitic,
23hyperthermic family of Vertic Haplusterts. manures. The available nitrogen, phosphorus
Standard methods as described by (Jackson, and potassium contents also revealed
1973) were used for soil analysis. Available significant differences. The content of these
micronutrients were extracted by using major nutrients were maximum in inorganic
DTPA extractant (Lindsay and Norvell, 1978) system followed by organic systems and
and measured by using AAS (Perkin-Elmer farmers‟ practice of nutrient application. The
model). The Soil bulk density was estimated direct application of nitrogen through
by core sampler method given by Bodman fertilizers leading to immediate availability
(1942), soil porosity was computed by could be accounted for higher nitrogen
putting values in the formulae, soil aggregate contents in inorganic systems. Comparatively
analysis- Mean Weight Diameter (MWD) was lower nitrogen contents in organic system
estimated by wet sieving method using could be due to shift in biological activity
Yoder‟s apparatus (Yoder, 1936). (Petersen et al., 1999). Significantly lower
phosphorus content in organic farming
RESULTS AND DISCUSSION systems due to slow mineralization from
native pool (Khan et al., 1984) and of
Effect of different farming systems on
potassium due to its release consequent upon
chemical properties of soil
interaction of organic matter with clay (Miller
The pH and electrical conductivity and Donahue, 1995) could be the possible
were unaltered by various treatments under explanations. The justifications also explain
the study. The values of pH and EC for the higher content of these nutrients in
different treatments were ranged from 7.4 to organic systems over farmers‟ practice
7.6 and from 0.19 to 0.21, respectively. This receiving unbalanced and skewed nutrition.
could be due to high buffering capacity of the As far as micronutrients are concerned, there
soil, as reported by Palojarvi et al. (2002). were non-significant differences for the
Significant higher organic carbon content content of Cu, Fe, and Mn between different
was noted in the organic farming system management systems. Zinc content was
(5.58 to 6.32 g/kg soil) as compared to significantly higher (1.29 kg/ha) in the
inorganic (4.86 g/kg soil) and farmers‟ organic farming (≥ 3 years) as compared to
practice of nutrient application (4.31 g/kg rest of the treatments (Table 1). Organic
soil) (Table 1). This appeared feasible due to manures are known to naturally provide
the direct and continuous addition of organic micronutrient as they store them in both
matter through organic sources. Bhandari et stable and usable forms (Tisdale et al.,
al. (1992) and Hapse (1993) reported similar 1993). The significant higher soil zinc
increase in soil organic carbon content of soil content was also observed by Ramesh et al.
due to continuous addition of organic (2010) in organic farming system.
24Effect of different farming systems on Effect of different farming systems on crop
physical properties of soil productivity
A soil with good structure and stable The grain yield is the manifestation of
aggregates will exhibit desirable values of various growth and yield attributing
bulk density and porosity for a given soil characters. In case of soybean, the higher
type that promotes adequate soil aeration productivity was obtained under organic
and available water. These characteristics farming (≥ 3 years) treatment, followed by
define the physical environment of the soil inorganic farming with RDF (Table 2). On the
ecosystem and are critical for a healthy soil contrary, in case of wheat, being cereal, the
and sustainable agriculture. Enhanced soil inorganic farming with RDF gave highest
structural properties are linked with productivity as compared to rest of the
increased soil organic matter (Tisdall and treatments. Higher soybean productivity
Oades, 1982) and the literature contains under organic systems as compared to
considerable evidence that a range of farmers‟ practice of nutrient application,
recycled organic amendments (composts or might be due to regulated availability of
bio-solids) increases the organic matter of soil nutrients, throughout the crop growth as
(Albiach et al., 2001). soybean gets majority of its nitrogen
requirement through symbiotic N-fixation.
The values for bulk density, porosity Further, the addition of manure and bio-
and mean weight diameter (MWD) for 0-15 fertilizers causes increased activity of
cm and 15-30 cm, which are indicator of beneficial microorganisms which mediated
desirable soil structure and stable aggregates, biological process like N- fixation and P-
were favourable in organic farming system (> solubilzation (Shwetha, 2007). Lower
3 years) followed by organic farming system productivity of wheat under organic farming
(< 3 years), inorganic system and farmers‟ systems may be argued on the basis of slow
practice of nutrient application (Table 2). The mineralization of organic manure and non-
decrease in bulk density and increased availability of required nutrients, which
aggregations on account of dilution effect of resulted in a setback in crop growth at early
denser mineral fraction (Shiralipour et al., stage of wheat and thus affected the crop
1992) and increase in aggregation on account yield (Prasad, 1994). The lower wheat
of binding effect of humic acid (Khaleel et al., productivity under organic farming system
1981), particularly in organic systems is due to inadequate supply of nutrients during
feasible. Enhanced soil structural properties entire crop growth period through lower
are linked to increased soil organic matter readily available nutrients has earlier been
has been brought forth in the present study. reported (Halberg and Kristensen, 1997).
25Table 1. Soil chemical properties as influenced by organic and inorganic farming systems
Treatment pH EC Organic Available
(dS/m) carbon N P2O5 K2O Zn Fe Cu Mn
(g/kg soil) (kg/ha) (kg/ (kg/ha) (mg/kg (mg/kg (mg/kg (mg/kg
ha) soil) soil) soil) soil)
Initial status 7.5 0.20 4.50 195 12.50 480 1.10 6.10 1.92 5.43
Organic 7.4 0.19 6.32 208.4 12.97 501.4 1.29 6.14 1.96 5.48
farming (≥ 3
years)
Organic 7.5 0.20 5.58 197.8 12.64 471.7 1.17 6.10 1.93 5.46
farming
(Table 2. Soil physical properties and crop productivity as influenced by organic and
inorganic farming systems
Treatment Bulk density Porosity MWD Seed yield (kg/ha)
(Mg/m) (%) (mm)
0-15 15-30 0-15 15-30 0-15 15-30 Soybean Wheat
cm cm cm cm cm cm
T1 - Organic farming (≥ 3 1.22 1.44 53.8 44.9 1.222 0.807 2165 3698
years)
T2 - Organic farming 1.28 1.53 50.5 42.1 1.118 0.660 1849 3376
(Hapse D G. 1993. Organic farming in the light of Rao A. 2010. Status of organic farming in
reduction in use of chemical fertilizers. India. Current Science 98(9): 1190-1194.
Proceedings of 43rd Annual Deccan Sugar Shiralipour A, McConnell D B and Smith W H.
Technology Association, Pune, Part-I, pp. 1992. Physical and chemical properties of
SA37-SA51. soils as affected by municipal solid waste
Jackson M L. 1973. Soil Chemical Analysis, Prentice compost application. Biomass and Bioenergy
Hall of India Pvt. Ltd., New Delhi. 3: 261-6.
Khaleel R, Reddy K R and Overcash M R. 1981. Shroff V N. 1994. Organic Farming- selected
Changes in soil physical properties due to lectures, training programme on organic
organic waste applications: a review. farming organized by Government of India,
Journal of Environmental Quality 10: 133-41. State Government of Madhya Pradesh and
Khan G, Gupta S K and Banerjee S K. 1984. Jawaharlal Nehru Krishi Vishwa
Studies on solubilization of phosphorus in Vidyalaya, Jabalpur at College of
presence of different city wastes. Journal of Agriculture, Indore, pp 1-6.
Indian Society of Soil Science 29: 123-4. Shwetha B N. 2007. Studies on nutrient
Lindsay W L and Norvell W A. 1969. Equilibrium management through organics in soybean –
relationships of Zn2+, Fe2+, Ca2+ and H+ wheat cropping system. M. Sc. Thesis,
with EDTA and DTPA in soil. Soil Science University of Agricultural Sciences,
Society of America Proceedings 33: 62-8. Dharwad
Miller R W and Donahue R L. 1995. Soils in Our Srinivasarao Ch., Vittal K P R, Gajbhiye P N and
Environment (7th Edition). Prentice Hall, Venkateswarlu B. 2006. Indian Journal on
Englewood Cliffs, New Jersey, 649 pp. Dryland Agricultural Research and
Palojarvi A, Alakkuku L, Martikainen E, Marina Development 21(5): 105-13.
N, Vanhala P, Jorgensen K and Esala M. Srinivasarao Ch. 2011. Nutrient management
2002. 17th WCSS, 14-21 August, 2002. strategies in rainfed agriculture: constraints
Thailand. and opportunities. Indian Journal of
Fertilizers 7(4):12-25.
Petersen C, Drinkwater L and Wagoner P. 1999.
Tisdale S L, Nelson W L, Beaton J D and Havlin J
The Rodale Institute Farming System Trial:
L. 1993. Soil Fertility and Fertilizers. 5th ed.
The first 15 years. The Rodale Institute,
Macmillan Publ. Co., New York, 634 pp.
Kutztown, PA, p. 40.
Tisdall J M and Oades J M. 1982. Organic matter
www.rodaleinstitute.org.
and water-stable aggregates in soils. Journal
Prasad B. 1994. Integrated nutrient management of Soil Science 33: 141-63.
for sustainable agriculture. Fertilizer News Yoder R E. 1936. A direct method of aggregate
39(9): 19-25. analysis and a study of the physical nature
Ramesh P, Panwar N R, Singh A B, Ramana S, of erosion losses. Journal of American Society
Yadav S K, Shrivastava Rahul and Subba of Agronomy 28: 237-51.
28Soybean Research 11(1): 29-35 (2013)
Effect of Gypsum as a Source of Sulphur on Soybean
[Glycine max (L.) Merrill] at Farmers Field on Malwa Region
of Madhya Pradesh
S K VERMA1, S R S RAGHUWANSHI2, S C TIWARI3 and R JAIN4
Department of Soil Science and Agricultural Chemistry,
Rajmata Vijayaraje Scindia Krishi Vishwa Vidyalaya, Gwalior 474 002, Madhya Pradesh
Received: 24.08.2011; Accepted: 12.10.2012
ABSTRACT
Demonstrations were conducted for three consecutive years (kharif 2006 to 2008) at 5 farmers’ fields
during each year, to observe the effect of graded levels of gypsum on production potential and economic
benefits of soybean cultivation. The average plant height, number of pods per plant and number of seeds
per pod of soybean increased significantly with the increase in gypsum application rates beyond 0.2 t
per ha over control. The mean seed index (g/100 seeds) also increased with the increasing levels of
gypsum. The maximum plant height (55.48 cm) and number of pods per plant (44.26) were recorded on
application of gypsum @ 0.2 t per ha, however, maximum number of seeds per pod (2.75) and seed
index (14.12 g/100 seeds) was noticed when gypsum was applied @ 0.3 t per ha. The highest seed (2 591
kg/ha) and stover (2 784 kg/ha) yields were recorded on application of gypsum @ 0.3 t per ha, which
was statistically at par with @ 0.2 t per ha. The content of N, P, K and S in seed increased significantly
with the increased level of gypsum application as compared to control. The highest content of N (6.53
%), P (0.51 %), K (2.39 %) and S (0.33 %) was recorded with application of gypsum @ 0.2 per t ha.
The computed value cost ratio (VCR) indicated that the increased rate of gypsum application was
invariably beneficial to the farmers. Soybean crop gave highest return (INR 26.30) on single rupee
invested on gypsum when applied @ 0.2 t per ha.
Key words: Economics, gypsum, soybean, yield
During past four decades of its share in area of 5.51 million hectare (59.3
commercial venture, soybean has established %) with production of soybean of 6.10 mt
itself as a major kharif season oilseed crop (60.2 %) in India (www.sopa.org).
in India, particularly in central part of the Although, the soybean research and
country. Madhya Pradesh has its major development system in the
1Professor; 2Associate Professor; 3Scientist; 4Research Associate
29country has generated viable production demonstration was conducted on an area of
technology to raise the productivity to more 0.4 hectare and the same area adjacent to the
than 80% from the present level of around 1.0 demonstration plot was kept as farmers
tons per hectare, it appears that there are practice. The experiment consisted of four
impediments in reaching to end users levels of gypsum as fertilizer 0, 0.1, 0.2 and
creating a technological gap (Bhatnagar, 0.3 t per ha. Package of improved
2009). To convince the soybean growers on technologies included high yielding, short
effectiveness of technology and to motivate duration variety (JS 93-05), recommended
them for adoption, conduct of level of fertilizer application (25:60:30, N:
demonstrations is one of the proven P2O5: K2O kg/ha) and hand weeding at 25
methods. The low productivity of soybean DAS. The soybean crop was sown between
may be due to nutritional deficiencies and June 29th and 2nd July in 2006, June, 20th and
also imbalanced fertilization amongst the 22nd in 2007 and June 15th and 28th in 2008
nutrients, sulphur is one of them whose with seed rate 80 kg per ha at row to row
response is observed in soybean (Prasad, spacing of 45 cm. Entire dose of N and P
2006). Non-judicious use of chemical through DAP and K through MOP was
fertilizers, intensive cultivation of crops, applied as basal dose before sowing. Gypsum
higher cropping intensity and limited use of of agriculture grade (12.6% S) was used as a
organic matter are the most possible causes source of sulphur and applied before sowing
for sulphur deficiency limiting soybean yield. of the crop. The seeds were treated with
Bradyrhizobium japonicum and phosphate –
MATERIAL AND METHODS solubilizing bacteria, each @ 10 g per kg seed.
The crop was harvested in between October
Front line demonstrations were 7th and 10th in 2006, September 25th and 28th in
conducted for three consecutive years (2006- 2007 and September 16th and 27th in 2008. The
08) on farmers fields (5 farmers every year) observations pertaining to yield attributing
covering eight adopted villages (Dakachya characters on five randomly selected plants,
and Barlai of Sanwer tehsil, Panod and seed and stover yield of soybean were
Balyakheda of Indore tehsil and Agra, Hatod, recorded and subjected to statistical analysis
Sagwal and Budania of Depalpur tehsil) of (Panse and Sukhatme, 1985) in randomized
Indore district of Madhya Pradesh under block design considering location (farmers)
rainfed condition. The soil of the as replicate. The seed samples collected at
demonstration sites was medium black soil harvest were analyzed for nitrogen (Kjeldhal,
with low to medium fertility status (pH-7.80, 1983) phosphorus by vanadomolybdo
EC-0.67 dSm-1, available N 191.8 kg/ha, phosphoric yellow colour method in nitric acid
available P2O5 12.65 kg/ha, available K2O 585 system (Jackson, 1973), potassium (Black, 1965),
kg/ha and available S 10.53 kg/ ha). Each sulphur by method given by Chesnin and
30You can also read