Spotted Lanternfly Control Program in the Mid-Atlantic Region - Environmental Assessment May 2018 - USDA APHIS
←
→
Page content transcription
If your browser does not render page correctly, please read the page content below
Au

United States
Department of
Agriculture
                Spotted Lanternfly
Marketing and
Regulatory
Programs
                Control Program in the
Animal and
Plant Health
                Mid-Atlantic Region
Inspection
Service

                Environmental Assessment
                May 2018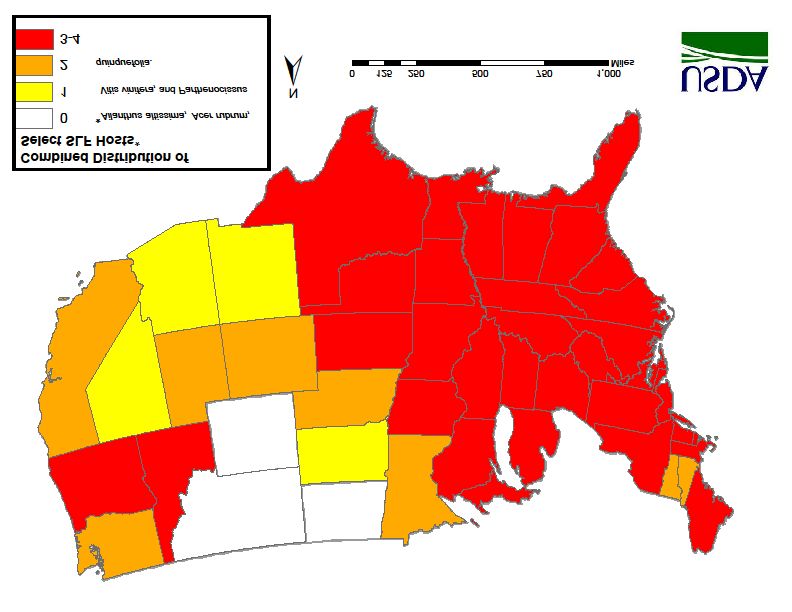
Spotted Lanternfly Control
Program in the Mid-Atlantic
Region
Environmental Assessment
May 2018

Agency Contact:
John Crowe
National Policy Manager
Plant Protection and Quarantine – Plant Health Programs
Animal and Plant Health Inspection Service
U.S. Department of Agriculture
4700 River Road, Unit 134
Riverdale, MD 20737
Non-Discrimination Policy

The U.S. Department of Agriculture (USDA) prohibits discrimination against its customers,
employees, and applicants for employment on the bases of race, color, national origin, age,
disability, sex, gender identity, religion, reprisal, and where applicable, political beliefs, marital
status, familial or parental status, sexual orientation, or all or part of an individual's income is
derived from any public assistance program, or protected genetic information in employment or in
any program or activity conducted or funded by the Department. (Not all prohibited bases will
apply to all programs and/or employment activities.)

To File an Employment Complaint

If you wish to file an employment complaint, you must contact your agency's EEO Counselor (PDF)
within 45 days of the date of the alleged discriminatory act, event, or in the case of a personnel
action. Additional information can be found online at
http://www.ascr.usda.gov/complaint_filing_file.html.

To File a Program Complaint

If you wish to file a Civil Rights program complaint of discrimination, complete the USDA Program
Discrimination Complaint Form (PDF), found online at
http://www.ascr.usda.gov/complaint_filing_cust.html, or at any USDA office, or call (866) 632-9992
to request the form. You may also write a letter containing all of the information requested in the
form. Send your completed complaint form or letter to us by mail at U.S. Department of Agriculture,
Director, Office of Adjudication, 1400 Independence Avenue, S.W., Washington, D.C. 20250-9410,
by fax (202) 690-7442 or email at program.intake@usda.gov.

Persons With Disabilities

Individuals who are deaf, hard of hearing, or have speech disabilities and you wish to file either an
EEO or program complaint please contact USDA through the Federal Relay Service at (800) 877-
8339 or (800) 845-6136 (in Spanish).

Persons with disabilities who wish to file a program complaint, please see information above on
how to contact us by mail directly or by email. If you require alternative means of communication
for program information (e.g., Braille, large print, audiotape, etc.) please contact USDA's TARGET
Center at (202) 720-2600 (voice and TDD).

Mention of companies or commercial products in this report does not imply recommendation or
endorsement by USDA over others not mentioned. USDA neither guarantees nor warrants the
standard of any product mentioned. Product names are mentioned to report factually on available
data and to provide specific information.

This publication reports research involving pesticides. All uses of pesticides must be registered by
appropriate State and/or Federal agencies before they can be recommended.

CAUTION: Pesticides can be injurious to humans, domestic animals, desirable plants, and fish and
other wildlife—if they are not handled or applied properly. Use all pesticides selectively and
carefully. Follow recommended label practices for the use and disposal of pesticides and pesticide
containers.
Table of Contents

I. Purpose and Need .................................................................. 1
II. Alternatives ............................................................................ 3
   A. No Action ............................................................................ 3
   B. Preferred Alternative ........................................................... 4
III. Affected Environment ............................................................ 8
   A. Suitable Habitat ................................................................. 8
   B. Agriculture in the Mid-Atlantic Region .............................. 11
   C. Land, Air, and Water Characteristics of the Mid-Atlantic
Region .................................................................................... 13
   D. Wildlife Concerns in the Mid-Atlantic Region .................... 19
IV. Environmental Consequences ............................................ 22
   A. No Action .......................................................................... 22
   B. Preferred Alternative ......................................................... 24
V. List of Agencies and Persons Consulted ............................. 34
VI. References and Abbreviations ............................................ 35

Figure 1. Predicted potential distribution of SLF by CLIMEX
modeling. ................................................................................... 2
Figure 2. Combined Distribution of Select SLF Hosts .............. 10

Table 1. SLF hosts .................................................................... 9
Table 2. Select agricultural statistics in the affected area ....... 11
Table 3. Summary of 2017 Mid-Atlantic Grape and Peach
Production ................................................................................ 12
Table 4. Select characteristics of the affected area.................. 13
Table 5. Summary of Environmentally Important Areas .......... 17
Table 6. Summary of Impaired Waters by State...................... 18
Table 7. Summary of Important Bird Areas ............................. 19
Table 8. Summary of likely presence of Federally listed species
in representative counties in Pennsylvania .............................. 20
I. Purpose and Need
The spotted lanternfly (SLF), Lycorma delicatula (White) (Hemiptera:
Fulgoridae), is an invasive insect primarily known to affect Tree-of-Heaven
(Ailanthus altissima), grapevine (Vitis vinifera), stone fruits (almond, apricot,
cherry, nectarine, peach, and plum), and other tree species (apple, oak, pine,
poplar, and walnut) (USDA-APHIS, 2018). If allowed to spread, this pest could
seriously harm grape, apple, peach, stone fruit, and logging industries throughout
the country. USDA-APHIS does not have specific data on the level of tree
mortality SLF may cause over time; however, stress from attack by SLF could
predispose native host trees and other plants to other pests and pathogens. Pest
damage leading to changes in forest composition is well-characterized (McGarvey
et al., 2015; Mikkelson et al., 2013). Both nymphs and adults of SLF damage host
plants when they feed by sucking sap from stems and leaves. This reduces
photosynthesis, weakens the plant, and eventually contributes to the plant’s death. In
addition, feeding can cause the plant to ooze or weep, resulting in a fermented odor,
and the insects themselves excrete large amounts of fluid (honeydew). These fluids
promote mold growth and attract other insects (PDA, 2018).
Adult SLF are approximately 1 inch long and one-half inch wide, appear in late July,
and have large and visually striking wings. Their forewings are light brown with
black spots at the front and a speckled band at the rear. Their hind wings are scarlet
with black spots at the front and white and black bars at the rear. Their abdomen is
yellow with black bars. Nymphs in their early stages of development appear black
with white spots and turn to a red phase before becoming adults (PDA, 2018).
The SLF lays its eggs on smooth host plant surfaces and on non-host material, such
as bricks, stones, and dead plants. Egg masses are yellowish-brown in color, covered
with a gray, waxy coating prior to hatching. Eggs hatch in the spring and early
summer. Egg masses can easily be transported long distances on a wide variety of
non-food commodities such as rock, concrete, tile, and wood. SLF can walk, jump,
or fly short distances, and its long-distance spread is facilitated by people who move
infested material or items containing egg masses (PDA, 2018). Spreading SLF
populations make it harder to eradicate this pest, and are associated with increased
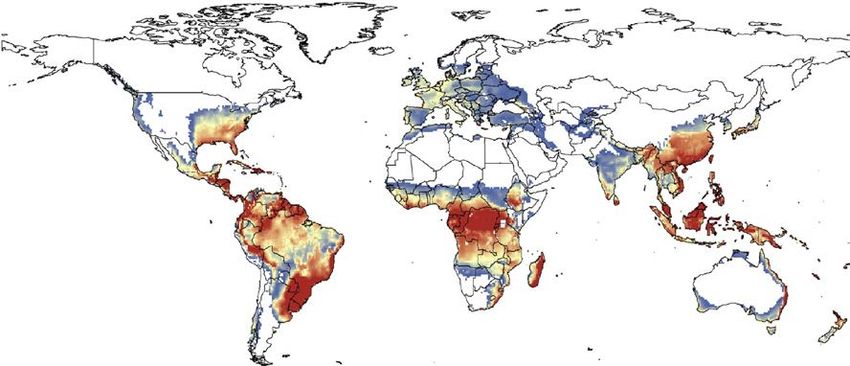
pesticide use that increases risks to human health and the environment. In 2017,
CLIMEX modeling estimated the potential distribution of SLF (Jung et al., 2017;
see Figure 1).
1Figure 1. Predicted potential distribution of SLF by CLIMEX modeling.
The ranges of red to blue coloration represent more favorable locations to
unfavorable regions, respectively (Jung et al., 2017).
In the field of plant health, an outbreak is considered to be a recently detected pest
population, including an incursion, or a sudden significant increase of an
established pest population in an area (ISPM, 2007). An incursion occurs when an
isolated population of a pest was recently detected in an area, is not known to be
established, but is expected to survive for the immediate future (ISPM, 2007). At
the present time, SLF incursions are ongoing in Pennsylvania and Virginia. In
February 2018, the Virginia Department of Agriculture and Consumer Services
announced SLF was detected in January outside of Winchester, VA 1. This outbreak
and the ongoing Pennsylvania incursion are being met with control programs as
described in prior SLF Environmental Assessments (EAs) and their related
decision documents, a Finding of No Significant Impact (FONSI). This EA
incorporates all of the prior Spotted Lanternfly EAs and FONSIs by reference. 2
On February 7, 2018 U.S. Secretary of Agriculture Sonny Perdue announced
$17.5 million in emergency funding to stop the spread of the spotted lanternfly in
southeastern Pennsylvania. This emergency funding, which was made available
through existing Commodity Credit Corporation balances, would allow the
USDA-APHIS in cooperation with the State of Pennsylvania to manage the
current infestation. The goal of a combined expanded surveillance and control
program would be to stop the leading edge of the infestation, and start pushing it
inward while at the same time reducing the density of spotted lanternfly
populations in the core of the infested area. As USDA-APHIS conducts additional
survey work, the quarantine areas continue to expand. The affected area expanded
1
https://ext.vt.edu/agriculture/commercial-horticulture/spotted-lanternfly.html
2
These documents are available at: https://www.aphis.usda.gov/plant_health/ea/downloads/2015/slf-berks-lehigh-
montgomery-pa.pdf , https://www.aphis.usda.gov/plant_health/ea/downloads/2015/spotted-lanternfly-fonsi.pdf ,
https://www.aphis.usda.gov/plant_health/ea/downloads/2016/fonsi-slf-march.pdf, and
https://www.aphis.usda.gov/plant_health/ea/downloads/2018/slf-va-ea.pdf .
2from 174 square miles in fiscal year (FY) 2016 to approximately 3,000 square
miles by the end of FY 2017. The continuing survey and detection work
conducted by State and federal entities will inform when and where additional
Federal actions should occur.
The purpose of this programmatic EA is to increase preparedness by having a
combination of program measures available for deployment wherever and
whenever SLF outbreaks may occur so that control efforts can proceed upon pest
detection. Program actions would be triggered by SLF detections in an area.
When an outbreak presents new environmental issues, program methods would be
deployed after the new environmental issues are considered in site-specific
documentation.
This EA considers programmatic control efforts throughout the Mid-Atlantic
States including: Connecticut, Delaware, Maryland, New York, New Jersey,
North Carolina, Pennsylvania, Virginia, West Virginia, and the District of
Columbia. The control experience gained in Pennsylvania is considered as
representative of impacts throughout the potentially affected area.
APHIS has the responsibility for taking actions to exclude, eradicate, and control
plant pests under the Plant Protection Act of 2000 (7 United States Code (U.S.C.)
7701 et seq.). This EA was prepared consistent with the National Environmental
Policy Act of 1969 (NEPA) and the Animal Plant Health Inspection Service
(APHIS) NEPA implementing procedures (7 Code of Federal Regulations (CFR)
part 372) for the purpose of evaluating how the proposed action, if implemented,
may affect the quality of the human environment. The proposed action does not
meet the criteria for actions normally requiring environmental impact statement (7
CFR § 372.5(a)) based on the lack of significant impacts to the human
environment associated with the as-needed deployment of control program
methodologies.
II. Alternatives
The program components in the alternatives considered for this EA are essentially
the same as in the "Spotted Lanternfly Eradication Program in Frederick County,
Virginia, Environmental Assessment March 2018" (which is incorporated by
reference) with expansion of the programmatic activities into all areas on an as-
needed basis as the preferred alternative. Expansion would occur in both the
number of treated areas and in the range of pesticides available for use.
A. No Action
Under the no action alternative, USDA-APHIS would provide existing funding to
support efforts in areas where SLF control programs already exist. USDA-APHIS
would not use regulatory controls, such as establishing Federal quarantines or
commodity certification programs. Other government agencies and private
3landowners may work to eradicate SLF; however, there would be no cooperative
or coordinated efforts among USDA-APHIS and other stakeholders. State
workers, Federal District workers, and volunteers would be the primary providers
of control efforts.
B. Preferred Alternative
The SLF control program is proposing a combination of measures to use in an
integrated manner on an as-needed basis when there are SLF detections along the
Mid-Atlantic region. USDA-APHIS expects additional detections may occur in
Connecticut, Delaware, Maryland, New York, New Jersey, North Carolina,
Pennsylvania, Virginia, West Virginia, and the District of Columbia within the
reasonably foreseeable future. Control efforts may include any or all of the
following: regulatory control, surveys, egg mass scraping, sanitation, tree
removal, herbicide applications, and applications of insecticides (dinotefuran or
imidacloprid on an as-needed basis).
The methods used in regulatory control, surveys, egg mass scraping, sanitation,
tree removal, herbicide and insecticide applications for SLF control are described
in the "Spotted Lanternfly Eradication Program in Berks, Lehigh and
Montgomery Counties, Pennsylvania Environmental Assessment" which is
incorporated by reference. Additional methods used in herbicide and insecticide
applications are described in the "Draft Programmatic Asian Longhorned Beetle
Eradication Program Environmental Impact Statement" published in 2015. The
methods and risk evaluations associated with the program uses described in
Appendices E and F (including human health risk assessments and ecological risk
assessments for all pesticides) are incorporated by reference. The two recently
prepared Environmental Assessments for Virginia and Pennsylvania 3 are
incorporated by reference.
The SLF control program is proposing several measures to address the recent
detections in Pennsylvania and Virginia. These same measures are proposed in
other Mid-Atlantic States where SLF may be detected and require control. Control
efforts may include any or all of the following: surveys, egg mass scraping,
sanitation, tree removal, and insecticide and herbicide applications.
Detection Survey
Detection survey will use visual inspection and sweep netting to determine if SLF
is present. Immature SLF crawl up trees each day and can be observed visually or
3
Spotted Lanternfly Eradication Program in Select Counties of Pennsylvania Supplemental Environmental
Assessment March 2018 available at: https://www.aphis.usda.gov/aphis/ourfocus/planthealth/plant-pest-and-disease-
programs/sa_environmental_assessments/ct_slf and Spotted Lanternfly Eradication Program in Frederick County,
Virginia Environmental Assessment March 2018 available at:
https://www.aphis.usda.gov/plant_health/ea/downloads/2018/slf-va-ea.pdf
4can be collected by sweep netting. Tree bands (discussed below) will also be used
to detect infestations.
Visual Reconnaissance Survey and Egg Mass Scraping
Visual reconnaissance surveys identify locations that have feeding damage or
presence of SLF on plants. The program is working with the local agricultural
extension office to train local citizens to identify egg masses. The visual surveys
will occur from October through May and volunteers and program personnel will
scrape egg masses from plants and other objects with a stiff plastic card into bags
with an alcohol solution to cause mortality.
Sanitation
Sanitation of all other greenwaste within 1/4 mile of SLF detections may include
chipping or grinding the debris, and disposal through incineration or burning.
Steaming, composting, and burial of greenwaste are options under consideration
for the future.
Tree Banding
The program will place self-adhesive paper bands around A. altissima trees from
SLF hatch in May to death of the adult population in November to capture SLF
while they move up the trunk or congregate to feed and mate. Volunteers or
program personnel will replace tree bands on a bi-weekly basis and report the
number of SLF captured to develop data on the infestation and control achieved.
Used bands will be bagged and placed in a landfill.
Tree Removals
Contractors for APHIS and its cooperators will remove A. altissima trees up to a
quarter-mile radius from infested trees. When possible, APHIS prefers to
physically remove host trees along with the stumps to prevent reinfestation. When
it is impractical to move stump removal equipment into an area APHIS would
have the option to apply herbicides to treat the remaining stumps and associated
sprouts. APHIS needs a range of herbicide options to treat stumps and control
vegetation sprouting from stumps of SLF-host species. In the Asian Longhorned
Beetle (ALB) program, APHIS gained experience with using a combination of the
herbicides triclopyr, imazapyr, and metsulfuron-methyl, and finds these same
chemicals and methods of application may be useful for the SLF program (USDA
APHIS, 2015). The SLF program is also proposing to use aminopyralid and
glyphosate to treat stumps and sprouting vegetation. Not all herbicides would be
used at one site but depending on whether stumps or sprouts need treatment, one
or a mixture of herbicides may be used. These herbicide treatments are needed as
a way to prevent reinfestation of host tree stumps and sprouts that have been
5removed as part of the SLF program. All applications will be made either by hand
painting undiluted material on the stump or directly spraying stumps and
sprouting foliage using a backpack sprayer.
The herbicide triclopyr imitates a plant hormone (indoleacetic acid) that is used to
control woody plants and broadleaf weeds (USDA-FS, 2011a). Imazapyr is a
systemic, non-selective imidazolinone herbicide used for the control of a broad
range of terrestrial and aquatic weeds that works by inhibiting an enzyme
involved in the biosynthesis of amino acids such as leucine, isoleucine and valine
(HSDB, 2014a; USDA-FS, 2011b). Metsulfuron-methyl is a sulfonylurea
herbicide that inhibits the enzyme that catalyzes the biosynthesis of branched-
chain amino acids (valine, leucine, and isoleucine) which are essential for plant
growth (USDA-APHIS, 2015; USDA-FS, 2004). Glyphosate is non-selective
post-emergent systemic herbicide that works by inhibiting essential aromatic
amino acids important to plant growth (USDA-FS. 2011c). Glyphosate has a
variety of agricultural and non-agricultural uses. Aminopyralid is a systemic
selective carboxlic acid herbicide that affects plant growth regulators, or auxins,
and has multiple non-agricultural uses. (USDA-FS, 2007).
Insecticide Treatments
The program will use backpack-mounted or ground vehicles to apply dinotefuran
or imidacloprid to clusters of A. altissima host trees. No aerial applications are
proposed. Allowable application, protective equipment, exclusion, dosage, and
entry restrictions will follow the label instructions of the insecticide specified.
Only licensed applicators or persons working under the supervision of a licensed
applicator shall apply insecticides. Dinotefuran or imidacloprid would be used in
conjunction with tree removal and banding which are the two other primary non-
chemical treatment options. The use of dinotefuran or imidacloprid would only
occur through landowner consent.
Dinotefuran/Imidacloprid
Dinotefuran and imidacloprid are systemic neonicotinoid insecticides that are
taken up by the root system, foliage, or through the bark and translocated upward
throughout the plant. Their mode of action involves disruption of an insect's
central nervous system by binding to the post-synaptic nicotinic acetylcholine
receptors, thereby competing with the natural neurotransmitter acetylcholine
(Simon-Delso et al., 2015). This long-lasting receptor binding has delayed lethal
effects such that repeated or chronic exposure can lead to cumulative effects over
time (Simon-Delso et al., 2015). Insects must feed on the Tree-of-Heaven to be
exposed to a dose which kills them, but the presence of the chemicals only within
the plant simultaneously minimizes exposure of non-target organisms (PDA,
2017).
6The SLF program will apply either dinotefuran through a basal trunk spray or
imidacloprid through trunk injection to approximately 10 trap trees at a given site.
Trap trees would be created by leaving a number of live male A. altissima
(generally 10 inches in diameter at breast height (dbh)) on a property after host
tree reduction. Removal of most potential hosts in an area means that when the
late instar and adult SLF start searching for A. altissima to feed on, their only
nearby option is one of the insecticide-treated trap trees (PA DOA, 2017).
Treatments will wet the bark just to the point of saturation and avoid run off of the
chemicals into adjacent soil. Dinotefuran treatments will not occur when the tree
bark is wet, during rainfall, or if rain is expected within 12 hours after application.
Currently only one application of the pesticide of 0.54 pounds active ingredient
(lbs. a.i.) per acre will occur at a treatment site per year. A Section 24 (c) Special
Local Needs registration that will allow an increase in the application rate may be
used to increase efficacy, if needed in the future. A similar registration was
obtained in Pennsylvania for the SLF program for use on trap trees. The program
will not apply dinotefuran when trees are dormant, flowering, under drought
stress, or while not actively taking up water from the soil.
Another insecticide option to treat trap trees as part of the SLF control program
would be the use of imidacloprid. There are several different imidacloprid
formulations available for trunk, soil, seed, and foliar applications. In the SLF
control program imidacloprid would be applied through trunk injection at the base
of the tree, which is then translocated upward (USDA APHIS, 2015). These
application methods were previously used in the ALB eradication programs and
are incorporated by reference (USDA APHIS, 2015).
The program intends to use pesticide application equipment mounted on
backpacks or ground vehicles, and does not plan any aerial applications of
insecticides. Allowable application, protective equipment, exclusion, dosage, and
entry restrictions will follow the label instructions for the specific insecticide.
Applications of insecticides would occur only with landowner consent.
7III. Affected Environment
SLF is native to China and Vietnam, although initially described in 1845 from
collected insect specimens in the British Museum (Wolgemuth et al., 2016). SLF
is considered an invasive species in Japan, and in South Korea where it was first
detected in 2004 (PDA, 2018). On September 22, 2014, the PDA in cooperation
with the Pennsylvania Game Commission, confirmed the presence of SLF in
Berks County, Pennsylvania, which was the first detection of this non-native
species in the United States (PDA, 2018). Based on the number of U.S. detections
since that date, it is readily apparent that SLF is an invasive pest within this
county.
This chapter considers the baseline conditions of the affected environment that
could be impacted by continued SLF outbreaks and control activities. The Mid-
Atlantic region is considered representative of where new detections are most
likely to occur. This section of the EA considers the Mid-Atlantic region
(typically including Delaware, Maryland, New Jersey, Pennsylvania, Virginia,
and West Virginia) within the context of areas with suitable habitat for SLF
within the country. For this EA, the choice of states is expanded to include all of
Connecticut, New York, and North Carolina because aspects of their water
drainage and climate (Greene et al., 2005) may create suitable SLF habitat in
addition to states traditionally considered as the Mid-Atlantic region. USDA-
APHIS uses this information as the basis to evaluate potential impacts of the
program.
The alternatives in this EA include the same provisions as in the Alternatives
examined in the 2018 SLF Eradication Program EAs for Pennsylvania and
Virginia that are incorporated by reference. USDA-APHIS activities would
remain focused on individual outbreaks as they are detected regardless of whether
they occur on private or public lands. This is because potential hosts occur
throughout the country and exploit a wide range of land, water, and air resources.
APHIS does not expect any natural or human-mediated dispersion to occur more
than 200 miles from the current positive detections. If SLF detection beyond the
Mid-Atlantic region occurs, the program will consider if control can no longer be
considered possible. While control activities have the potential to impact this
affected environment, the presence of invasive, uncontrolled SLF populations will
impact those features over time.
A. Suitable Habitat
Suitable SLF habitat occurs when an area contains both hosts that support SLF
life stages, and a climate that matches the environmental parameters necessary for
SLF growth and reproduction. The hosts provide food, shelter, and egg laying
sites; the climatic conditions in the new area are the same or similar to areas
where SLF adapted to survive over time. SLF changes hosts as it ages through its
developmental stages (PDA, 2018). Nymphs feed on a wide range of plant
8species, while adults prefer to feed and lay eggs on Tree-of-Heaven. Table 1
provides a list of some SLF hosts (Dara et al., 2015). A global prediction of SLF
potential distribution is in Figure 1 (Jung et al., 2017). Figure 2 depicts the
combined distribution of four hosts (Acer rubrum, Ailanthus altissima, Vitis
vinifera, and Parthenocissus quinquefolia (USDA-NRCS, 2018)) that support
multiple life stages of SLF, and therefore are highly likely to provide suitable
habitat.
Table 1. SLF hosts
Host Plant1 Common Name Family SLF Life Stage or
(Origin2) Activity
Acer palmatum Thunb. Japanese Maple (I) Aceraceae Feeding
Acer rubrum L. Red maple (N) Aceraceae Adult; feeding, egg
laying
Acer saccharum L. Silver Maple (N) Aceraceae Feeding
Ailanthus altissima (Mill.) Tree-of-Heaven (I) Simaroubaceae Adult, nymph;
Swingle3 feeding, egg laying
Aralia elata (Miq.) Seem.3 Japanese angelica tree Araliaceae Nymph
(I)
Arctium lappa L. Greater Burdock (I) Compositae Nymph; feeding
Fagus grandifolia Ehrh. American beech (N) Fagaceae Adult; egg laying
Liriodendron tulipifera L. Tuliptree (N) Magnoliaceae Adult; egg laying
Magnolia kobus D.C. Kobus magnolia (I) Magnoliaceae Nymph; feeding
Malus spp. Mill. Apple (I, N) Rosaceae Feeding
Morus alba L. White Mulberry (I) Moraceae Nymph; feeding
Parthenocissus quinquefolia Virginia Creeper (N) Vitaceae Adult, nymph;
(L.) Planch. feeding
Platanus occidentalis L. American sycamore Platanaceae Adult; egg laying
(N)
Populus alba L. White Poplar (I) Saliaceae Egg laying
Prunus serotina Ehrh. Black cherry (N) Rosaceae Adult; egg laying
Quercus acutissima Sawtooth oak (I) Fagaceae Unknown
Carruthers
Quercus spp. L. Oak (I, N) Fagaceae Adult; egg laying on
some species
Robinia pseudoacacia L. Black Locust (N) Fabaceae Feeding
Rosa multiflora Thunb.3 Multiflora Rose (I) Rosaceae Nymph; feeding
Salix spp. L. Willow (I, N) Saliaceae Adult; feeding
9Table 1. SLF hosts
Host Plant1 Common Name Family SLF Life Stage or
(Origin2) Activity
Sorbaria sorbifolia (L.) A. False spiraea (I) Rosaceae Nymph; feeding
Braun
Syringa vulgaris L. Common Lilac (I) Oleaceae Egg laying
Styrax japonicus Siebold & Japanese snowbell (I) Styracaceae Adult, nymph;
Zucc. feeding
Vitis vinifera L. Wine Grape (I) Vitaceae Adult, nymph;
feeding, egg laying
Zelkova serrata (Thunb.) Japanese Zelkova (I) Ulmaceae Egg laying
Makino
1
Hosts selected from Dara et al., 2015.
2
Origins are I = Introduced, N = Native
3
Considered as invasive by the PA DCNR, 2017.
Figure 2. Combined Distribution of Select SLF Hosts. Distribution of Select SLF
Hosts. Hosts include Ailanthus altissima, Acer rubrum, Vitis vinifera, and Parthenocissus
quinquefolia (USDA-NRCS, 2018).
10Hosts of SLF grow in a wide range of soils (dry to medium moisture), shade
conditions (full sun to part shade), and in the presence of urban pollutants
(Missouri Botanical Garden, 2018). Red maple tends to grow in moist, slightly
acid conditions, while grape hosts grow best in deep, loamy, humus-rich, medium
moisture, well-drained soils (Missouri Botanical Garden, 2018). The combined
conditions favorable to SLF hosts indicates plants growing in a wide range of soil
types and shade conditions could become infested by SLF where ever they occur.
The combination of favorable climate and presence of hosts allows the inference
that the Mid-Atlantic region of the United States is highly likely to support the
establishment of SLF populations.
In addition to agriculturally important and native tree species, many SLF hosts are
recognized as invasive plants that are highly likely to establish in a variety of
conditions, including highly disturbed or high human-density developed areas
(see table 1). SLF damage to hosts includes release of sap down the exterior of
tree trunks (Dara et al., 2015). As the tree weakens, this sap serves as a food
source for fungi that may increase the decay rate leading to tree death. SLF's
broad host range suggests that any potential for biological control of these
invasive plants using SLF must remain counterbalanced against the need to
protect agriculturally important tree fruit crops.
B. Agriculture in the Mid-Atlantic Region
Table 2 identifies the wide variety of agricultural production occurring throughout
the Mid-Atlantic region (USDA-NASS, 2014), and this includes potential SLF
host plants, such as stonefruit and grape crops. Although livestock are not a
resource USDA-APHIS expects to experience impacts related to either SLF
spread or control efforts because they are unlikely to rely on SLF hosts as food
sources, table 2 includes livestock information to aid readers in making
comparisons.
Table 2. Select agricultural statistics in the affected area1
Jurisdiction Number Acreage of Market Value Major Agricultural
of Farms Farms of Agricultural Commodities2
Products Sold
($1000)
Connecticut 5,977 436,539 550,620 Dairy, Turkeys, Cattle
and calves
Delaware 2,451 508,652 1,274,014 Broilers, Corn,
Soybeans
District of NA3 39,290 NA NA
Columbia
Maryland 12,256 2,030,745 2,271,397 Broilers, Corn,
Soybeans
New Jersey 9,071 715,057 1,006,936 Tomatoes, Blueberries,
Apples
New York 35,537 7,183,576 5,415,125 Dairy, Apples, Corn
11North Carolina 50,218 8,414,756 12,588,142 Broilers, Hogs, Turkeys
Pennsylvania 59,309 7,704,444 7,400,781 Dairy, Cattle and
calves, Mushrooms
Virginia 46,030 8,302,444 3,753,287 Broilers, Cattle and
calves, Turkeys
West Virginia 21,489 3,606,674 806,775 Cattle and calves,
Broilers, Turkeys
United States 2,109,303 914,527,657 394,644,481
1
Data is from the 2012 Census of Agriculture (USDA-NASS, 2014)
2 Based on 2016 Commodity estimates reported on March 8, 2018 in USDA-Economic Research Service State
Fact Sheets at https://www.ers.usda.gov/data-products/state-fact-sheets/
3 Data is not available.
Production of fruit in the Mid-Atlantic region is an important component of each
State's agricultural productivity, even though the total may be a small proportion
of U.S. productivity. For example, 2017 production of tart cherries in New York
was 4,500 tons, while the U.S. total was 119,100 tons
(https://www.nass.usda.gov/Data_and_Statistics/index.php). Grape and peach
production is summarized in table 3.
Table 3. Summary of 2017 Mid-Atlantic Grape and Peach Production
Jurisdiction Commodity1
Grapes Grapes Peaches
(tons) (Acres bearing) (tons)
Connecticut NA2 431 NA
Delaware NA NA 3,900
Maryland NA 528 NA
New Jersey NA 791 24,000
New York 175,000 36,919 7,000
North Carolina 7,000 2,685 4,200
Pennsylvania 91,000 11,779 19,000
Virginia 9,000 3,733 6,000
West Virginia NA 215 6,000
United States 7,505,300 NA 735,200
1
Data is from https://www.nass.usda.gov/Data_and_Statistics/index.php
2
NA = data is not available; data for the District of Columbia is not available
This information shows the wide diversity of agriculture in the Mid-Atlantic
region, and the closely allied natural resources near farm environments that could
become affected by SLF or control activities. In general, vegetation types vary
based on natural site conditions and changes that occur as people clear land for
development and agriculture (Yesilonis et al., 2016). In any given year, the
affected environment is likely to form a discontinuous patchwork of farms and
wooded areas. USDA-APHIS is not asserting all farms are alike, or that regional
and local variations in agricultural production do not exist and will not be
important. Instead, by focusing on the common features in the most likely area to
be affected, USDA-APHIS is trying to increase the potential for preparedness
throughout the region. USDA-APHIS anticipates discussions will occur with
12individual landowners and state and local officials as the need arises to
accommodate the specific resources during SLF outbreaks.
Urban, residential, and industrial areas occur throughout the region (see table 4).
Areas with extensive human development, such as cities and university campuses,
may have potential SLF hosts planted as part of the urban environment. For
example, the Philadelphia port complex handles the largest volume of
international shipping freight on the East Coast of the country. Close proximity to
local parks, such as Fairmount Park in the City of Philadelphia, suggests escaping
pests that hitchhike in imported commodities may find suitable host plants. SLF
uses inanimate materials for egg laying (such as stones, fence-posts, and outdoor
equipment) which would allow urban areas to add to the risk of SLF
dissemination (Dara et al., 2015).
Table 4. Select characteristics of the affected area1
Jurisdiction Population Land area in Population Major Cities2
Census square miles per square
mile
Connecticut 3,588,184 4,842.36 738.1 Bridgeport, New Haven,
Stamford
Delaware 897,934 1,948.54 460.8 Wilmington, Newark,
Dover
District of 601,723 61.05 9,856.5 Washington, D.C.
Columbia
Maryland 5,773,552 9,707.24 594.8 Baltimore, Bethesda,
Columbia
New Jersey 8,791,894 7,354.22 1,195.5 Newark, Jersey City,
Paterson
New York 19,378,102 47,126.40 411.2 New York City, Buffalo,
Rochester
North 9,535,483 48,617.91 196.1 Charlotte, Raleigh,
Carolina Greensboro
Pennsylvania 12,702,379 44,742.70 283.9 Philadelphia, Pittsburgh,
Allentown
Virginia 8,001,024 39,490.09 202.6 Virginia Beach, Norfolk,
Chesapeake
West 1,852,994 24,038.21 77.1 Charleston, Huntington,
Virginia Morgantown
United 308,745,538 3,531,905.43 87.4 New York City, Los
States Angeles, Chicago
1
Based on 2010 data (U.S. Census Bureau, 2017).
2
Based on population estimates at http://www.citypopulation.de
C. Land, Air, and Water Characteristics of the Mid-Atlantic Region
The mid-Atlantic's predominant physiographic characteristic is the Appalachian
Mountains that separate the eastern seaboard from the mid-West of the country.
There are six major geologic provinces in the mid-Atlantic region: (1) Coastal
13Plain, (2) Piedmont, (3) Blue Ridge, (4) Ridge and Valley, (5) Appalachian
Plateau, and (6) the Central Lowlands. Forming the boundary between land and
ocean, the Coastal Plain stretches 2,200 miles along the edge of the continent. At
the Virginia-North Carolina border, this province is about 120 miles wide, and
narrows sharply until it disappears in central New Jersey where Piedmont extends
to the ocean shore. The Central Lowlands occur only where Pennsylvania borders
Lake Erie (Rappole, 2007). The parallel series of ridges and valleys that
characterize the Piedmont Province generally run from the southwest to northeast.
The Piedmont extends westward from the Coastal Plain to the base of Blue Ridge
Mountains in Maryland, southern Pennsylvania, and Virginia. Inland of the
Piedmont is the Blue Ridge that runs about 550 miles long from Georgia to
Pennsylvania. North and west of the Blue Ridge is the Ridge and Valley system
that is only about 80 miles wide and consists of higher ridges and deeper valleys.
The Appalachian Plateau includes most of western Pennsylvania and West
Virginia (Rappole, 2007).
Typically recognized habitats in the mid-Atlantic are: (1) Coastal Waters and
Shoreline, (2) Freshwater Wetland, (3) Grassland, (4) Broadleaf Deciduous and
Mixed Forest, (5) Northern Mixed Hardwood, (6) Highland Coniferous Forest, (7)
Southern Floodplain Forest, and (8) Agricultural and Residential (Rappole, 2007).
Forest fragmentation and forest edge habitat are common in the region. Over time,
the process of deforestation converted land-cover from forestry to agriculture and
urban uses, including an extensive system of roads. The slope of the land
determines the amount and timing of sunlight, along with the soil moisture, and
consequent plant communities in any area. The slope of the land influences the
nitrogen and phosphorus export to streams as well as the soil loss associated with
agriculture (Jones et al., 1997). Soil erosion from removal of Tree-of-Heaven has
the potential to impact waters in the affected environment where ever tree
removal occurs, although there is reduced potential to impact erosion rates when
root balls remain and slowly decay over time (see discussion in Environmental
Consequences).
The Koppen-Geiger climate classification recognizes this region as predominantly
"Cfa" (Humid subtropical) and "Dfb" (Warm-summer humid continental), with
small areas between them as either "Cfb" (Oceanic) or "Dfa" (Hot-summer humid
continental) (Kottek et al., 2006). These climate areas do not have a significant
differences in precipitation among the seasons, and they all exhibit at least four
months averaging above 10C (Pidwirny, 2006). The Cfa humid subtropical
climate has hot, muggy summers and frequent thunderstorms. The coldest month
averages above 0C; and at least one month's average temperature is above 22C.
Precipitation during the mild winters comes from mid-latitude cyclones. Winters
in the Dfb warm-summer humid continental climate are severe with snowstorms,
strong winds, and bitter cold from Arctic air masses. The coldest month averages
below 0C, and the average temperatures for all months are below 22C. The Cfb
temperate oceanic climate has a coldest month averaging above 0C, and the
average temperatures for all months are below 22C. The Dfa hot-summer humid
14continental climate has a coldest month averaging below 0C, and at least one
month's average temperature is above 22C (Pidwirny, 2006). Others recognize
four major climatic zones in the mid-Atlantic as Austral, Carolinian, Alleghenian,
and Canadian (Rappole, 2007).
These features create favorable environments for a diversity of land uses ranging
from agriculture and natural areas to urban and industrial land use. Land use in
the region changes over time, as exemplified by reductions in agricultural land
enabling forest recovery from 1973 to 2000, and subsequent forest declines
caused by urban growth and development (Drummond and Loveland, 2010). Land
use changes also affect the populations and distributions of wildlife (Leonard et
al., 2017).
Karst density mapping shows many areas where sinkholes, surface depressions,
and caves may be associated with direct recharge zones to local and regional
aquifers, making these areas vulnerable to groundwater contamination (Weary,
2005). Naturally occurring dying or dead trees impact erosion in localized areas,
which influences downstream water quality.
As trees die, there is a reduced capacity to recharge oxygen in the atmosphere. If
the vegetation is replaced, then this type of short-term, indirect effect on air
quality would be unnoticeable. The release of chemical agents into the air is
another potential source of impact to air quality. In a larger context, impacts to air
quality influence human health, and could lead to changes in the climate. For
these reasons, it is necessary to consider the baseline air quality in the region.
The Clean Air Act (CAA) (42 U.S.C. §§ 7401 et seq.) is the primary Federal
legislation that addresses air quality (regulations are at 42 CFR parts 7401-7671).
In any given region or area of the United States, air quality is measured by the
concentration of pollutants in the atmosphere, and is influenced by surface
topography and prevailing meteorological conditions. The U.S. Environmental
Protection Agency (U.S. EPA) established National Ambient Air Quality
Standards (numerical concentration-based standards) for six criteria pollutants
that impact human health and the environment (40 CFR part 50). These pollutants
are common and accumulate in the atmosphere as a result of natural processes and
normal levels of human activity. They include carbon monoxide (CO), nitrogen
dioxide (NO2), ozone (O3), sulfur dioxide (SO2), small particulate matter, and
lead (Pb) (U.S. EPA, 2018a).
Evaluation of the potential for impacts from these types of pollutants uses an air
quality index (AQI) which is a measurement of the level of pollutants in the
atmosphere for a given area. An AQI above 100 indicates that air quality
conditions exceed health standards, while values below 100 indicate pollutant
levels are below air quality standards. An AQI that exceeds 100 suggests that air
quality may be unhealthy for certain sensitive groups of people, with more groups
being impacted as the AQI number increases (U.S. EPA, 2018a).
15There is a regional pattern of increasing nitrate deposition from south-to-north
that may reflect prevailing winds carrying air pollutants from other regions (Jones
et al., 1997). At higher elevations, the estimated nitrate and sulfate wet deposition
are greater because topographic features influence the deposition of rain and fog
water droplets that carry dissolved sulfates and nitrates. Surface ozone levels, on
the other hand, follow the distribution of urban areas rather than topography
(Jones et al., 1997).
In 2017, cities in Connecticut, Delaware, the District of Columbia, Maryland,
New Jersey, New York, North Carolina, and Virginia generally reported four or
fewer days with Unhealthy or Very Unhealthy Air Quality, with particulate matter
2.5 and ozone being the likely pollutants (https://www.epa.gov/outdoor-air-
quality-data/air-quality-index-report). Notable exceptions include Unhealthy Air
Quality reports on: (a) six days in Cumberland MD/WV likely due to sulfur
dioxide, (b) three days in Asheville NC likely due to sulfur dioxide, particulate
matter 2.5 and ozone, and (c) 27 days in Blacksburg-Christiansburg-Radford due
to sulfur dioxide and ozone. Pennsylvania cities reported Unhealthy Air Quality
for two or fewer days each at New York-Newark-Jersey City, Philadelphia-
Camden-Wilmington, and Pittsburgh with particulate matter 2.5, sulfur dioxide,
and ozone being the likely pollutants (U.S. EPA, 2018b).
Long-range transport of air pollutants downwind of emission sources is a
contributing factor for ozone pollution (Liao et al., 2014). Generally, reductions
of nitrogen oxide emissions are an effective ozone control measure, but where
volatile-organic compounds are limited, reducing nitrogen oxide emissions can
actually increase ozone. Air quality modeling shows this can occur in four major-
city non-attainment areas in the Mid-Atlantic region (Baltimore, Pittsburgh-
Beaver Valley, Philadelphia-Wilmington-Atlantic City, and Washington, D.C.).
The modeling found that the overall ozone benefits associated with decreasing
nitrogen oxides outweighed the harm from a slight increase in ozone (Liao et al.,
2014).
Streams and rivers carry water, and transport sediments, nutrients, and pollutants
downstream. Dams are relatively abundant in the region, with the highest
densities along the Delaware River and in southeastern Virginia. The Chesapeake
Bay is east of the Appalachians, and has estuarine and wetland habitats associated
with lowland areas and slowly draining soils. The region's water basins contain
numerous lakes, rivers, and streams, many of which have good water quality
while others may be impaired by various activities. There are more than 120
named watersheds in the region (Jones et al., 1997); Table 5 lists the water
resource sub-regions, and identifies other environmental important areas in the
region.
16Table 5. Summary of Environmentally Important Areas1
Jurisdiction Water Resource Lakes and/or Scenic Number of
Sub-Regions Rivers National State
Forests Parks
Connecticut Lower Hudson- First, Second, Third, and 0 101
Long Island Fourth Connecticut
Lakes / Eightmile and
Farmington Rivers
Delaware Delaware-Mid White Clay Creek 0 17
Atlantic Coastal,
Upper Chesapeake
District of Potomac None2 0 0
Columbia
Maryland Delaware-Mid None 0 49
Atlantic Coastal,
Potomac,
Susquehanna,
Upper Chesapeake
New Jersey Delaware-Mid Delaware, Great Egg 0 31
Atlantic Coastal, Harbor, Maurice, and
Upper Hudson Musconetcong Rivers
New York Delaware-Mid Lakes Erie, Champlain, Finger Lakes 188
Atlantic Coastal, St. Francis, Oneida,
Richelieu, Seneca, Cayuga, and
Susquehanna, Georgia / Delaware
Upper Hudson River
North Chowan-Roanoke, Lakes Kerr, Cherokee 35
Carolina Neuse-Pamlico, Mattamuskeet, and
Cape Fear, Pee Norman / Chattooga,
Dee, Edisto-Santee, Horsepasture, Lumber,
Ogeechee- and Kanawha Rivers,
Savannah Wilson Creek
Pennsylvania Delaware-Mid Lake Erie / Allegheny, Allegheny 110
Atlantic Coastal, Clarion, and Delaware
Potomac, Rivers, White Clay
Susquehanna, Creek
Upper Chesapeake
Virginia Lower Chesapeake, Kerr Lake / None George 41
Potomac, Upper Washington
Chesapeake and Jefferson
West Virginia Potomac Bluestone River George 37
Washington
and Jefferson,
Monongahela
1
Based on information available in Wikipedia.org (March 13, 2018).
2
None designated by the Federal managing agencies (Army Corps of Engineers, Bureau
of Land Management, National Park Service, Forest Service, or Fish & Wildlife Service).
17Hydric soils in the Mid-Atlantic region include depressional, fringe, riverine, and
slope wetlands, and mineral or organic flats (Vasilas and Vasilas, 2011).
Additionally, there are a wide range of problem hydric soils that complicate the
identification of wetlands in the region. The preferred habitats for many SLF
hosts do not include wetlands.
States are required to report impaired waterways to the U.S. EPA under section
303(d) of the Clean Water Act (CWA) (water quality regulations are at 40 CFR §
130.7(b)) (U.S. EPA 303(d), 2018) (see table 6). States identify all waters where
required pollution controls are insufficient to attain water quality standards, and
establish priorities for development of total maximum daily loads (TMDLs). Many
contaminants naturally occur in ground water, but crop fertilization and domestic
septic systems often cause elevated concentrations in ground water. Nitrate is a
U.S. EPA-regulated contaminant and its presence above the regulatory limit of 10
mg/L as nitrogen is a potential health risk (Greene et al., 2005). In the Mid-
Atlantic region, ground water has a greater than 50-percent probability of
contamination with nitrate (exceeding 3 mg/L) in agricultural areas where manure
is applied as fertilizer, or in areas overlying carbonate rocks or coarse sand
deposits. Ground water in areas with carbonate rocks may have a greater than 50-
percent probability of nitrate concentrations exceeding 10 mg/L (Greene et al.,
2005). Similarly, minimizing phosphorus from agricultural soils as a nonpoint
source of pollution in surface waters and shallow ground waters remains
important in reducing surface water eutrophication (Sims et al., 2002).
Table 6. Summary of Impaired Waters by State
Jurisdiction (Report Number of TMDLs Leading Causes of Impairment
Years for Assessed Waters on
and Impaired Waters) 303(d) List1
Connecticut (2016) 287 407 Algal Growth, Nutrients,
Polychlorinated Biphenyls
Delaware (2006) 101 581 Nutrients, Pathogens
District of Columbia 36 434 Pathogens, Polychlorinated Biphenyls
(2016)
Maryland (2012) 337 840 Mercury, Nutrients, Sediment and
Turbidity
New Jersey (2014) 763 665 Mercury, Pathogens, Metals other
than Mercury
New York (2014) 611 724 Mercury, Nutrients, Polychlorinated
Biphenyls
North Carolina 1,155 13,523 Mercury, Polychlorinated Biphenyls,
(2016 / 2014) Algal Growth
Pennsylvania 6,957 7,157 Sediment, Metals other than Mercury,
(2006 / 2004) pH/Acidity/ Caustic Conditions
Virginia (2014) 1,391 1,566 Polychlorinated Biphenyls, Mercury,
Organic Enrichment / Oxygen
Depletion
West Virginia (2014) 1,163 5,344 Mercury, Metals other than Mercury,
Pathogens
18Table 6. Summary of Impaired Waters by State
Jurisdiction (Report Number of TMDLs Leading Causes of Impairment
Years for Assessed Waters on
and Impaired Waters) 303(d) List1
1
Available through searches at https://ofmpub.epa.gov/waters10/attains_nation_cy.control
(U.S. EPA, 2018c)
D. Wildlife Concerns in the Mid-Atlantic Region
On August 2, 2012, USDA-APHIS and the U.S. FWS signed a memorandum of
understanding to promote the conservation of migratory bird populations in
compliance with Executive Order 13186, “Responsibilities of Federal Agencies to
Protect Migratory Birds". All of the states considered in this EA are part of the
Atlantic Flyway for migratory birds (U.S. FWS, 2018), and they manage
waterfowl hunting / regulations for their jurisdictions. The migratory bird flyways
are terrestrial and waterfowl pathways that birds follow to cross habitats (La Sorte
et al., 2014). Table 7 summarizes important areas in the region that birds depend
on for habitat (Audubon, 2018). While endangered or threatened species inhabit
some of these areas, other areas may be recognized for their capacity to support
populations of breeding or overwintering bird species, congregations of birds, or
serve as a migrant stopover or flyover area.
Table 7. Summary of Important Bird Areas
Jurisdiction Number of Areas1 Number of Total Acres
Global Continental State Counties
Connecticut 9 7 19 7 19,550
Delaware 1 3 3 3 287,721
Maryland 6 21 29 21 1,000,178
New Jersey 7 21 92 21 3,808,252
New York 16 56 111 56 7,511,385
North Carolina 32 67 53 67 4,879,672
Pennsylvania 4 61 73 61 1,456,467
Virginia 9 60 8 60 8,585,313
West Virginia 14 19 5 19 9,771,348
1
From http://www.audubon.org/important-bird-areas (Audubon, 2018).
To date, the potential for wild North American birds to overcome SLF prey
defenses and use SLF as a food source (despite distasteful defensive alkaloids and
layered behavioral responses) (Kang et al., 2016) is not known. Similarly, the
extent of the ability of U.S. native hemipteran populations (Arilus cristatus
(Linnaeus) and Apoecilus cynicus (Say)) to successfully prey on SLF is not yet
known (Barringer and Smyers, 2016).
Declines of pollinators and high mortality rates in honey bee colonies remain a
major concern since mass die-offs of colonies occurred in 2006–2007 (Seitz et al.,
192015). During the 2014-2015 national survey, self-identified causes of
overwintering mortality differed by operation size, with smaller backyard
beekeepers generally indicating starvation and weak colony in the fall as
responsible for colony losses, and commercial beekeepers who emphasized varroa
mites (Varroa destructor), nosema, and queen failure as causes. Multiple
interacting factors drive honey bee colony mortality including parasitization and
virus transmission by mites, other parasites and disease, poor nutrition due to
changing land use patterns and decreased forage availability, large-scale
replacement of nectar and pollen-rich legumes with synthetic fertilizers, and
sublethal impacts of pesticides (Seitz et al., 2015).
The diversity of land cover creates a variety of terrestrial and aquatic habitats for
other types of wildlife. Many wildlife species are common throughout the region.
As changes to the SLF control efforts occur, USDA-APHIS reinitiates
consultation with the U.S. Fish and Wildlife Service (FWS) on the proposed
program's potential to affect listed species and critical habitat in the program area.
Table 8 identifies the federally listed species USDA-APHIS and the FWS
previously consulted on for the SLF program.
Table 8. Summary of likely presence of Federally listed species in
representative counties in Pennsylvania
Scientific Name Common Status1 Counties where the species
Name are present or reported as
likely to be present
Alasmidonta heterodon Dwarf E Monroe
(Lea) wedgemussel
Bombus affinis Rusty-patched E Extirpated from Pennsylvania
bumblebee
Clemmys muhlenbergii Bog T Berks, Carbon, Delaware,
(Schoepff) (Muhlenberg) Lancaster, Lebanon, Lehigh,
turtle Montgomery, Monroe,
Northampton, Schuylkill
Myotis septentrionalis Northern long- T Berks, Carbon, Delaware,
(Trouessart) eared Bat Lancaster, Lebanon, Lehigh,
Montgomery, Monroe,
Northampton, Schuylkill
Myotis sodalis Miller and Indiana bat E Berks, Carbon, Delaware,
G.M. Allen Lancaster, Lebanon, Lehigh,
Montgomery, Monroe,
Northampton, Schuylkill
Scirpus ancistrochaetus Northeastern E Carbon, Lehigh, Monroe,
Schuyler bulrush Schuylkill
1
Endangered = E; Threatened = T; there are no proposed or candidate species for listing
present or reported as likely to be present in Pennsylvania (ECOS, 2017).
This section considered the baseline conditions in the Mid-Atlantic region by
focusing on suitable SLF habitat and features in the region where detections are
likely to occur in the near future. In general, the region exhibits environmental
20and agricultural characteristics that are repeated throughout the range, despite
local variations associated with altitude and slope. Aspects of water are important
because of the potential for removal of Tree-of-Heaven (as a program activity) to
contribute to local water quality issues via soil erosion. By removing only above-
ground portions of the plants, APHIS will reduce this potential for soil erosion.
There is much less potential for pesticide movement into waters, or soil with
adhered pesticide residues moving into waters, as discussed in the next section on
Environmental Consequences. The counties with Coastal Plain areas intergrade
with respect to shared resources that will influence the establishment and spread
of SLF.
21IV. Environmental Consequences
The types of environmental impacts considered for this EA are the same as in the
"Spotted Lanternfly Eradication Program in Berks, Lehigh and Montgomery
Counties, Pennsylvania Environmental Assessment" of May 2015 which is
incorporated by reference, except that the existing program is considered as a
source of cumulative effects for the future. USDA-APHIS finds the
environmental analysis still applies, except for the additional chemical exposures
that would occur in the additional counties. Under both alternatives, USDA-
APHIS anticipates SLF attacks on potential hosts on private and public lands,
leading to environmental changes where outbreaks may occur. USDA-APHIS
does not expect the range and extent of potential impacts to differ from those
analyzed in the original EA for Berks, Lehigh, and Montgomery Counties based
on surveys, egg mass scraping, sanitation, tree removal, and tree banding
activities.
The types of potential environmental impacts associated with the program's use of
pesticides (the insecticide imidacloprid, and herbicides triclopyr, imazapyr, and
metsulfuron-methyl) are the same as in the "Asian Longhorned Beetle Eradication
Program, Draft Programmatic Environmental Impact Statement – March 2015"
which is incorporated by reference (USDA-APHIS, 2015). Based on their
chemical similarities, the types of potential environmental impacts associated with
the program's use of dinotefuran are expected to be similar to those of
imidacloprid. The potential amount or quantity of environmental impacts
associated with insecticidal treatment is expected to be very low at any specific
site; and negligible overall in comparison to other agricultural uses.
A. No Action
Under the no action alternative, USDA-APHIS funding of control efforts would
allow each state to pursue its choice of activities. Other government agencies and
private landowners may work to eradicate SLF; however, there would be no
cooperative or coordinated efforts among USDA-APHIS and other stakeholders.
USDA-APHIS would not deploy regulatory controls, such as establishing
quarantines or commodity certification programs.
Without a Federal quarantine, there would be no Federal restriction on the
movement of SLF infested plant material. Harvested crops and nursery plants
would not be inspected, treated, or certified prior to movement and sale unless the
state chose to establish these activities as part of their actions. A USDA-APHIS
quarantine would facilitate safeguarding of local fruit stands, mandatory baggage
inspection at airports, and judicious use of road patrols and regulatory checks. The
lack of Federal quarantine actions associated with this alternative would allow
human-mediated transport of SLF in commodities and host plant materials
throughout the country.
22You can also read