Stan Walker & Giorgio di Scala
     Variable Stars South
←
→
Page content transcription
If your browser does not render page correctly, please read the page content below

Stan Walker & Giorgio di Scala
Variable Stars South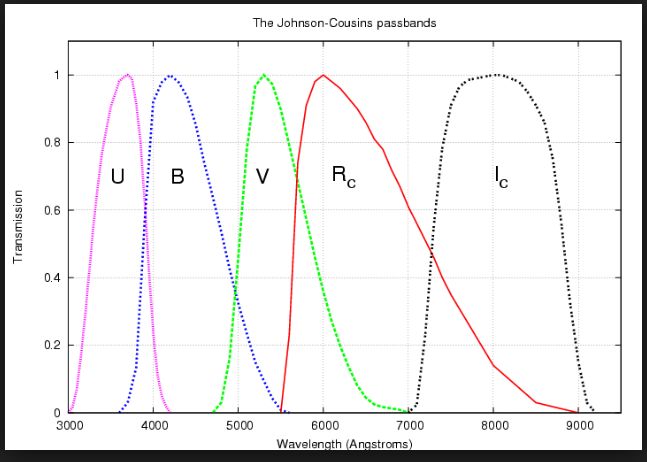
ABSTRACT
The first recorded maximum of R Centauri was in 1871
but reasonable coverage dates from only 1891. It
displays two clear maxima, which characteristic is
shared by less than a dozen others of the thousand or
so well studied Mira stars. We present observations of
the changing light curve shape and amplitudes with
supplementary UBV and BVRI measures which appear
to differ dramatically from other Miras. The pulsation
period is also changing, believed to be the result of a
helium flash, the onset of this period change in 1922
being perhaps the only one observed.
INTRODUCTION
Mira stars have been the mainstay of amateur visual observing for well
over a century. They have large amplitudes of up to ten magnitudes or
so – an intensity change of 10,000 times – and their periods suit
occasional measures at weekly or fortnightly intervals. The emphasis
is on time series photometry and monitoring periods and a few period
changes.
We can also divide the visual and near visual range into a series of
wavelength blocks using filters – mainly UBVRI where the available
measuring instruments are relatively inexpensive with an extension
into the near infra-red using J and H filters with about 5% of the
speed. K,L and M work in regions which require much more complex
equipment than amateurs generally have access to.
But the vast majority of the historical data is in the visual and near-
visual regions.
THE LIGHT CURVE THEN & NOW
                  The upper graph
                  shows the light
                  curve from 1924 to
                  1945. Below from
                  1995 to 2018.
                  During this period
                  of 94 years the
                  period changed by
                  more than 10% and
                  the overall shape of
                  the light curve
                  changed
                  dramatically.
CHANGES IN THE PERIOD
The upper graph
shows individual
intervals between
epochs of primary
maximum in blue,
with a 5 point
running mean
superimposed in
red.
0
The lower graph
-500 shows an O-C
diagram – the
-1000
cumulative
-1500 deviations from an
R Centauri JD 2404785 + 562E
ephemeris
-2000
0 10 20 30 40 50 60 70
O-C Maximum 2
80 90 100
describing the
original period.WHY HAS THE PERIOD CHANGED? During its evolution up the AGB a Mira star seems to undergo five types of period changes: ▪Normal evolution up the AGB – not directly observable ▪Helium flashes in the helium burning regions – decreasing period over two or three centuries? ▪Abrupt changes in period other than evolutionary – Mira itself ▪Large increases in period over several decades – BH Crucis, LX Cygni. ▪Period alternations of 1-3% over several decades – almost all Miras. In this paper we concentrate on what appears to be a helium flash event in R Centauri.
THE LIGHT CURVE IN THE 1970s
                                               The inverted U-B colour curve
                                               suggests either a hot companion
                                               or a strong shell of gas in
                                               emission.

                                               The B-V colour, brightest near
                                               the first maximum, indicates
                                               that the second maximum is
                                               overbright for its temperature.
                                               This suggests a larger radius for
                                               the second maximum.

During the interval from 1924 to 1971 when UBV measures began at Auckland
Observatory the period became shorter by 22 days
The hotter and now clearly more stable first maximum has been used as an
epoch marker – thus our epochs differ from many earlier analyses.
THE LIGHT CURVE IN THE 2010s
This shows a variety of
changes. The V amplitude of
the first maximum has
decreased from 4.3 to 3.0
magnitudes, the amplitude of
the second maximum from
4.3 to 2.0.
Whilst the first maximum is
static at phase 0.26 the
second maximum has shifted
from phase 0.63 to 0.72.
The B-V colour is fairly similar but shows almost no amplitude. The period
used was derived from ASAS3 measures made at a similar time to the di Scala
measures.WHAT ARE WE MEASURING?
Are these values real? Why is there
such a large range through different
filters?
Miras are cool stars with temperature
around 3000K. But amateurs are
working in a narrow range of
wavelengths .BVR filter s cover the
visual range with U picking up the UV
radiation from gas around the star, I
looking at radiation from hot dust
shells.
Some amateurs are using JH filters with
wavelengths of ~1220 nm and 1630 nm
but the photometers are quite slow and
crude as compared to CCD equipment.A COMPARISON OF LIGHT CURVES Apart from the shapes the amplitudes are interesting. That of R Centauri is much less in the I filter than AF Carinae and half a dozen other Miras, even the carbon star BH Crucis has a greater amplitude.
LIGHT CURVE FEATURES

1.   These data are fairly noisy – partly from secondary maximum instability
2.   Shortening period clearly shown
3.   Spacing of maxima increases
4.   Final decline from second maxima shorter as a result of 2 and 3 ?????
DUAL MAXIMA MIRAS TO WATCH
  V415 Velorum      10 03 30   -46 49.2   9.6    11.8    410~
  BH Crucis         12 16 17   -56 17.2   6.5    9.8     530:
  R Centauri        14 16 34   -59 54.8   5.8    9.0     500:
  R Normae          15 35 57   -49 30.5   6.4    12.0    507
  BX Carinae        10 52 06   -62 29.0   11.7   13.8    427
  TT Centauri       13 19 35   -60 46.7   9.0    13.4    462
  UZ Circini        14 20 52   -67 30.8   9.0    14.0    538
  BN Scorpii        17 54 10   -34 20.4   9.7
OTHER MIRAS TO WATCH
Sebastian Otero drew our attention to another star in 2017. The light
curve from ASASA3 appears below. From this a search of ASAS3 and
the International Databaserevealed a few other stars which might be
DMM objects but the measures are too scattered to be certain.
USEFUL B-V PHOTOMETRY
B-V colour photometry provides a useful indicator of temperature changes
during a pulsation cycle. With Miras exhibiting a smooth rise and falling
light curve this probably will not reveal anything unusual and is best
performed as part of BVRI or even UBVRI measures.

Miras are not simple stars, however. They have emission spectra, indicative
of a surrounding gas halo almost certainly associated with mass loss, a shell
or disc of dust which may create a degree of obscuration. This latter type of
event plays a major role in R Coronae Borealis fades, probably with the
fades of L2 Puppis and in the collapse of the disc in dwarf novae.

Perhaps this plays a part in R Centauri and others of these stars. The early
rise of R Telescopium and other Miras with humps on the rise may be in
part due to the interference of ejected material.
RADIAL VELOCITY MEASURES
Very few such measures have been made on Mira stars . A few of R Centauri
were made but in a semi-random manner. With these dual maxima stars
(DMM) and the unusual B-V colours of R Centauri this suggests that such
measures would be valuable in their case.
Such measures are best confined to the brighter objects and with the long
periods involved a good measure every 30 days when they are near
minimum, changing to every 10-15 days when bright.
Another area for this type of attention is found in stars with humps. Does the
star continue its normal surface contraction at this stage but become
somewhat dimmed by absorption of an ejected dust halo? It was interesting
that in the 1970s one explanation of Xray emission was suggested as arising
from interaction with a dust shell I some manner. With Miras most humps
occur not long after maximum radius/lowest gravity/maximum opacity when
the star is faint
MIRA COLOUR PHOTOMETRY
Study of Miras by RASNZ VSS, BAA, AAVSO TSP study of period changes
Success rate ~1-5% perhaps, per century – not all that exciting

Some Miras show humps and bumps on LC or Dual Maxima
These seem to be better candidates for period changes

Measure B and V with DSLR cameras to study temperatures
CCD cameras can do BVRI

These stars are bright in J and H but the amplitudes are low

Leave the standard TSP period change monitoring to the visual observers
CONCLUSION
There are many areas where amateurs can make very useful contributions to
astronomical research beyond visual measures of stars.

The simplest area is BVR photometry of brighter stars using DSLR cameras
with inbuilt filters

More expensive but able to reach fainter magnitudes is CCD photometry or
classical photometry using single star detectors.

BVRI photometry is suited to cooler objects, JH photometry extends this
into the infra red. UBV photometry is suited to hot and often massive stars.
Emission objects often require full UBVRI filters.

Variable Stars South has many projects with realistic short time scales for
results. Members exchange advice or mentor newcomers and cooperate on
specific targets. See our posters around this room.
You can also read