Statistical Agency Changes in Response to the COVID-19 Pandemic
←
→
Page content transcription
If your browser does not render page correctly, please read the page content below
Statistical Agency Changes in
 Response to the COVID-19
           Pandemic
  Interagency Council on Statistical Policy,
Subcommittee on Changes During COVID-19
                   Chairs:
           Megan Asdorian, USAID
            Mary Bohman, BEA
           William Wiatrowski, BLS
             Report Coordinator:
             Alyssa Holdren, BEA
               January 15, 2021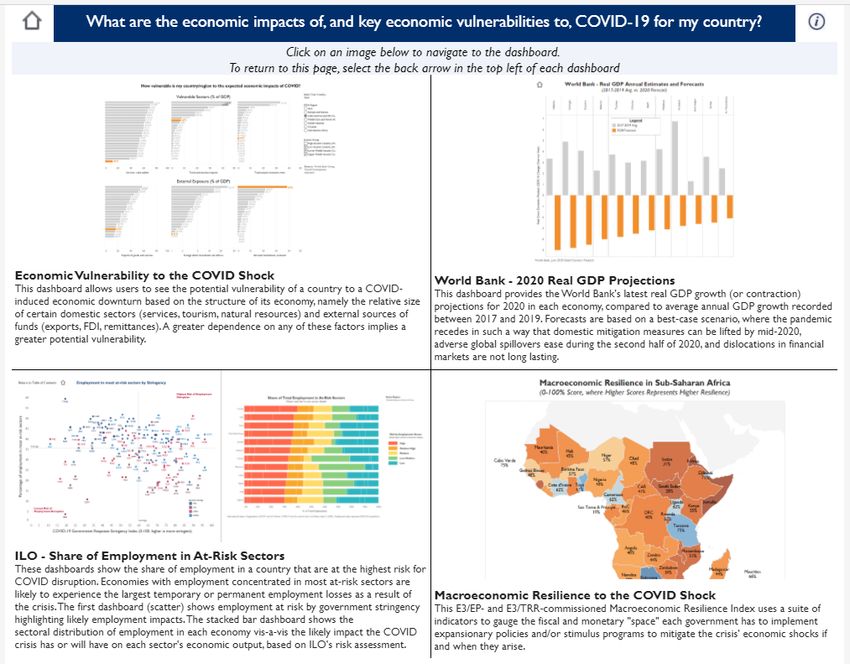
Report on ICSP Member Agency Changes Related to COVID-19 and
                             Key Lessons Learned

Executive Summary
The Interagency Council on Statistical Policy (ICSP) coordinates statistical work across the statistical
agencies and units of the U.S. government. The Council was established in 1989 and is led by the Chief
Statistician of the United States, an executive in the Office of Management and Budget. The Council was
expanded from its original 13 agency leads to its current 26 members through the Foundations for
Evidence-Based Policymaking Act of 2018. As the expanded group was beginning to identify its priorities,
COVID-19 struck. Like businesses and governments worldwide, ICSP agencies had to work quickly to
ensure staff safety and determine how best to carry on their missions.

ICSP agencies represent a wide variety of subject matters—from transportation, health, and education
to labor, consumer spending, and business activity—and nearly all those areas were affected by the
COVID-19 crisis. The pandemic brought with it numerous operational challenges, as well as a heightened
need for timely and relevant data on the rapidly changing landscape. As decision-makers pushed for
more data, faster, many statistical agencies reevaluated priorities among the elements of data quality,
placing greater emphasis on timeliness.

As the ICSP pivoted its monthly meeting schedule to virtual platforms, agenda items quickly turned to
the challenges and innovations related to COVID-19. By late spring 2020, the Council agreed to survey all
member agencies to gather input on how each had adjusted to the pandemic. Led by staff from the
Bureau of Economic Analysis, the Bureau of Labor Statistics, and the U.S. Agency for International
Development, the Council developed and administered a survey in August 2020. The survey had the
following focus areas:

    •   Staff and data collection changes
    •   Post-collection processing and publication changes
    •   Product innovations

By the close of collection in mid-September, the following 17 agencies provided detailed survey
responses:

  Bureau of Economic Analysis (BEA)                       National Center for Education Statistics (NCES)
  Bureau of Justice Statistics (BJS)                      National Center for Health Statistics (NCHS)
  Bureau of Labor Statistics (BLS)                        Nuclear Regulatory Commission
  Bureau of Transportation Statistics (BTS)               Social Security Administration, Office of
  Census Bureau                                           Research, Evaluation, and Statistics (ORES)
  Department of Housing and Urban                         U.S. Agency for International Development
  Development                                             (USAID)
  Department of Veterans Affairs                          USDA Economic Research Service (ERS)
  Environmental Protection Agency (EPA)                   USDA National Agricultural Statistics Service
  IRS Statistics of Income (SOI)                          (NASS)
  National Aeronautics and Space Administration
  (NASA)

                                                   1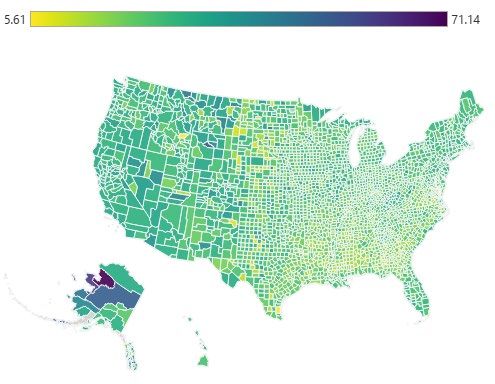
What follows are results, including in-depth spotlights of agency activities, that underscore the resilience
of the statistical agencies and the impressive work of their staffs. From an analysis of the responses, it is
clear that the pandemic has resulted in innovations that will continue and will propel the U.S. statistical
system to even greater success in the future.

While this report paints a vibrant picture of the government’s pandemic response, it does not attempt
to provide an exhaustive inventory of what statistical agencies are doing related to the coronavirus
crisis. 1 In addition, as with any survey, respondents can interpret questions in different ways, and the
choice of question wording impacts the responses. The analysis and conclusions in this report are
limited to the information gathered through the survey and directed follow-ups with respondents.

An overview of the responses and key takeaways for the three main parts of the survey, a list of
acknowledgments, and a timeline of major project milestones are included below. Additional detail and
analysis on the survey results is provided in the subsequent sections of this report.

Section A. Staff and Data Collection Changes

Purpose. The goal of this section is to highlight impacts to agency operations, including international
operations, effects of remote communication, and hurdles encountered while moving to maximum
telework.

Results summary. Overall, the results indicate that, while some obstacles arose, there was mild difficulty
adjusting to maximum telework and finding workarounds for operational issues.

Key takeaways. (1) Agencies are more resilient than they thought. In some way, whether large or small,
the pandemic turned all statistical employees into the leaders they needed to be and, instead of dividing
agencies, it reinforced the feeling that staff members are all human, and they are stronger together. (2)
Agencies can adapt quickly when necessary. The U.S. federal statistical system is large, decentralized,
and responsible for some incredibly complex and critical functions; however, agencies moved very
nimbly to address urgent issues and prioritize those with longer horizons. (3) As a population, statistical
agencies rapidly learned to perform and communicate remotely. ICSP members learned to communicate
better by WebEx, Zoom, Google Meet, and other remote platforms, as well as honed the skills and
etiquette connected with those venues. Agency employees quickly made up for the awkwardness
remote communication sometimes creates and learned to give each other latitude in meetings, whether
by smiling at a child who wandered onscreen or being forgiving while colleagues struggled through their
first “present slides” moments.

1
  For example, while not specifically highlighted in the survey results, the U.S. Census Bureau made major changes
related to the 2020 Census. In light of the COVID-19 outbreak, the Census Bureau adjusted 2020 Census operations
in order to: (1) protect the health and safety of the American public and Census Bureau employees; (2) implement
guidance from federal, state, and local authorities regarding COVID-19; and (3) ensure a complete and accurate
count for all communities. For more information, please visit www.2020census.gov.

                                                        2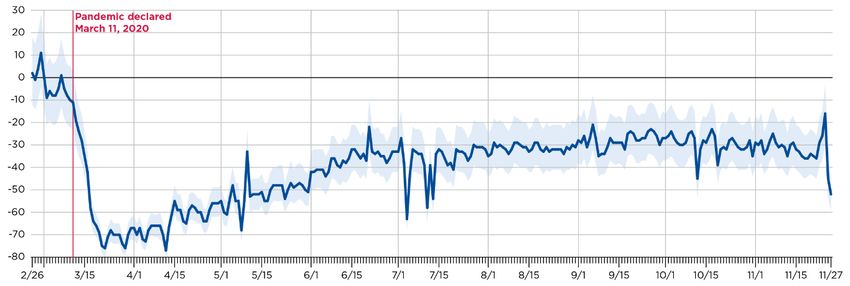
Section B. Post-collection Processing and Publication Changes

Purpose. The goal of this section is to call out areas of survey operations that may have been affected by
COVID-19, including data collection activities, the availability of source data, use of alternative data,
sampling, estimation, data adjustments, outlier detection and treatment, publication, and dissemination
vehicles.

Results summary. Six agencies reported making major changes in one or more survey programs. Most
agencies were able to make changes that they considered to be successful at addressing COVID-19
impacts on their surveys. The six respondents made major methodological changes, and some agencies
changed or added content to their release materials and made changes to the production of
publications. Most agencies formally documented changes in either estimation or data collection.

Key takeaways. (1) One shock spurs a multitude of responses. Just as no two sectors, industries, or states
have been impacted by the pandemic in the same way, the effects on U.S. statistical agencies and their
responses varied greatly depending on agencies’ unique objectives, structures, and programmatic
constraints. (2) Flexibility fosters positive results. ICSP members found innovative ways to adapt their
estimation methods and publication procedures. Thanks to the agility and pioneering spirit of the cadres
of dedicated employees supporting the U.S. statistical system, most pandemic-related changes were
deemed to be successful or very successful. (3) Documentation maps out the path to success.
Documentation is a critical step in implementing successful changes. Agencies leveraged a wide variety
of mechanisms for recording the impacts of COVID-19 and the related statistical changes. This wealth of
information provides a rich historical catalogue for guiding future statistical decisions.

Section C. Product Innovations

Purpose. The goal of this section is to break out and categorize examples of innovations in developing
new products across the statistical system, such as timelier or more frequent data releases, new
surveys, new products based on alternative data sources, and adapted estimation methods.

Results summary. About 80 percent of survey respondents indicated that they developed product
innovations related to COVID-19. The most common innovations included webpages devoted to the
pandemic, new output like tables and graphs, research papers, and new questions added to existing
surveys. Most innovations were developed through existing offices or structures or through new internal
working groups; however, partnerships with other agencies, with other operating divisions, and with
international or local teams were also critical to standing up new products and services. In addition,
agencies intend to continue most of these innovations, even if only for an uncertain or indefinite
amount of time.

Key takeaways. (1) Crisis is an opportunity. The pandemic presented statistical agencies with
unparalleled circumstances through which to develop new products and services in a rapid-fire
environment with accelerated feedback loops. (2) Communication impacts everything. The uncertainties
of the pandemic heightened the need for timely, transparent communication around the government’s
statistical offerings. (3) Get creative with resources. Statistical agencies are casting a wide net for pulling
in the resources they need to continue to deliver timely, relevant, and high-quality products and services
during the ongoing crisis.

                                                      3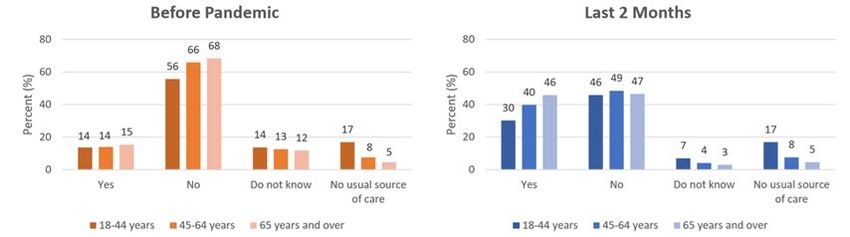
Acknowledgments
Survey respondents. Thank you to the 17 ICSP members and their agency contacts who filled out the
survey and addressed follow-up questions from subcommittee members. Without the invaluable input
of these organizations, this report would not have been possible.

Report coordination. Thank you to Alyssa Holdren of BEA who served as the report coordinator. She
developed the framework for reporting the results and edited the report for consistency and clarity.

Survey and cognitive experts. Thank you to Jennifer Hunter Childs and Alda Rivas of the Census Bureau
survey team, as well as William Mockovak, a BLS cognitive review expert, who ensured that the survey
was presented in an easy-to-understand and navigate format, that the survey was targeted to collect
the most relevant information, and that survey responses were provided to the subcommittees in a
secure, easily accessible file.

Publications staff. Thank you to Joseph Meisenheimer and the BLS publications staff who compiled and
harmonized the charts for this report.

Subcommittee members. Thank you to the members of the three subcommittees and their colleagues
who developed the survey, analyzed the responses, and assembled the report of the results.

     Staff and data collection       Post-collection processing and           Product innovations
             changes                       publication changes
   Megan Asdorian (USAID)            Bill Wiatrowski (BLS) (chair)        Mary Bohman (BEA) (chair)
   (chair)                           Jeremy Oreper (BLS)                  Dennis Fixler (BEA)
   Vivian Ranson (USAID)             Joe Piacentini (BLS)                 Chris Grubb (State Department)
                                                                          Virginia Harris (NASS)
                                                                          Alyssa Holdren (BEA)
                                                                          Jennifer Hunter Childs (Census
                                                                          Bureau)
                                                                          Brian Moyer (NCHS)
                                                                          Rolf Schmitt (BTS)

Project Timeline
April 2020: The ICSP established three subcommittees tasked with collecting feedback on the
pandemic’s effects on agency operations in the areas of staff and data collection changes, post-
collection processing and publication changes, and product innovations.

April–June: The subcommittees developed group charters, outlined plans and priorities, and drafted
preliminary survey questions.

July–August: Ultimately, the subcommittees merged into one group with an overarching purpose of
gathering information on the impacts of COVID-19. They combined the questions from the three
sections into one survey; coordinated with the team of survey experts from the Census Bureau to
upload the questions into Qualtrics—an online survey software—and test survey functionality;
consulted with BLS cognitive experts to review the survey for consistency, logic, and flow; and finalized
the survey for posting.

                                                    4
September: The survey was open for responses from August 26–September 28. Once the survey was
closed, the Census survey team compiled the results and sent them to the chairs of the subcommittees
via Kiteworks, a secure messaging platform.

October–December: The subcommittees analyzed the survey responses and drafted a report of the
results, coordinating with agency contacts to clarify responses, gain approval for specific examples used
throughout the report, and address any confidentiality concerns. Subcommittee chairs presented initial
results at the November ICSP meeting.

December 2020: The subcommittees provided the draft report to ICSP members for comment,
incorporated feedback, and released the final report on agency changes related to COVID-19.

                                                    5
Section A: Staff and Data Collection Changes
Summary
This section presents information on the extent to which the pandemic has impacted ICSP member
agencies’ ability to operate, concetrating on effects related to staff transitioning to full telework and the
core activity of collecting mission-critical data—whether used to perform statistical operations, produce
statistical datasets, make management decisions, help inform policy, or formulate programmatic
decisions. Highlights of this section include: lessons learned, an overview of survey results, summaries of
more detailed responses, and specific agency spotlights.
Key Takeaways
Agencies are more resilient than they thought. In early 2020, agencies moved from the status of a public
health emergency of international concern (PHEIC) to a global pandemic and began experiencing the
operational and emotional effects of lockdown and remote telework. In the beginning, agencies were
uncertain how well they would be able to adjust and find workarounds for some of their most critical
responsibilities. Many ICSP members had or still have people in the field that needed to be kept safe,
and for some agencies, that includes overseas locations. As government entities, statistical agencies
needed to ensure that they could still perform critical functions for the public and, as humans, agency
staffs needed to understand how to deal with a workforce experiencing change, and often grief, on a
massive scale. What could have been a failure of huge proportions turned into a real-time exercise in
resilience and survival. In some way, whether large or small, the pandemic turned all statistical
employees into the leaders they needed to be and, instead of dividing agencies, it reinforced the feeling
that staff members are all human, and they are stronger together.
Agencies can adapt quickly when necessary. The U.S. federal statistical system is large, decentralized,
and responsible for some incredibly complex and critical functions; however, agencies moved very
nimbly to address urgent issues and prioritize those with longer horizons. Some ICSP members were
able to rapidly reprogram funds to address critical COVID-19 objectives instead of using them to conduct
normal, but not critical, activities. Some were able to leverage accelerated contracting mechanisms to
put surge support in place or draw from existing pools of qualified candidates, for example, retirees who
were willing to re-engage on a temporary basis or Peace Corps volunteers returning from the field.
Many agencies stood up websites and dashboards to reflect real-time status and trends, so that they
could respond appropriately. And when faced with barriers to normal data collection activities, agencies
found appropriate proxy data and collection alternatives.
As a population, statistical agencies rapidly learned to perform and communicate remotely. One of the
main staff concerns moving into full-time telework was how “artificial” communication and remote
platforms would affect the quality or tone of interactions. Many employees were trepidatious about the
loss of physical cues and information gained from in-person meetings and whether they would lose the
ability to truly connect with each other. Happily, the results showed that this did not seem to be as
much of a problem as some anticipated. ICSP members learned to communicate better by WebEx,
Zoom, Google Meet, and other remote platforms, as well as honed the skills and etiquette connected
with those venues. Managers avoided the human temptation to micromanage as a means to find control
in times of great uncertainty. Agency employees quickly made up for the awkardness remote
communication sometimes creates and learned to give each other latitude in remote meetings, whether
6by smiling at a child who wandered onscreen or being forgiving while colleagues struggled through their
first “present slides” moments.
Survey Response Overview
Pandemic impact on ability to capture, process, and release data. About half of the survey respondents
(9 out of 17) indicated that the pandemic was somewhat impactful on their agencies’ ability to capture,
process, and release data. For 3 agencies the pandemic was very impactful, and for the other 5 agencies,
it was a little impactful or had no impact at all.
Ease of transition to remote work. While agencies generally had a relatively easy time transitioning their
workforces to full telework, about two-thirds of respondents indicated that some parts of their
workforces had difficulty making this transition. For a summary of the difficulties that agencies faced in
transitioning certain parts of their workforces to telework, see Table A1.
7Benefits of telework. Respondents listed many benefits of switching to maximum telework and
conducting operations remotely. Results fell into five categories: enhanced IT, telework, and remote
communications skills; innovative and creative solutions; better work-life balance; productivity and
organization; and teamwork, resilience, and flexibility. For more information, see Table A2.
Greatest challenges related to telework. Of the 17 respondents, only one agency indicated that they
experienced no challenges, and one agency responded that they experienced every challenge listed.
Childcare was noted as the most severe challenge that agencies experienced as they moved to full
telework (11 responses), followed by interpersonal communications issues (9 responses) and then
technological communications issues, lack of adequate equipment, and VPN interruptions (each with 7
responses). For childcare, due to the nature of COVID-19, simply hiring additional help or home services
was mostly not an option. Family members overwhelmingly felt the pressure of caring for others while
trying to balance an increased workload. For a summary of the solutions agencies developed to address
their greatest challenges, see Table A3.
8Primary response agencies. Three agencies identified themselves as primary response agencies—the
National Center for Health Statistics, the Environmental Protection Agency, and the United States
Agency for International Development (USAID); however, there are many other primary response
agencies, like the Federal Emergency Management Agency and the Centers for Disease Control and
Prevention, that were not included as part of this survey.
Some of these agencies temporarily shifted their operational focus from their core missions to pandemic
response. For example, for USAID, this shift involved using surge personnel, re-programming existing
development funding to instead fund pandemic response activities, and rapidly programming
emergency supplemental funds granted by Congress. For this reason, primary response agencies may
have experienced more delays in conducting regular programs and producing regular products on
schedule. For more information on the impacts on primary response agencies, see Table A4.
Staffing disruptions. Approximately 75 percent of respondents reported no staffing disruptions. For the
rest, top disruptions were with local partners who were unable to continue assigned work and staff not
properly equipped to work 100 percent remotely. In addition to the provided options, agencies noted
issues with credential renewals, equipment failures, and contacting employees who did not report in.
9Alternative data collection methods. The most common changes to planned or existing data collection
methods were alternative modes of data collection or technology solutions and changes in schedules for
data collection (9 responses each).
In addition to the options specifically listed in the survey, respondents noted a variety of other
workarounds to traditional data collection methods, including the following:
• Data collected by large firms
• Liberal granting of filing extensions for survey respondents
• Modified language in respondent communications to encourage electronic filing and offer
suggestions to help respondents experiencing difficulties
• Shifting staff between units to make extra phone calls for surveys experiencing low response
• Developing procedures for processing faxed and mailed survey responses remotely
• Virtual field testing of new survey questions
• Strengthening partnerships
• Changing methods for preliminary estimates
• Altering data collection and non-response follow-up schedules
10Delivery of core products/deliverables. About 80 percent of respondents (14 out of 17) indicated that
they were able to release most or all of their products, with a majority being on schedule (10 out of 14).
One agency delivered some products on schedule. One agency responded that activities were limited to
data collection only, and the other agency noted that most of the deliverables for 2020 were on track
but expected that data delays would significantly impact products in 2021.
Factors negatively impacting delivery schedules. Seven respondents noted negative effects on their
delivery schedules. The most common factor was the inability to conduct needed in-person operations
(4 responses).
11Survey Response Details
This section provides summaries for more detailed responses to specific survey questions, as well as
“Impact Spotlights” for two agencies—the Bureau of Transportation Statistics and the United States
Agency for International Development—that demonstrate some of the ways that ICSP members have
tackled the staff and data collection challenges of the pandemic.
Difficulties in transitioning to full telework. Although there were many reasons agencies cited for why
certain parts of their workforces had difficulties in transitioning to 100 percent remote work, responses
fell into the four general categories shown in Table A1.
Table A1. Summary of Difficulties in Transitioning Certain Parts of Workforce to Full Telework
Category Staff Description
Need to be physically present to Customer service staff Duties that could not be done
perform in-person activities Call center employees remotely, like processing lab samples,
Budget offices testing vehicles, scanning mail,
Printing and mail staff printing publications, collecting “wet”
New hires signatures, traveling for job
IT professionals requirements, collecting data, issuing
Field workers IDs, testing and deploying hardware
Retirement services staff Activities that technically could be
Facilities maintenance personnel done remotely but were viewed as
inappropriate or especially difficult,
such as performance reviews and new
hire onboarding
Handling confidential and classified Data collection staff Manipulating personally identifiable
information Supporting subject matter experts information (PII) and other protected
data; handling classified information
in secured locations; using secure
equipment, accounts, or programs
Not trained or ready for remote work Contract data collection staff Never teleworked before, not used to
Technical experts working remotely, not trained on
New hires remote work, lacking IT skills, missing
the necessary infrastructure and
equipment, software difficulties
Significant shift in work burden Potentially all types of positions Additional family responsibilities, too
many meetings, some handled new
working environment better than
others
12Benefits of telework. Respondents indicated that there were a variety of benefits associated with the
switch to maximum telework. The responses fell into the five categories shown in Table A2.
Table A2. Summary of Benefits of Full Telework
Category Description
Enhanced IT, telework, and remote Expanded telework policies, a greater understanding of what can be
communications skills accomplished in a telework environment, successful remote execution of most
business processes, more seamless connections between multiple locations,
more deliberate and effective communications, deploying and learning to use
new and improved communications technologies, increased remote training
capacity, decreased reliance on “paper” processes, greater flexibilities in data
collection and processing while maintaining confidentiality restrictions
Innovative and creative solutions More productive and innovative approach to developing and disseminating
data products; more creativity in holding meetings, hearings, and briefings;
developing new ways to accomplish activities that required travel; opportunity
for full-scale evaluation and testing of emergency preparedness protocols; sped
up the adoption of digital collaboration tools
Better work-life balance More flexible hours and often more time dedicated to work, ability to join
meetings during extended hours that would have been spent commuting, fewer
meetings, more time for uninterrupted work, postponed retirements, increased
physical well-being, allowed people to take care of family while still fulfilling
work responsibilities, more time with family, greater awareness of the need for
work-life balance and increased willingness to accommodate this balance, drop
in leave requests, seeing the sunshine
Productivity and organization Clearer purpose for meetings, notes being taken routinely and shared with right
audiences, better meeting participation, easier to focus on tasks requiring
concentration, less disruption from open office spaces, more accessibility for
internal meetings, workforce is more outcome-oriented, staff communicate
more transparently with supervisors regarding deliverables, more efficient and
simultaneous clearances, more accurate documentation, increased late-day
energy from the home environment
Teamwork, resilience, and flexibility Knowledge that workforce is quite flexible and adaptable, feeling that
leadership has staffs’ best interests at heart, re-validating that employees can
work well under stress, encouraged that the agency was able to continue its
mission with little to no disruption, increased appreciation for others’ work,
more frequent meetings for information sharing and morale checks, reviewing
and reinforcing best practices, colleagues making an extra effort to remain
engaged, increased collaboration, easier access to co-workers
13Solutions to telework challenges. Specific responses on how agencies addressed their greatest
challenges related to teleworking fell into the five categories shown in Table A3.
Table A3. Summary of Solutions to Telework Challenges
Category Solution
Lack of childcare/family care Maximum flexibility in scheduling duty hours, additional leave categories to
provide more leave time, flexibility in performing the number of work hours
Internal personal communications Rapid adoption of remote conferencing and digital collaboration technologies,
issues meeting presenters and participants quickly learned new skills, sending periodic
updates to all staff about major agency items, creating pandemic intranet pages
with resources for staff and the latest operational information, using a pilot
program to set up field workers for telework who were not previously eligible,
coordinating with IT and management to oversee workers in remote
environment
Lack of adequate equipment Equipment flexibilities and options for employees who were not equipped to
telework (like allowing employees to use their personal laptops)
VPN interruptions/lack of secure and New processes for handling protected data (for example, earlier data
stable conferencing tools “scrubbing” and deploying new platforms to allow secure access), expanded IT
services to allow additional simultaneous VPN connections
Tasks requiring physical presence Limiting the number of people who can be physically present at a facility to
comply with public health guidelines, designating a limited number of staff that
may access facilities, using contact tracing systems, increased cleaning
protocols, limiting time in facilities, moved in-person data collections to remote
collection only (but with lower response rates)
14Primary response agencies. The three respondents who identified as being from primary response agencies provided details on major impacts to
their normal operations related to COVID-19 and rated the success of those responses. These results are shown in Table A4.
Table A4. Impacts on Primary Response Agencies
Agency Impact 1 Rating Impact 2 Rating Impact 3 Rating
National Center for Modifying data collection Extremely Repurposing, expanding, and Extremely Reallocating resources, Very
Health Statistics (for example, moving from successful creating surveys to address successful especially given the successful
in-person to phone key public-health-related requirement to participate
interviews); for select issues associated with the directly in the pandemic
physical examination pandemic response of the Department
surveys, halted data of Health and Human
collection Services
Environmental Reviewing and registering Extremely Developing interim EPA Extremely Holding public hearings and Very
Protection Agency antimicrobial pesticides, successful COVID-19 Health and Safety successful meetings virtually successful
(EPA) which include disinfectants Guidelines for Field Activities
for use on pathogens like to provide an integrated set
SARS-CoV-2, the novel of safety and health guidance
human coronavirus that for timely and consistent
causes COVID-19 information for employees
conducting field activities to
reduce risk of COVID-19
exposure to EPA field staff,
regulated entities, and the
public
United States Rapidly reprogramming and Very Inability to use certain Very Redirecting staff attention Very
Agency for redirecting funds to respond successful common technology successful from normal operations to successful
International to COVID-19 platforms that are used by COVID-19 response activities
Development partners due to security risks
15Impact Spotlight: Bureau of Transportation Statistics (BTS)
COVID-19 Data Collection and Estimation Adaptations
For BTS, data collection and staffing challenges were less severe than for most agencies because its big
data collections are conducted by the Census Bureau. The in-person data collections involve a group of
nine staff who process monthly submissions of data with few confidentiality restrictions from
commercial airlines and a similar number of staff and contractors who deal with close calls data. Since
BTS already had a liberal telework policy, the shift to working at home was relatively easy.
The biggest adaptations related to COVID-19 were: (1) a shift to producing daily and weekly products
based on data from mobile devices, turnstile counts from major transit properties, and similar sources,
and (2) the replacement of extrapolated historical trends with other methods for preliminary estimates
of current conditions.
Daily Travel During the COVID-19 Public Health Emergency:
Average Percent of People Staying at Home by County,
November 2020
Source. U.S. Department of Transportation, Bureau of Transportation Statistics. Chart available at:
www.bts.gov/map-activity-state-or-county/.
16Impact Spotlight: United States Agency for International Development (USAID)
COVID-19 Analytics Dashboard
Description. COVID-19 spurred an extreme need in the international development community for timely
data on the pandemic and its country-level impacts. In response, a growing number of COVID-related
data resources emerged and continues to evolve to this day, but it is not always easy to understand the
differences in sources or their relevance to specific analytical questions. USAID resourced a COVID
Analytics Team, originally part of its COVID-19 Task Force, that curates an evolving set of data resources
to help USAID staff assess the first- and second-order impacts of COVID-19 at the country and regional
levels.
Lesson Learned—A Need for Demonstrating Data Analysis. In addition to a curated list of COVID-
related data resources and a dashboard displaying country-level disease burden alongside relevant
contextual and USAID programmatic information, the COVID Analytics Team realized that many USAID
staff lacked capacity or bandwidth to identify relevant data and analyze them for insights. Based on
feedback from overseas missions, the team built an additional resource called the Master COVID-19
Accompaniment Tool for Analysis (MCDATA), a suite of Tableau-based dashboards that helps answer key
thematic questions about the first- and second-order impacts of the COVID-19 crisis (for example,
disease projections, mobility, country coping capacity, economic impacts, civil disorder, gender impacts,
etc.). This resource enabled USAID staff to more quickly assess impacts of the COVID-19 crisis in specific
countries, as well as to better articulate areas of further analytical need.
The following graphic contains sample views from MCDATA on COVID-19 impacts. These dashboards pull
from multiple third-party sources.
17Section B. Post-Collection Processing and Publication Changes
Summary
This section outlines the impacts on statistical methods and operations related to COVID-19, the main
lessons learned, summaries of the results by agency, and specific agency examples. Survey respondents
reported on changes in the following areas:
• Estimate production. Changes in how data are stored, transmitted, accessed, secured,
processed, and tabulated
• Estimation methods. Changes in nonresponse adjustment, seasonal adjustment, outlier
detection and treatment, modeling and projections, use of alternative data, and tracking or
measurement of estimate quality
• Statistical release production and publication. Changes in how releases are produced, reviewed,
and cleared; how they are secured prior to publication; and how they are published and
disseminated
• Statistical release content. Changes in the content of news releases or accompanying material,
such as substantial suppression of unavailable estimates; the inclusion of special explanations or
interpretations of statistics; and the addition of notices of changes to data collection, estimation
procedures, or responses rates
• Documentation. Formal steps taken to document changes in data collection or estimation
procedures
Respondents were asked to provide one or two examples that resulted in the greatest changes and to
explain what prompted the changes, what changes were made, and how successful was each change.
Key Takeaways
One shock spurs a multitude of responses. Just as no two sectors, industries, or states have been
impacted by the pandemic in the same way, the effects on U.S. statistical agencies and their responses
varied greatly depending on agencies’ unique objectives, structures, and programmatic constraints.
While all respondents indicated that they made major methodological changes, the substance of those
changes covered a wide spectrum, everything from producing timelier datasets, to adjusting standard
estimation processes, and finding alternatives to in-person data collection. Despite these differences, all
agencies had one thing in common—an overarching drive to uphold their missions and continue to
provide exemplary service to the American public despite the challenging and unprecedented times.
Flexibility fosters positive results. ICSP members found innovative ways to adapt their estimation
methods and publication procedures. Agencies harnessed alternative data sources, deployed new
technologies, modified calculations and models, and partnered with stakeholders to introduce changes
quickly and effectively. Thanks to the agility and pioneering spirit of the cadres of dedicated employees
supporting the U.S. statistical system, most pandemic-related changes were deemed to be successful or
very successful.
Documentation maps out the path to success. Documentation is a critical step in implementing
successful changes. Agencies leveraged a wide variety of mechanisms for recording the impacts of
COVID-19 and the related statistical changes. Internally, ICSP members updated and expanded
18operations manuals and maintained detailed logs of changes. For the public, agencies published
extensive explanations of new statistics and changes in methods; provided guidance on how to interpret
data impacts (for example, explaining the explosion of remote learning in the context of education
statistics); and released FAQs, special analytical tables, and technical notes. This wealth of information
provides a rich historical catalog for guiding future statistical decisions.
Survey Response Overview
Six agencies responded that they made major processing or publication changes in one or more
programs:
• Bureau of Economic Analysis (BEA)
• Bureau of Labor Statistics (BLS)
• Bureau of Transportation Statistics (BTS)
• National Center for Education Statistics (NCES)
• National Center for Health Statistics (NCHS)
• United States Agency for International Development (USAID)
Each of the six respondent agencies indicated that they made major methodological changes. Some
agencies changed or added content to their release materials, and some agencies made changes to the
production of publications. Only one agency made operational changes in how estimates are produced.
Most agencies (5 out of 6) formally documented their changes in either estimation or data collection.
Most agencies (5 out of 6) indicated that they were able to make processing and publication changes
that they considered to be successful or very successful at addressing COVID-19 impacts.
19Survey Response Details
The next section provides information from the six respondent agencies. Table B1 includes highlights of
the changes, followed by descriptions of the specific results. In addition, three “Methodology
Spotlights”—from the National Center for Education Statistics, the Bureau of Labor Statistics, and the
National Center for Health Statistics—draw attention to how changes were implemented across the
statistical system.
Note. In reviewing the detailed responses, it became apparent that agencies interpreted some questions
differently. For example, while BEA did not indicate formal changes to their documentation processes,
their discussion of information placed on their website and elsewhere made it clear that documentation
was prepared. Other agencies may not have considered that their activities rose to the level of
methodological changes, but discussions across ICSP members indicated that all agencies were
disrupted, and nearly all had to make changes to continue production. This report is limited to highlights
provided in the survey.
Table B1. Highlights of Processing and Publication Changes Due to COVID-19
Agency Process Content
Bureau of Economic Analysis New data sources New data sources allowed for more
timely information on changes in
consumer spending patterns
Bureau of Labor Statistics Change in estimation procedures Adjusted employment and hours
estimates to reflect rapid changes in
labor force
Bureau of Transportation Statistics New data sources New products with daily and weekly
release cycles
National Center for Education Data collection interrupted by school Changes due to move to remote
Statistics closings learning
National Center for Health Statistics Move to telephone interviews Incorporate effects of COVID-19
deaths and infections into estimates
U.S. Agency for International Use of alternatives to in-person data New model-based estimates of the
Development collection; use of proxies impact of the pandemic
Bureau of Economic Analysis (BEA). Changes at BEA were primarily driven by the large shift in consumer
spending patterns starting in March and the need to continue to produce timely and accurate data that
allow users to better understand changes in the economy. New data on individuals’ daily credit card
transactions were acquired and integrated with traditional quarterly data in order to replace monthly
values based on linear trend extrapolation. BEA provided detailed explanations of its statistics in relation
to the pandemic and included notices of changes to estimation procedures in its release materials. In
addition, BEA established a central landing page on its website that collates and centralizes information
and analytical materials related to COVID-19.
Bureau of Labor Statistics (BLS). Changes at BLS were primarily driven by the rapid decline in
employment that occurred between the March and April reference weeks. Both the calculation of hours
worked in the productivity estimates and the estimate of the adjustment to employment due to
business birth and deaths were changed. BLS provided additional information about the impact of the
pandemic on its data, including adding details on collection changes and maintaining a running log of
20changes. All staff moved to telework, so changes were made to allow for full estimation review to be
conducted off-site through secure video.
Bureau of Transportation Statistics (BTS). Changes at BTS were primarily driven by the break from
historic trends in the data, especially for air travel, and the need to inform Department of
Transportation leadership and the public of dramatic shifts in the data. Estimates of airline travel were
discontinued and replaced with preliminary observations from large respondents. New sources of more
timely data were added, and products were developed with weekly or daily release cycles. Finally, BTS
adopted new procedures for processing data while on telework and developed and updated operations
manuals to cover the changes.
National Center for Education Statistics (NCES). Changes at NCES were primarily driven by the outsized
impact of COVID-19 on school operations. Population estimates were adjusted, changes to calculations
and models were introduced, and dataset timespans were truncated and noted, as appropriate. NCES
documented all changes and caveats, including issuing special guidance on the estimation impacts of
remote learning.
National Center for Health Statistics (NCHS). Changes at NCHS were primarily driven by the need to
rapidly incorporate the effects of COVID-19 deaths and infections into the estimates being produced.
This need was fulfilled by a combination of earlier access to data from states on provisional death
counts, transitioning to phone interviews, additional data review, accelerated news releases, new data
presentations, and a new revisions process. In addition, NCHS prepared full, formal documentation of
the changes, including extensive explanations of the new statistics for data users.
U.S. Agency for International Development (USAID). Changes at USAID were primarily driven by the
inability to travel and conduct in-person data collection, paired with the need to provide timely COVID-
19 related information. USAID shifted to virtual interviews, electronic or mobile phone data collection,
and remote reporting. The agency began exploring the use of proxies to estimate essential indicators
and started working on a centralized platform of indicators and partner data to project the impacts and
outcomes of COVID-19 and the pandemic response. In addition, staff worked with partners in academia
and private industry to model first-order, secondary, and tertiary effects of COVID-19 on programming,
as well as on health systems resilience and health outcomes. Some projects were put on hold if
alternative methodologies could not be put in place.
Note. USAID was the one agency that did not indicate that its changes were successful or very
successful. A major challenge for USAID was relying on in-person data collection, which became nearly
impossible in many circumstances. This reliance required changes that needed considerable flexibilities
(for example, alternative delivery schedules, new data sources, extended timelines, contractual
modifications, and technological adjustments), leading to greater barriers to successful adaptation than
what other agencies faced.
21Methodology Spotlight: National Center for Education Statistics (NCES) Data Collection Changes
Changes made at NCES because of the pandemic were driven by two factors. One was that schools
abruptly closed for an extended period of time. Second was that many or most schools when reopened
were mostly or all remote learning.
Collection of data was severely impacted by the closures. Collection windows had to be extended for
some survey items in order to account for the logistical challenges of operating during the pandemic. In
some schools, records that were needed to report accurately were inaccessible, others where in-person
data collection was needed could not be done, and collection had to be halted and the window
compressed to match the time span of collection that had actually been completed.
Data that were obtained will require substantial caveating to provide proper context to users. For
example, data on discipline incidents and reports of bullying at school will likely be much lower because
kids are less likely to be disciplined in a remote learning environment than in a physical school setting.
At-school bullying cannot occur if kids are not at school, but there may be an uptick in the reporting of
cyber bullying.
Going forward, there will be carry-on impacts on population frames. Gathering representative samples
in situations where schools or even entire states are unable to respond will be a serious challenge. At
the same time as population data gathering is inhibited, there might be a large change in the population
data, such as shifts of students to private schools and/or to distance learning. These kinds of shift will
almost certainly not be at random, as families of poor students are less able to make these changes than
higher socio-economic status families. And since socio-economic status is strongly correlated with
race/ethnicity, these shifts will be disproportionate by race/ethnicity, too.
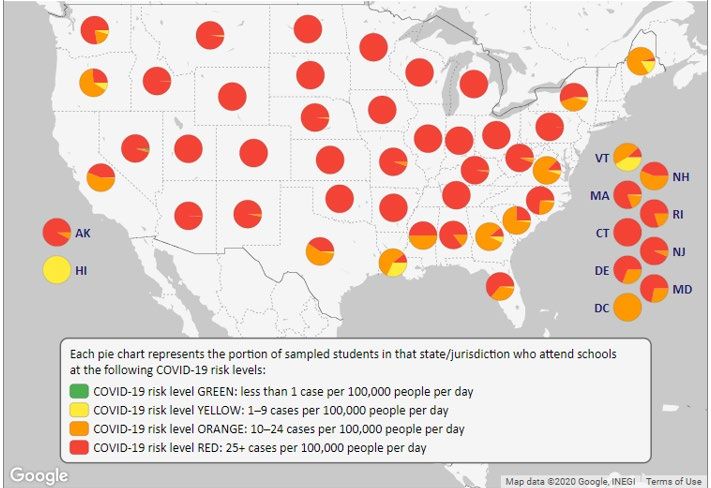
Current COVID-19 Risk Levels and
Impacts on the 2021 National Assessment of Education Progress (NAEP) Sample
Note. 2021 NAEP Grade 4 sampled students are shown; Grade 8 is similar. COVID-19 risk level framework from “Harvard
Global Health Institute Key Metrics for COVID Suppression.”
Source. National Center for Education Statistics, NAEP 2021 data collected from sampled schools, November 17, 2020.
Chart available at: https://nces.ed.gov/whatsnew/commissioner/remarks2020/11_25_2020.asp.
22Methodology Spotlight: Bureau of Labor Statistics (BLS)
Changes in Telework and Stability Assumptions
Changes at BLS because of the pandemic were driven by two factors. One was the need to create
processes and systems for 100 percent telework for surveys that handle embargoed data. Second was
the need to change stability assumptions for employment measures following the state-mandated
lockdowns.
BLS had expanded its telework capabilities for many years, but it had not performed the production of a
Principal Federal Economic Indicator (PFEI) entirely remotely. By good fortune, a pilot test for producing
PFEI statistics remotely was undertaken in January of 2020, in anticipation of inclement weather and
expanded telework. Beginning in March, this pilot became the standard operating posture with the
move to telework.
The unparalleled decline in employment between March and April 2020 required BLS to examine and
revise some of the stability assumptions about employment, hours, and earnings. In the Current
Employment Statistics (CES) program, the assumption that the overwhelming majority of employment
change due to business openings and closures is largely offsetting, with a small predictable residual, had
to be removed from the estimation process. This required revising other methodologies impacted by
relaxing that assumption, as well as the adaptation and construction of new systems to implement the
changes.
The swiftness of the decline, and the timing of its bulk occurring in between monthly estimation of
employment numbers, also required altering the methodology used to produce quarterly productivity
estimates. CES reports once a month for the pay period that includes the twelfth, while productivity is
calculated on a quarterly schedule. Normally, the employment level input into productivity is held
constant from the last CES report to the end of the quarter under usual stability assumptions. To capture
the impact of the shutdown on the last weeks of March, BLS requested and was provided initial
unemployment insurance claims records from state offices, which were blended with regularly collected
data to calculate estimates of weekly decline between the week of March 12 and April 1. These and
related data were shared with the Bureau of Economic Analysis and the Federal Reserve Board, as the
agencies worked together to ensure consistent economic statistics.
Labor Productivity (Output Per Hour), Output, and Hours Worked Indexes,
Nonfarm Business (2012 = 100), 2020Q3
Source. U.S. Bureau of Labor Statistics. Chart available at: https://www.bls.gov/charts/productivity-and-costs/nonfarm-
business-sector-indexes.htm.
23Methodology Spotlight: National Center for Health Statistics (NCHS)
Timely, Pandemic-Related Statistics
Changes at NCHS because of the pandemic were driven by two factors. One was the need for new
pandemic-related statistics. Second was the need for data to be released on a rapid, nearly flow basis.
NCHS repurposed the existing Research and Development Survey (RANDS) to collect COVID-19 health
information and release some experimental estimates. This survey’s enrolled panel began answering
questions specific to the pandemic, such as telehealth use, quarantine behavior, and loss of work due to
illness. Additionally, NCHS collaborated with the Census Bureau to add COVID-19 related questions to
the new Pulse surveys, as well as worked with them to move the National Health Interview Survey
(NHIS) to a phone-based interview system. The conversion to phone-based interviews allowed NHIS data
collection to continue despite lockdown restrictions.
NCHS dramatically accelerated the input of death counts in the National Vital Statistics system. NCHS
began accepting and publishing preliminary reports from states on a daily basis. NCHS was able to
accelerate the release process so that nearly all mortality data were reported with no more than a two-
week lag.
Telemedicine Access by Age Group:
Telemedicine Access Varied by Age Group Before the Pandemic and in the Last Two Months
Source. National Center for Health Statistics, Research and Development Survey (RANDS) During COVID-19, 2020. Chart
available at: https://www.cdc.gov/nchs/data/covid19/RANDS-COVID-19-webinar-slides.pdf.
24Section C. Product Innovations
Summary
This section presents information on products that ICSP agencies have created or significantly modified
in response to the outbreak, including identifying lessons learned that can be used to enable future
innovations in statistical processes, procedures, and products; categorizing the types of new products
and services that were developed; cataloging the characteristics of the innovations and the
organizational changes required to produce them; and spotlighting specific examples.
Key Takeaways
Crisis is an opportunity. The pandemic has presented statistical agencies with unparalleled circumstances
through which to develop new products and services in a rapid-fire environment with accelerated
feedback loops. Statistical agencies have embraced this opportunity to innovate in ways that meet the
emerging needs of the American public. In general, new products and services have addressed two main
categories of needs—(1) the need for more timely and detailed data to analyze the pandemic’s effects
on different geographies, sectors, groups, or types of activities and (2) the need for new mechanisms for
collecting, processing, and reporting information related to pandemic response and for monitoring
agency operations. These innovations underscore a shift in priorities between timeliness and accuracy.
Especially when confronted with rapidly changing conditions, like those presented by the COVID-19
crisis, decision-makers often value prototype or experimental estimates today over more precise
statistics tomorrow. ICSP agencies are planning to continue most of their innovations related to the
pandemic, some indefinitely and others for an uncertain or limited amount of time. In addition, the data
systems, analytical tools, technologies, and partnerships harnessed in response to COVID-19 lay a strong
foundation for future innovations.
Communication impacts everything. The effectiveness of U.S. statistical agencies hinges on public trust
in the government’s datasets. The uncertainties of the pandemic have only heightened the need for
timely, transparent communication around these statistical offerings. ICSP agencies are addressing these
concerns by (1) tapping new sources of information, like new surveys, additional survey questions, and
“big” datasets, to report on the impacts of the pandemic; (2) harnessing technology and data tools, such
as machine learning, artificial intelligence, and passive data collection, to gather, process, and push out
more data, faster; and (3) leveraging a wide range of communications mechanisms, for example,
dedicated webpages, research papers, and briefings, to reach diverse audiences. Communication is a
critical ingredient to success through every part of the innovation process, as statistical agencies identify
problems, evaluate and implement solutions, build staff buy-in, roll out new products and services, and
gather feedback from stakeholders.
Get creative with resources. Statistical agencies are casting a wide net for pulling in the resources they
need to deliver timely, relevant, and high-quality products and services. For example, to build up the
staff time and expertise necessary for developing innovations in response to the pandemic, ICSP
agencies added personnel through employee details, new hires, and contracts; empowered leaders to
establish new working groups; and collaborated with other agencies and private-sector organizations. In
addition, agencies leveraged myriad new data sources and applications, including timelier snapshots of
existing datasets, new information from administrative and private sources, and new surveys and
25questions. Agencies supported these personnel, partnerships, and data resources with new and
expanded IT tools, such as cutting-edge platforms for virtual meetings, additional user licenses, new
hardware and mobile devices, and expanded server space. Many of the recent statistical and
technological innovations would not have been possible without existing relationships with colleagues
throughout government and the private sector and prior investments in IT systems and data science
tools.
Survey Response Overview
About 80 percent of respondents (14 out of 17) indicated that they developed product innovations
related to COVID-19. The innovations fell into two main groups:
• The top tier with 8–11 responses includes: webpages devoted to the pandemic, new output like
tables and graphs, research papers, and new questions added to existing surveys.
• The bottom tier with 4 or 5 responses includes: adapted estimation methods, new sources other
than surveys, new surveys, increased publication frequency, and “other” new or enhanced
products or services, like using new technologies to answer questions related to COVID-19 and
expanding the number of explanatory materials included with statistical releases.
Survey Response Details
This section provides information on the 28 specific innovations described by the survey respondents.
Table C1 looks at four new products or tools to give a flavor of the responses. Table C2 summarizes the
characteristics of all the reported innovations. Finally, three “Innovation Spotlights” call out new,
publicly available products—the Census Bureau Household Pulse Survey, Bureau of Economic Analysis
(BEA) near real-time consumer spending statistics, and Economic Research Service (ERS) COVID-19
online resources—to show how all of these considerations come together. These spotlights include
lessons learned around the themes of the power of partnerships, the promise of big data, and the
possibilities of new presentations.
26You can also read


