STATISTICAL QUARTLY UPDATE 3Q2020 ECSECC - PERFORMANCE AND DEVELOPMENTS OF SMMEs IN THE EASTERN CAPE
←
→
Page content transcription
If your browser does not render page correctly, please read the page content below
PERFORMANCE AND
  DEVELOPMENTS OF SMMEs
    IN THE EASTERN CAPE

STATISTICAL QUARTLY UPDATE
          3Q2020

         ECSECC
       January 2021

          Dr Kambale Kavese
Contents
1. Introduction, background, objective, definition and selected key findings
1.1 Background
1.2. Definition of SMMEs, objective and structure of the report
1.2.1. Definition
1.2.2. Objective of the report
1.3. Summary of findings
1.4. Methodology and proxy used to derive the number of SMMEs in the Eastern Cap
1.4.1. Methodological approach
1.4.2. Analytical Approach
1.5 Global SMMEs outlook
1.6 SMMEs legislative tools in South Africa
1.7 Shortcoming of the study and future research area
2. Statistical profile of SMMEs in the Eastern Cape
2.1 Performance and trends of SMMEs in the province
2.2 Number of SMMEs operating in the formal and informal sectors
2.3 Provincial distribution of SMMEs
2.4 Economic sectors in which SMMEs function
2.4.1. Sectoral dynamics of SMMEs
2.4.2. SMME activities
2.5 Digitalisation and the Level of education attained by SMME owners
2.5.1 The level of education attained by SMME owners.
2.5.2 Skill levels of SMME owners.
2.5.3 Digitalisation has become a key game changer in the SMMEs sector
2.6 Occupation of SMMEs owners
2.7 Spatial distribution of SMMEs
2.7.1 SMMEs distribution between urban and non-urban areas
2.7.2 The apartheid legacy
2.7.3 SMMEs distribution between Metros and Non-Metro areas
2.8 Demographic distribution of SMMEs in the Eastern Cape
2.8.1 SMMEs ownership by population group
2.8.2 SMMEs ownership by gender
2.8.3 SMMEs owned by young people in the province.
2.9 Number of SMME owners by marital status
2.10 SMMEs by type of enterprises
2.11 Number of SMMEs registered for Value-Added Tax (VAT)
2.12 Number of SMMEs registered for income tax
3. Conclusion
AnnexureList of Tables Table 1. Summary of selected key SMMEs indicators Table 2. QLFS-Proxy to estimate the number of SMMEs in the Eastern Cape Table 3. The majority of SMMEs in the Eastern Cape (70%) operate in the informal sector. Table 4. More than half of SMMEs in the country operate in Gauteng and KwaZulu-Natal. Table 5. Most SMME owners operate in Trade (39%) and in Construction (19%) industries Table 6. SMME owners by level of education Table 7. The majority of SMMEs in the Eastern Cape are owned by semi-skilled entrepreneurs. Table 8. Half of SMMEs in the province are owned semi-skilled entrepreneurs. Table 9. Industry by occupation matrix of SMME owners in the Eastern Cape: 3Q2020 Table 10. Spatial distribution of SMMEs Table 11. SMMEs distribution between Metros and Non-Metro areas Table 12. In the Eastern Cape, 77% of SMMEs are owned by Black/Africans (75% for RSA) Table 13. More female entrepreneurs in the BCM Table 14. Number of SMME owners by marital status Table 15. SMMEs by type of enterprises Table 16. SMMEs registered for VAT Table 17. SMMEs registered for income tax List of Figures Figure 1. The Eastern Cape is the poorest province in the country in terms of GDP per capita. Figure 2. The Eastern Cape has the highest youth unemployment rate in the country. Figure 3. SMMEs in the Eastern Cape: performance and trends Figure 4. There are 2.4 million SMMEs in South Africa (3Q2020). Figure 5. Spatial distribution of SMMEs Figure 6. Slightly more than a quarter of SMMEs in the EC are owned by youth aged 30-34 Figure 7. SMMEs registered for VAT Figure 8. SMMEs registered for income tax
PERFORMANCE AND DEVELOPMENTS OF SMMEs IN THE
                                             EASTERN CAPE
                        STATISTICAL QUARTLY UPDATE, 3Q2020

1. Introduction, Background, Objective, Definition and Selected key Findings.

This report presents a broad statistical overview of Small, Medium, and Micro Enterprises (SMMEs) in
the Eastern Cape. It uses Statistics South Africa’s data from both, the Quarterly Labour Force Survey
(QLFS, 2020), and the Quarterly Financial Statistics Survey (QFS, 2020) to develop a profile of SMMEs
in the province. The report follows a similar methodology as the Department of Trade and Industry
(dti), the Bureau of Economic Research (BER) and Small Enterprise Development Agency (seda) to
derive a proxy for the number of SMMEs. The aim of the report is to provide data to prospective
researchers and policy analysts on a wide spectrum of indicators on SMMEs. The data is presented in
the form of graphs and tables, organised according to ten selected key SMME policy questions which
the study focuses on.

The literature1 acknowledges the important role that SMMES play in sustaining economic growth and
development in developing countries (World Bank, 2020). The South African Government has
prioritised entrepreneurship and the advancement of SMMEs as a catalyst to achieving economic
growth, innovation, job creation, and development (the dti, 2019). In recognition of the importance
of the SMME sector, the government established a Ministry of Small Business Development (MSBD)
in 2014. The aim of the Ministry was to facilitate the promotion and development of small businesses.
The National Development Plan envisioned that by 2030, SMMEs will contribute 60-80% to GDP
increase, and generate 90% of the 11-million new jobs in our country. Hence, it is crucial to monitor
the performance of SMMEs. This study seeks to report on the number of jobs created by SMMEs in
the province.

1.1. Background

The diagnostic of post-apartheid socio-economic challenges2 of the Eastern Cape are presented in the
Provincial Development Plan (EC PDP) and “Vision 2030” documents (See footnote with the list of
socio-economic challenges facing the province). These challenges together with the unprecedented
adverse impact of the current health pandemic of Covid-19, and other disaster management measures
related to Covid-19 have weaken the ability of most enterprises to create jobs.

1
  World Bank (2020). Small and Medium Enterprises (SMEs) Finance: Improving SMEs’ access to finance and finding
innovative solutions to unlock sources of capital. https://www.worldbank.org/en/topic/smefinance

2 The challenges mentioned in  the EC PDP together with other contemporaneous issues are: (1) Weak growth prospects, and
low real investment; (2) Fiscal austerity measures (weak fiscal stance could lead to sovereign debt crisis), shrinking
government revenue and rising government expenditure; (3) Uncertainty about the impending upsurge of Covid19 – how
long the pandemic will last, its imminent adverse effects of the economy; (4) Skills shortage, high illiteracy rate, and poor
education system, especially in deprived & marginalised communities; (5) Deteriorating health system – especially in the
poor rural communities; (6) Ever-escalating crime rate and social unrest, which can undermine investment prospects and
business development; (7) Corruption and fruitless expenditure that weaken service delivery and the fiscal stance which is
already under stress; (8) High poverty rate and persisting inequality between the rich and the poor; and (9) Continued rise
of unemployment rate – especially among the young people
An OECD (2019) report suggests that in situations where big enterprises are shedding jobs, SMMEs,
through their ability to act as absorbers of excess labour, must be strengthen so that they employ
workers who were laid off. This would make a meaningful contribution to slowing down the growing
unemployment rate that has largely been caused by the big business shedding jobs. In other words,
with the reduced employment opportunities in big business, SMMEs can become an important source
of new jobs. In a rural province, like the Eastern Cape, their role is even more significant because they
are the only viable form of business due to the small markets in rural towns and villages.
Why SMMEs promotion and development are considered important in the Eastern Cape? Two main
reasons. Firstly, the province has the highest youth unemployment rate in the country. Secondly, the
Eastern Cape is the poorest province in the country in terms of GDP per capita. (See Figures 1 and 2).
Figure 1. The Eastern Cape is the poorest province in the country in terms of GDP per capita.
130 GDP PER CAPITA (R’000) 121
2017 2019
101
100
85 86 87
74 76
70
70 65
54
40
10
EC LMP KZN NW NC MPL RSA FS WC GT
-20
Source: Statistics South Africa
Figure 2. The Eastern Cape has the highest youth unemployment rate in the country.
60%
50%
40%
Percentage
30%
20%
10%
0%
EC FS GT RSA LMP MPL NC KZN NC WC
3Q2015 39% 43% 40% 36% 28% 37% 34% 30% 46% 30%
2Q2020 53% 35% 37% 34% 33% 18% 32% 29% 41% 26%
3Q2020 60% 47% 46% 43% 41% 40% 39% 38% 33% 32%
Source: Statistics South AfricaRationale for SMME promotion and the economic role of the SMME sector : The Ministry of Small Business Development (MSBD) acknowledges three important reasons why SMMEs are considered crucial for development. • SMMEs are seedbeds for entrepreneurship development, innovation and risk-taking behaviour, and provide the foundation for long-term growth dynamics and the transition towards larger enterprises. In this context, the predominant role of youth entrepreneurs is of particular importance. • SMMEs are crucial to the transition from Agro-led to industrial economies as they provide simple opportunities for processing activities that can generate sustainable livelihoods. • SMMEs support the building up of systemic productive capacities. They help to absorb productive resources at all levels of the economy and contribute to the creation of resilient economic systems in which small and large firms are interlinked. 1.2. Definition of SMMEs, objective and structure of the report 1.2.1 Definition In South Africa, the National Small Business Act, 1996 defines a small business as: a separate distinct business entity, including cooperative enterprises and non-governmental organisations, managed by one owner or more, and which can be classified3 as a micro, very small, a small or medium enterprise by satisfying the criteria mentioned in the Act. The heterogeneity of the SMME population across the province, the diversity of their business ecosystems and the pressing challenges ahead call for a fundamental rethinking of SMMEs. SMME policies require more and better data, as well as stronger evidence on policy synergies, complementarities, and trade-offs. Hence, this report makes a first step by developing a database for tracking development of small businesses in the province. 1.2.2 Objective of the report The main objective of this report is to provide data that could be used to respond to the following ten key SMMEs policy questions, namely: 1. How many SMMEs operate in South Africa and in the province? 3 The National Small Business Act 102 of 1996 is the framework that is most used in South Africa. The definition outlined in the Act uses the number of employees (the most common mode of definition); annual turnover; and the gross assets excluding fixed property to classify enterprises. The definitions for the various enterprise categories are given as follows: • Survivalist enterprise: the income generated is less than the minimum income standard or the poverty line. This category is considered pre-entrepreneurial, and includes hawkers, vendors and subsistence farmers. • Micro enterprise: The turnover is less than the VAT registration limit (that is, R150 000 per year). These enterprises usually lack formality in terms of registration. They include, for example, spaza shops, minibus taxis and household industries. They employ no more than 5 people. • Very small enterprise: these are enterprises employing fewer than 10 paid employees, except mining, electricity, manufacturing and construction sectors, in which the figure is 20 employees. These enterprises operate in the formal market and have access to technology. • Small enterprises: The upper limit is 50 employees. Small enterprises are generally more established than very small enterprises and exhibit more complex business practices. • Medium enterprises: the maximum number of employees is 100, or 200 for the mining, electricity, manufacturing and construction sectors. These enterprises are often characterized by the decentralization of power to an additional management layer.
2. How many SMMEs operate in the formal sector vs informal sector?
3. Where do these SMMEs operate? i.e., in terms of Urban areas, Non-Urban areas, Metros, Non-
     Metros; and provincial distribution.
4. Who owns these SMMES? i.e., in terms of Gender, and Population Group, and Age (Youth
     Owned SMMEs vs Adult Owned SMMEs).
5. What is the marital status of SMME owners? The status of SMME owner can affect the
     performance of SMMEs.
6. How educated are SMMEs owners; and how many are functionally literate or illiterate?
7. What occupation category SMME owners fall under; and what level of skills they have?
8. In which economic sectors do they function?
9. How many SMMEs in the province are registered for VAT?
10. How many SMMEs in the province are registered for income tax?
The report is structured according to the ten policy questions identified above. Each policy question
is addressed in a section.

1.3. Summary of findings

During the third quarter of 2020, SMMEs in the Eastern Cape contributed 19% to total employment
in the province. A statistical summary of selected key SMMEs indicators is provided in Table 1 below.

Table 1 Summary of selected key SMMEs indicators
                  SMMEs indicators                              Findings (Eastern Cape, third quarter 2020)
 1     Number of SMMES in the RSA and in          In the third quarter of 2020, there were 2.4 million SMMEs in South Africa of
       the Eastern Cape                           which 231 011 SMMEs (9.8%) were in the Eastern Cape
 2     SMMEs in Formal and informal sectors       51 047 SMMEs (22%) operate in the formal sector; 160 861 SMMEs (70%) in
                                                  the informal sector; and 19 104 SMMEs (8%) in other sectors
 3     SMMEs in Urban and non-urban areas         135 940 SMMEs (59%) operate in Urban areas; and 95 072 SMMEs (41%) in
                                                  non-urban areas
 4     SMME owners by Gender                      141 616 SMMEs (61%) are owned by Males; and 89 396 SMMEs (39%) are
                                                  owned by Females
 5     SMME owners by Education and literacy 49% of SMME owners have “Secondary not completed”; 92% are functional
       level                                      literate and 8% are functional illiterate
 6     SMME owners by Marital status              47% of SMMEs are owned by married people; 42% by those not married; 2%
                                                  by divorced; 5% by widows/widowers; and 4% by those in cohabitation
 7     SMME owner by occupation                   28% of SMME owners operate in the occupation of “trade worker” and 27% in
                                                  the “elementary occupation”
 8     SMME owners by age                         Youth owned SMMEs accounts for 36%, and Adult for 64%. The majority of
                                                  SMMEs (60 841 or 26%) are owned by people in the age group (30-34)
 9     SMMEs owner by skill levels                50% (half) of SMMEs are owned by Semi-skilled entrepreneurs.
                                                  Skilled (23%) and low-skilled (27%) account for the other half.
 10 SMME owners by population group               77% of SMMEs are owned by Africans; 10% by White; 9% by Indian; and 4% by
                                                  Coloured.
 11 SMMEs by province                             SMMEs are unevenly distributed across the nine provinces: GT 33%; KZN 17%;
                                                  WC 11%; LMP 10%; EC 10%; MPL 9%; FS 5%; NW 3%; NC 1%
 12 SMMEs by Metros and Non- Metros               The majority of SMMEs in the province operate in non-metro areas (62%).
                                                  Only 20% of SMMEs operate in the BCM and 18% in NMBM
 13 SMMEs by Industry                             39% of SMME owners operate in Trade sector; 19% in Construction; 16% in
                                                  Community services; 7% in Agriculture; 7% in Finance; 6% in Manufacturing;
                                                  and 5% in Transport
 15 SMMEs by type of Enterprises                  For every 10 SMMEs in the province, 9 are private enterprises. Few are NGO,
                                                  public enterprises, or government-controlled entities
 16 SMMEs registered for VAT                      For every 10 SMMEs in the province, 8 are not registered for VAT
 17 SMMEs registered for income tax               For every 10 SMMEs in the province, 7 are not registered for income tax
Source: Own calculations derived from Stats SA’s Quarterly Labour Force Survey (QLFS, 2020)
1.4. Methodology and proxy used to derive the number of SMMEs in the Eastern Cape.
1.4.1 Methodological approach
Statistics South Africa’s Integrated Business Register (SAIBR) contains information on businesses in the
country. For confidentiality reasons, the information is not open to the public, which makes it difficult
to compile a profile of businesses, including SMMEs. To overcome this challenge, the DTI conducted a
study that sought to assess the number of SMMEs in the country. The results of their study revealed
that in 2007, there were 2 260 096 SMMEs in South Africa. Subsequently, the BER used the QLFS-Proxy
to estimate the number of SMMEs. BER’s methodology consisted of combining the number of
“employers” and the number of “own account workers” as a proxy for SMMEs. The BER results showed
that in 2007, there were 2 182 823 SMMEs in South Africa.
The comparison of the two results (between the DTI and BER) differs only by 3%. Therefore, we can
deduct that the QLFS-Proxy is a relative accurate estimate of the number of SMMES. Since the QLFS-
Proxy is closer to the official number, SEDA has adopted this methodology to compile its Quarterly
SMMEs Statistical Update (SEDA, 2019).
There is no need to re-invent the wheel. This report uses the same methodology of QLFS-Proxy to
estimate the number of SMMEs in the Eastern Cape. The report draws heavily from both the BER and
SEDA’s “SMMEs Quarterly Update” documents in terms of the structure, approach, and statistical
analysis (SEDA, 2019).
Table 2. QLFS-Proxy to estimate the number of SMMEs in the Eastern Cape
Number of SMMES Distribution Number of SMMES Distribution Growth rate (%)
3Q2008 - 3Q2015 -
3Q2008 3Q2015 3Q2015 (%) 2Q2020 3Q2020 3Q2020 (%)
3Q2015 2Q2020
Total 1 320 625 1 387 457 100% 1 183 538 1 222 913 100% 5% -12%
Working for someone else for pay 1 089 167 1 187 949 85.6% 927 797 982 629 80.4% 9% -17%
Helping without pay in a household business 13 614 4 973 0.4% 7 931 9 272 0.8% -63% 86%
Sub-total (employed) 1 102 781 1 192 922 86.0% 935 728 991 902 81.1% 8% -17%
Employer (employing one or more employees) 77 376 68 044 4.9% 98 232 73 342 6.0% -12% 8%
Own account worker (not employing any employees) 140 467 126 492 9.1% 149 578 157 669 12.9% -10% 25%
SMMEs 217 843 194 535 14.0% 247 810 231 011 18.9% -11% 19%
Source: Statistics South Africa, Own calculations derived from the QLFS (2020)
Table 2 shows that in 3Q2020, there were 1 222 913 people employed in the Eastern Cape. Of the 1.2
million people, 73 342 people (6.0%) employed others, while 157 669 people (12.9%) worked for
themselves. Combined at 231 011 (18.9%), this comprises the proxy measure for the number of
SMMEs in the Eastern Cape.
1.4.2 Analytical Approach
Employment in the SMMEs sector has increased dramatically. Two important findings emerge from
Table 2. Firstly, the SMMEs’ contribution to total employment in the province has improved from
14.0% in 3Q2015 to 18.9% in 3Q2020. Secondly, the number of SMMEs in the province increased by
19% from 194 535 in 3Q2015 to 231 011 in 3Q2020. However, the number of employed people
(working for someone else for pay or those helping without pay) dropped by 17% from 1 192 922 in
3Q2015 to 991 902 in 3Q2020. The overall employment in the province declined by 12% from 1.38million in 3Q2015 to 1.22 million in 3Q2020. The decline in total employment in 3Q2020 was mainly attributed to the global economic stagnation and the global health pandemic of Covid-19 that led to job shedding in most economic sectors. As such, the SMME option has become the natural alternative for people struggling to find a job (SEDA, 2019). According to ECSECC (2020), the QLFS highlights important facts. It shows that the Eastern Cape has a low share of employers and self-employed people in the labour force, and a relatively low share of working age adults in employment. That is a major factor behind high joblessness and the associated inequality and economic exclusion. 1.5 Global SMMEs outlook According to the World Bank4 (2020), SMEs account for the majority of businesses worldwide and are important contributors to job creation and global economic development. They represent about 90% of businesses and more than 50% of employment worldwide. Formal SMEs contribute up to 40% of national income (GDP) in emerging economies. These numbers are significantly higher when informal SMEs are included. According to our estimates, 600 million jobs will be needed by 2030 to absorb the growing global workforce, which makes SME development a high priority for many governments around the world. In emerging markets, most formal jobs are generated by SMEs, which create 7 out of 10 jobs. However, access to finance is a key constraint to SME growth, it is the second most cited obstacle facing SMEs to grow their businesses in emerging markets and developing countries. 1.6 SMMEs legislative tools in South Africa The National Development Plan suggests that small business can open new opportunities to create jobs, equality and innovation as well as be a route to economic empowerment. According to the dti (2017), small business provides 55% of formal employment, compared to 40% from large companies (the other 5% of workers do not know the size of their employer). Various legislative tools have been enacted to create and foster a conducive business environment. These are: • The Business Act of 1991, • National Small Enterprise Act of 1996, • Skills Development Act of 1998, • Public Finance Management Act of 1999, • the Preferential Procurement Policy Framework Act of 2000, • Broad-Based Black Economic Empowerment Act of 2003, • Cooperatives Development Act of 2005, • Companies Act of 2008 and Industrial Development Corporation Act of 1940 • The National Small Enterprise Amendment Bill 2020, gazetted recently, outlines the establishment of an Ombud service that will provide legal support to SMMEs. According to the DSBD, the creation of this environment is done through regulating the licensing and operation of businesses, establishment of councils and agencies of government that provide guidelines on promotion of businesses by state organs, develop skills of the country’s workforce and promote self-employment, and the development of SMMEs through facilitation of access to finance. 4 World Bank (2020) Small and Medium Enterprises (SMEs) Finance: Improving SMEs’ access to finance and finding innovative solutions to unlock sources of capital. https://www.worldbank.org/en/topic/smefinance
Despite these legislative tools, the province is still lacking behind in terms of attaining macro-economic
objectives. This could imply the need to re-examine South Africa’s SMME policy framework, to assess
current SMME institutions, and to re-evaluate SMME policy instruments.

1.7 Shortcoming of the study and future research area

Due to the limitation of the proxy used to derive the number of SMMEs in the country (province), the
data provided in this report should be interpreted with care. Also, the quarterly date can be misleading
due seasonality effects. The use of annual data5 from Stats SA’s Labour Market Dynamics (LMD) can
provide a different and better picture.

The following topics fall outside the scope of this study, and further useful research would involve
around:

1. How SMMEs in the Eastern Cape are affected by Covid-19?
2. Can rural SMMEs have meaningful impacts on the economy during this contemporaneous
   dispensation of digitalisation, high technology and the fourth industrial revolution?
3. Review of diagnostics of challenges currently facing the Eastern Cape SMMEs and what strategy
   to implement, or policy recommendations
4. What is the sectoral contribution of SMMEs on GDP, fiscus, and employment? How SMMEs affect
   other macroeconomic objectives in the province?
5. How SMMEs in the tourism sector, energy sector, environmental sector, ocean economy sector,
   art & culture (creative industry), township economy and digital economy sector are performing in
    the province?
6. Survey of SMMEs areas of involvement such as: Tuck shop, art and craft, traditional health service,
   education, shebeen, house shop, liquor sale, entertainment service, grocery retail (Spaza),
   religious services, tailor, tavern, mechanical services, transport services, meat & poultry & fish
   retail, subsistence farming, hair care, takeaways, shoe repair, community services, car wash,
   phone shops, appliance repairs, restaurants and vendors.

From the above shortcomings, this study does not claim to bring solution to the SMMEs sector but
rather it aims to contribute to the building of the bigger picture. Without such information, it is difficult
to develop a SMME strategy for the province.

2. Statistical profile of SMMEs in the Eastern Cape

To attain heterogeneity and reach the objectives set in this study, this subsection will provide data
and a very brief discussion on various SMMEs indicators. The section will focus on trends and number
of SMMEs in the province; employment provided by SMMEs; SMMEs in formal and informal sectors;
SMME owners by age, gender, marital status, race, education attained; Spatial distribution of SMMEs

5
  The LMD is an annual consolidation of Statistics South Africa’s Quarterly Labour Force Survey (QLFS), a
household survey with 60 000 respondents. These are significant samples, but they become less reliable if
divided on too many dimensions. The change in weighting in 2015 saw a significant jump in overall employment
and in the number of employers and self-employed people.
across the nine provinces, in urban and non-urban, in metros and non-metros; SMMEs matrix of
industry and occupation, SMMEs by skill & occupation, and SMMEs registered for VAT and for Tax.
2.1 Performance and trends of SMMEs in the province
As shown in figure 3, from the global economic meltdown in 2008 to the most recent recession in
2019, trends of SMMEs in the Eastern Cape have displayed a light parabola shape. The number of
SMMEs peaked in 4Q2008 to 255 742. Due to the 2008 financial crisis, the figure dropped, reaching
the bottom of 151 741 in 4Q2014 and thereafter start recovering, reaching a second peak of 247 810
in 2Q2020 (See Figure 1). In the third quarter of 2020, there were 2.4 million SMMEs in South Africa
of which 231 011 SMMEs (9.8%) were in the Eastern Cape.
Figure 3. SMMEs in the Eastern Cape: performance and trends
280 000
260 000
240 000
220 000
200 000
180 000
160 000
140 000
120 000
100 000
Source: Statistics South Africa (2020)
The current SMMEs trend is likely to be affected by the health pandemic of Covid-19. Preliminary
results from Stats SA (2020) and FinFind6 (2020) surveys on the impact of Covid19 on businesses have
concluded that most SMMEs in the country were unable to operate during the lockdown period.
6
https://www.vutivibusiness.co.za/small-business/report-paints-gloomy-picture-for-smmes/
A survey conducted by FinFind (2020) confirms that small businesses are still knee-deep in debt following the Covid-19
outbreak, and many have had to shut their doors. According to the report, 60% of SMMEs were unable to operate during the
lockdown, while 42.7% were forced to close. The report by the financial institution also noted a significant decrease in revenue
in the first five months of lockdown. About 76.2% of the respondents experienced a drop in revenue, while 17.5% reported
that their revenue remained the same, and only 6.3% saw an increase. The lockdown also wreaked havoc on unemployment
levels. A total of 60% of full-time employees lost their jobs, 76.8% part-time employees were left without work, and 53.4%
casual employees were shown the door.2.2 Number of SMMEs operating in the formal and informal sectors.
The main structural characteristic of the Eastern Cape SMMEs is that the majority of SMMEs in the
province (70%) operate in the informal sector. Table 3 shows that in the third quarter of 2020, of the
231 011 SMMEs in the province, the share of SMMEs operating in the informal (non-agricultural)
sector stood at 69.6%, while the share of SMMEs operating in the formal (non-agricultural) sector was
only 22.1%. A minority of SMMEs operate in Agriculture (6.7%) and private households (1.6%).
According to SEDA (2019), rural provinces tend to have more informal SMMEs, due to their high
number of hawkers and informal traders. SEDA’s report reveals that the majority of SMMEs operating
in formal sector are in urban provinces, mainly in Gauteng (46%).
Table 3. The majority of SMMEs in the Eastern Cape (70%) operate in the informal sector.
Own Own
Total Distribution Employer
Employer account account
SMMEs (SMMEs %) ratio
worker worker ratio
Formal Sector (non-agricultural) 39 245 11 802 51 047 22.1% 77% 23%
Informal Sector (non-agricultural) 19 301 141 559 160 861 69.6% 12% 88%
Sub total (Formal + Informal) 58 546 153 361 211 908 91.7% 28% 72%
Agriculture 13 671 1 775 15 446 6.7% 89% 11%
Private households 1 125 2 533 3 658 1.6% 31% 69%
Eastern Cape: Total SMMEs 73 342 157 669 231 011 100% 32% 68%
Source: Statistics South Africa, Own calculations derived from the QLFS (2020)
SMME owners in the formal sector also employ other people. For every 100 SMMEs owners in the
formal sector, 77 are employers and 23 are own account workers. The opposite is true in the informal
sector. The majority of SMME owners in the informal sector are own account workers. For every 100
SMME owners in the informal sector, 12 are employers and 88 are own account workers. Overall, of
all 231 011 SMME owners in the Eastern Cape, 32% are employers and 68% are own account workers.
Looking at employment by SMMEs, it is important to note that while small formal businesses in the
province makes a significant contribution to employment, small businesses as a whole remains
underdeveloped by international standards. In the Eastern Cape, only 18.9% (See Table 2) of all
employed people are self-employed or employers. In contrast, the norm for upper middle-income
economies, excluding China, is around 40%. The evidence suggests that the lower the share of self-
employment, the lower the level of employment overall, measured in the ratio of employment to
working age population. Only 40% of South African adults have income-generating work, compared
to almost 60% in other upper-middle-income economies excluding China (the dti, 2017).
2.3 Provincial distribution of SMMEs
According to the IMF (2018), countries with a high share of SMMEs have succeeded in making income
distribution more equitably. This in turn is a key contribution to ensuring social stability by reducing
economic disparities between rural and urban areas.
In this subsection, we provide a distribution of SMMEs between the nine provinces of South Africa for
three distinctive quarters, 3Q2008, 3Q2015 and 3Q2020. We also show percentage changes in SMMEs
between 3Q2008 and 3Q2020. Results are presented in Table 4 and in Figure 4 below.These results shows that the spatial distribution of small business has continued to mirror patterns
set up under apartheid7, with most clustered around economic centres. In 3Q2020, Gauteng,
KwaZulu-Natal and Western Cape accounted for 62% of all SMMEs in the country.
Table 4. More than half of SMMEs in the country operate in Gauteng and KwaZulu-Natal.
Number of SMME Owners Growth rate (%) Distribution (%)
Provinces
3Q2008 3Q2015 3Q2020 3Q2008-3Q2020 3Q2008 3Q2015 3Q2020
1: Western Cape 213 210 242 869 268 799 26.1% 9.7% 10.8% 11.4%
2: Eastern Cape 217 843 194 535 231 011 6.0% 9.9% 8.6% 9.8%
3: Northern Cape 26 902 16 067 18 519 -31.2% 1.2% 0.7% 0.8%
4: Free State 108 245 106 582 110 183 1.8% 4.9% 4.7% 4.7%
5: KwaZulu-Natal 428 298 375 258 414 071 -3.3% 19.5% 16.7% 17.5%
6: North West 94 903 97 974 79 203 -16.5% 4.3% 4.4% 3.4%
7: Gauteng 717 907 793 099 783 410 9.1% 32.6% 35.2% 33.1%
8: Mpumalanga 195 174 162 543 214 393 9.8% 8.9% 7.2% 9.1%
9: Limpopo 196 998 263 070 243 924 23.8% 9.0% 11.7% 10.3%
Total (RSA) 2 199 480 2 251 997 2 363 513 7.5% 100% 100% 100%
Source: Statistics South Africa, Own calculations derived from the QLFS (2020)
There are however other scholars who argue that despite the significant contribution made by the
SMME sector, only a small segment really has the potential to contribute to economic growth. Also, a
number of SMMEs are inactive or dormant. So, the number of SMMEs recorded in the province can
be a misleading figure. Therefore, a study on the contribution of SMMEs to development is needed.
Figure 4. There are 2.4 million SMMEs in South Africa (3Q2020).
800 000
600 000
400 000
200 000
-
KwaZulu- Western Eastern Free North Northern
Gauteng Limpopo Mpumala
Natal Cape Cape State West Cape
nga
SMMEs 783 410 414 071 268 799 243 924 231 011 214 393 110 183 79 203 18 519
Source: Statistics South Africa (2020)
7
The provincial distribution of formal and informal enterprise mainly reflected the legacies of apartheid. For
every thousand working-aged people in the former “homeland” areas, there were 43 informal businesses and
only four formal ones. In contrast, in the rest of the country, for every thousand inhabitants there were 26 formal
and 40 informal businesses (DTI, 2017)The following observations emerge from Table 4 and Figure 2.
• Over more than a decade, the number of SMMEs in South Africa increased by 7.5%, from 2.19
million in 3Q2008 to 2.36 million in 3Q2020. SMMEs in the Eastern Cape grew by 6.0%, slightly
below the average growth of 7.5% for the country as a whole.
• In 3Q2020, more than half (51.6%) of SMMEs in the country operated in Gauteng (33.1%) and
KwaZulu-Natal (17.5%).
• Despite the 6% growth in the number of SMMEs in the province, the Eastern Cape’s contribution
to total SMMEs in the country has remained relatively the same at 9.9% in 3Q2008 and 9.8% in
3Q2020.
• Among the nine provinces, the Western Cape had the highest growth rate in the number of
SMMEs (26.0%), followed by Limpopo (23.8%). The Norther Cape lost the largest portion (31.2%)
of SMMEs.
According to SEDA (2019), rural provinces tend to have more informal SMMEs, due to their high
number of hawkers and informal traders. SEDA’s report reveals that the majority of SMMEs operating
in formal sector are in urban provinces, mainly in Gauteng (46%).
2.4 Economic sectors in which SMMEs function
In section 2.2, it was indicated that the majority of SMMEs in the Eastern Cape province (70%) operate
in the informal sector. This section looks briefly at the distribution of SMMEs between the main
economic sectors. It highlights percentage changes of various economic sectors within SMMEs.
2.4.1 Sectoral dynamics of SMMEs
Table 5 shows that of the 231 011 SMMEs in the Eastern Cape, more than half of SMMEs (58%)
operate in two industries: wholesale and retail trade (90 403 or 39%) and in Construction (42 999 or
19%). More importantly, Table 5 reveals that small businesses have much less presence in the mining
and utility (electricity, water and gas supply) industries. This indicates that these industries are
dominated by a few very large players and have high barriers to entry. Eskom, for example, generates
the bulk of South Africa’s electricity supply.
Table 5. Most SMME owners operate in Trade (39%) and in Construction (19%) industries
Number of SMMEs Distribution (%)Growth rate (%)
3Q2015 3Q2020 3Q2015 3Q2020 3Q2015-3Q2020
01: Agriculture, hunting, forestry and fishing 3 279 15 446 2% 7% 371%
02: Mining and quarrying 0% 0%
03: Manufacturing 21 838 13 956 11% 6% -36%
04: Electricity, gas and water supply 0% 0%
05: Construction 27 171 42 999 14% 19% 58%
06: Wholesale and retail trade 86 901 90 403 45% 39% 4%
07: Transport, storage and communication 12 953 12 431 7% 5% -4%
08: Financial intermediation, insurance & real estate 17 881 15 365 9% 7% -14%
09: Community, social and personal services 24 091 36 753 12% 16% 53%
10: Private households 3 658 0% 2%
Total SMMEs - EC 194 535 231 011 100% 100% 19%
Source: Statistics South Africa, Own calculations derived from the QLFS (2020)The highest decline in the number of SMMEs occurred in the manufacturing sector. SMMEs in the construction sector have grown by 58% from 27 171 SMMEs in 3Q2015 to 42 999 SMMEs in 3Q2020. According to Stats SA’s Annual Financial Statistics (AFS)8 survey, small construction companies in South Africa have tripled the amount of turnover generated, from R53 billion in 2013 to R163 billion in 2019 (a rise of R110 billion). 2.4.2 SMME activities SMMEs can undertake different activities, like: Tuck shop, art and craft, traditional health service, education, shebeen, house shop, liquor sale, entertainment service, grocery retail (Spaza), religious services, tailor, tavern, mechanical services, transport services, meat & poultry & fish retail, subsistence farming, hair care, takeaways, shoe repair, community services, car wash, phone shops, appliance repairs, restaurants, vendors, etc. Unfortunately, there is no study in the province that profiles SMMEs according to these activities. 2.5 Digitalisation and the Level of education attained by SMME owners. This section is subdivided in three sub-sections. The first subsection focuses on the level of education (literacy) of SMME owners, the second section looks at the skill levels of SMMEs owners, and the third section shows how digitalisation has become a key game changer in the SMMEs sector. 2.5.1 The level of education attained by SMME owners. There are some improvements in the education level of SMME owners in the province. The number of SMME owners who are functionally literate has improved from just over 165 000 in 3Q2015 to just over 212 500 in 3Q2020. However, the number of SMME owners who are functionally illiterate has declined from just over 27 500 in 3Q2015 to just below 18 500 in 3Q2020. Table 6 shows that the majority of SMME owners (92%) are literate. Only a minority of SMME owners (8%) is functionally illiterate. 8 The Annual Financial Statistics (AFS) survey measures the financial health and performance of each industry, providing information on turnover, purchases, and capital expenditure. The report sources data from the financial statements of enterprises (i.e., private businesses and public corporations). The AFS excludes agriculture and hunting; government and educational institutions; and financial intermediation, pension funding, insurance and business services ‘not elsewhere classified. Readers can access the AFs at http://www.statssa.gov.za/?p=13900.
Table 6. SMME owners by level of education
                                            Number of SMME Owners by level of education Growth rate                         Distribution (%)
                                                                                                         1Q2020-
                                            3Q2015    3Q2019      1Q2020     2Q2020         3Q2020       2Q2020            2Q2020        3Q2020
                Functionally illiterate      27 585    41 133      28 941        29 685      18 478        3%              12%            8%
 1: No schooling                              3 335    10 205       4 643         6 762       7 113       46%               3%            3%
 2: Less than primary completed              24 251    30 927      24 298        22 923      11 365        -6%              9%            5%
                   Functionally literate    165 308 199 699 195 819 218 125 212 533                       11%              88%           92%
 3: Primary completed                        15 101    14 843      11 487        17 499       8 103       52%               7%            4%
 4: Secondary not completed                  79 708    91 653      99 500 108 077 112 402                  9%              44%           49%
 5: Secondary completed                      48 893    59 883      50 334        58 906      60 045       17%              24%           26%
 6: Tertiary                                 21 605    33 320      34 498        33 643      31 984        -2%             14%           14%
 7: Other                                     1 643     1 535        539              -            -        -               0%            0%
TOTAL - SMMEs in the Eastern Cape 194 535 242 367 225 298 247 810 231 011                                 10%              100%          100%
Source: Statistics South Africa, Own calculations derived from the QLFS (2020)

2.5.2 Skill levels of SMME owners.

The share of SMMEs owned by skilled entrepreneurs has declined from 26% in 3Q2015 to 23% in
3Q2020 while for the same period, the share of SMMEs owned by low-skilled entrepreneurs has
remained the same at 27%.
According to the OECD (SME and Entrepreneurship Outlook, 2019), Skills in ICT are more and more
becoming critical for SMME owners operating in a world of digitalisation, technology, and 4IR.

Table 7. The majority of SMMEs in the Eastern Cape are owned by semi-skilled entrepreneurs.
                                            South Africa                                                  Eastern Cape
                       3Q2015           1Q2020        2Q2020       3Q2020                 3Q2015        1Q2020           2Q2020        3Q2020
 Skilled                 739 614           869 326     747 404       742 008                50 850        67 745           48 643        52 516
 Semi-skilled            945 424        1 107 908     1 029 048     1 027 604               91 641       104 539          121 423       116 420
 Low skilled             566 960           636 345     643 192       593 901                52 044        53 014           77 744        62 075
 Other                         -              484        2 137               -                 -                -             -             -
 Total SMMEs 2 251 997                  2 614 063     2 421 780     2 363 513              194 535       225 298          247 810       231 011

                       3Q2015           1Q2020        2Q2020       3Q2020                 3Q2015        1Q2020           2Q2020        3Q2020
 Skilled                      33%             33%          31%              31%               26%           30%              20%           23%
 Semi-skilled                 42%             42%          42%              43%               47%           46%              49%           50%
 Low skilled                  25%             24%          27%              25%               27%           24%              31%           27%
 Other                             0%          0%           0%                   0%                0%               0%            0%            0%
 Total SMMEs                 100%            100%         100%              100%             100%          100%             100%          100%
Source: Statistics South Africa, Own calculations derived from the QLFS (2020)

2.5.3 Digitalisation has become a key game changer in the SMMEs sector.

The OECD (2019) concludes that digitalisation is a game changer in the SMME sector. SMMEs
operating in information and communication technologies (ICT) industry are particularly well placed
to reap the benefits of digitalisation. The report argues that innovation is key to boost productivity,
and digitalisation offers SMMEs new opportunities to actively take part of the global market and global
value chains. Digitalisation has created effective mechanisms to reduce size disadvantages in
international trade, such as by reducing the absolute costs associated with transport and border
operations.
SMMEs must be better prepared for the digital transition. Generally, small businesses lag in
digitalisation. The smaller the firm, the less likely they are to adopt digital-enhanced business
practices, or to face cybersecurity threats. This places them at risk of becoming weak nodes in complex
and hyper-connected infrastructure systems.
The Eastern Cape being the poorest and most rural province in the country, digitalisation in the SMMEs
sector is a real challenge for various reasons: Firstly, the cost of data is high in the country and
unaffordable by most entrepreneurs in rural areas. Secondly, there is ICT skills shortage for managing
digital transformation in rural areas. The province has still too few entrepreneurs who engage their
employees in ICT training.
2.6 Occupation of SMMEs owners
We recall from section 2.2 that the majority of SMMEs in the province (70%) operate in the informal
sector; and from section 2.4 that the majority of SMMEs (more than half of SMME owners) operate in
two industries: Trade and Construction. Such information is important in the analysis of occupation of
SMME owners.
Table 8. Half of SMMEs in the province are owned semi-skilled entrepreneurs.
Growth
Occupation 3Q2015 % Share 3Q2020 % Share rate (%)
Skilled 50 850 26% 52 516 23% 3%
01: Legislators, senior officials and managers 40 011 21% 43 013 19% 8%
02: Professionals 4 076 2% 2 180 1% -47%
03: Technical and associate professionals 6 763 3% 7 323 3% 8%
Semi-skilled 91 641 47% 116 420 50% 27%
04: Clerks 2 720 1% 2 209 1% -19%
05: Service workers and shop 34 088 18% 41 248 18% 21%
06: Skilled agricultural and fishery workers 1 484 1% 5 053 2% 240%
07: Craft and related trades workers 47 911 25% 63 554 28% 33%
08: Plant and machine operators 4 535 2% 4 356 2% -4%
Low skilled 52 044 27% 62 075 27% 19%
09: Elementary Occupation 51 622 27% 62 075 27% 20%
10: Domestic workers - 0% - 0% 0%
11: Other Occupation - 0% - 0% 0%
Total - Number of SMMEs in the EC 194 535 100% 231 011 100% 19%
Source: Statistics South Africa, Own calculations derived from the QLFS (2020)
Table 8 shows that in 3Q2020, more than half (55%) of SMME owners fell under “Craft and related
trade workers” (28%) and “elementary occupation” (27%). Table 9 cross-tabulates better the industry
by occupation matrix of SMME owners. It shows for example that of the 90 000 SMMEs operating in
Trade Industry, 51 000 SMMEs were operated by owners who fall under “elementary occupation”.Table 9. Industry by occupation matrix of SMME owners in the Eastern Cape: 3Q2020
Community Private Total
Agriculture Mining Manufacturing Electricity Construction Trade Transport Finance services households SMMEs
Skilled 9 785 - 535 - 2 210 9 151 11 225 9 290 10 320 - 52 516
01: Legislators, senior officials and managers 9 785 - 535 - 2 210 9 151 11 225 2 877 7 230 - 43 013
02: Professionals - - - - - - - 1 478 702 - 2 180
03: Technical and associate professionals - - - - - - - 4 934 2 389 - 7 323
Semi-skilled 4 627 - 13 421 - 38 844 29 840 1 206 6 075 22 407 - 116 420
04: Clerks - - - - - - - 2 209 - - 2 209
05: Service workers and shop - - 1 069 - - 14 500 - 3 866 21 814 - 41 248
06: Skilled agricultural and fishery workers 4 627 - - - - 426 - - - - 5 053
07: Craft and related trades workers - - 9 795 - 38 844 14 914 - - - - 63 554
08: Plant and machine operators - - 2 557 - - - 1 206 - 593 - 4 356
Low skilled 1 034 - - - 1 945 51 413 - - 4 026 3 658 62 075
09: Elementary Occupation 1 034 - - - 1 945 51 413 - - 4 026 3 658 62 075
10: Domestic workers 0 0 0 0 0 0 0 0 0 0 0
11: Other Occupation 0 0 0 0 0 0 0 0 0 0 0
Total - Number of SMMEs in the EC 15 446 - 13 956 - 42 999 90 403 12 431 15 365 36 753 3 658 231 011
Source: Statistics South Africa, Own calculations derived from the QLFS (2020)
2.7 Spatial distribution of SMMEs
2.7.1 SMMEs distribution between urban and non-urban areas
It has been established that in 3Q2020, there were 231 011 SMMEs in the province. The next question
is to know where these SMMEs operate9. In this subsection, the analysis provides a spatial distribution
of SMMEs between urban areas and non-urban areas (Table 10 and Figure 5); and between Metros
and Non-Metros (Table 10).
Table 10. Spatial distribution of SMMEs
Spatial distribution of SMMEs in South Africa Ratio
Traditional Farms/Rural Non-
Total Urban Tribal formal Urban Urban
1: Western Cape 268 799 247 815 - 20 984 92% 8%
2: Eastern Cape 231 011 135 940 78 083 16 989 59% 41%
3: Northern Cape 18 519 10 299 2 623 5 597 56% 44%
4: Free State 110 183 87 575 17 511 5 097 79% 21%
5: KwaZulu-Natal 414 071 255 456 148 418 10 196 62% 38%
6: North West 79 203 44 269 31 040 3 893 56% 44%
7: Gauteng 783 410 761 876 7 181 14 353 97% 3%
8: Mpumalanga 214 393 84 734 116 222 13 437 40% 60%
9: Limpopo 243 924 68 257 167 707 7 960 28% 72%
Total 2 363 513 1 696 221 568 785 98 507 72% 28%
Source: Statistics South Africa, Own calculations derived from the QLFS (2020)
Observations from Table 10 shows that in wealthy provinces, like Gauteng (97%) and Western Cape
(92%), SMMEs are concentrated in urban areas. However, in non-wealthy provinces, like Limpopo
(72%), SMMEs are concentrated in non-urban areas. For classification purposes, in this study, non-
9
World Bank Gauteng Firm Survey by Chandra et al., (2001). An analysis of labour markets, product markets,
financial markets, as well as other relevant factors.urban areas are made up of the traditional & tribal areas, farms areas, and rural formal areas. The
overall ratio shows that in 3Q2020, the majority (72%) of SMMEs in the country were concentrated
in urban areas while few SMMEs (28%) were concentrated in non-urban areas (See Table 10).
2.7.2 The apartheid legacy
According to the dti (2008), the poor performance of SMMEs is often associated with the racial
distortions in education, income and economic empowerment inherited from the previous regime.
However, SMMEs owned by foreign nationals, like: Pakistanis, Bangladeshis, Somalians and Ethiopians
have flourished in the townships across South Africa. Therefore, there is a danger in ascribing all the
responsibility for the underdevelopment of SMMEs to political disenfranchisement. The outcome to
this argument is that the new economic regime provides some form of supports for the revitalisation
of the SMME economy.
Figure 5. Spatial distribution of SMMEs
100%
90%
80%
70%
60%
50%
40%
30%
20%
10%
0%
GT WC FS RSA KZN EC NC NW MPL LMP
Urban TraditionalTribal Farms/Rural formal
Source: Statistics South Africa, Own calculations derived from the QLFS (2020)
Research findings so far suggest that most of the SMMEs located in the rural areas are necessity
driven. Hence, they are characteristically limited in their ability to create jobs and boost growth. A re-
examination of the approach in which rural based SMMEs are supported is recommended to increase
their impact on the socio-economic development of the communities in which they operate.
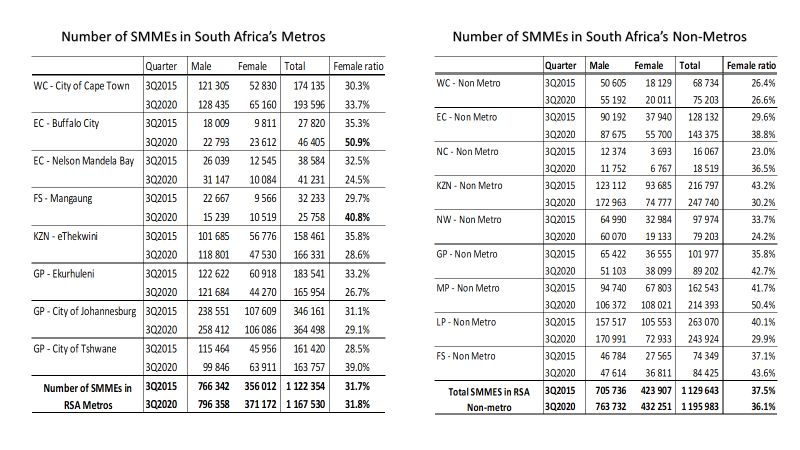
2.7.3 SMMEs distribution between Metros and Non-Metro areas
Table 11 shows that in 3Q2020, of the 2 363 513 SMMEs in South Africa, 1 167 530 SMMEs (49.4%)
operated in Metros and 1 195 983 SMMEs (50.6%) operated in Non-Metros. But in the Eastern Cape,
of the 231 011 SMMEs in the province, 143 375 SMMEs (62%) operated in Non-Metros, and 87 636
SMMEs (38%) operated in the two Metros. The BCM had more SMMEs (46 405) than the NMBM (41
231). Looking at gender disparity of SMMEs ownership in South Africa’s metros, the BCM appeared
to be the only metro in the country that achieved gender parity with almost equal share of male and
female SMME owners. This was followed by Free state with 40% SMMEs owned by female and 60%of SMMEs owned by male. In contrast, in all South Africa’s metros, SMME ownership in NMBM was dominated mostly by male owners (75%). More demographic information on SMMEs is provided in the next section. Table 11. SMMEs distribution between Metros and Non-Metro areas Source: Statistics South Africa, Own calculations derived from the QLFS (2020) 2.8 Demographic distribution of SMMEs in the Eastern Cape This section is subdivided into three sub-sections. The first subsection focuses on the gender of SMME owners, the second section looks at various population groups of SMMEs owners, and the third section emphasises on the age of SMME owners, aggregated under youth SMME owners (aged 15-34), and adult SMME owners (aged 35 plus). 2.8.1 SMMEs ownership by population group Important observations noted from Table 12 are as follows: • The majority of SMME owners in the province are Black/Africans (77%), followed by Whites (10%) and by Indians/Asians (9%). In South Africa, Africans account for 75% and Whites for 17%. Coloureds (4%) and Indians (4%) have equal share. • Between 3Q2008 and 3Q2020, White owned SMMEs in the province declined by 41% and by 16% for South Africa. Similarly, coloured owned SMMEs in the province dropped by 10% and by 12% for South Africa. • However, between 3Q2008 and 3Q2020, Black/African owned SMMEs in the province increased by 8% and by 15% for South Africa.
Table 12. In the Eastern Cape, 77% of SMMEs are owned by Black/Africans (75% for RSA)
                                       South Africa                                         Eastern Cape
                                                      % Share Growth                                    % Share Growth
                      3Q2008            3Q2020        3Q2020 rate (%)            3Q2008     3Q2020      3Q2020 rate (%)
 1: African/Black      1 539 891         1 776 542          75%        15%        164 042     177 982      77%           8%
 2: Coloured             103 957            91 643           4%       -12%          9 612       8 689       4%      -10%
 3: Indian/Asian           71 155           87 598           4%        23%          3 353      20 341       9%      507%
 4: White                484 477           407 730          17%       -16%         40 836      23 999      10%      -41%
Total SMMEs            2 199 480         2 363 513        100%           7%       217 843     231 011     100%           6%
Source: Statistics South Africa, Own calculations derived from the QLFS (2020)

From Table 3, it was revealed that 70% of SMMEs in the province are informal. In Table 12, we see
that 77% of SMMEs are owned by Black/Africans. This is an indication that the majority of
Blacks/Africans operate in the informal sector. Given South Africa’s history of exclusion based on race
and gender, the unrepresentative nature of ownership has important implications for the regulation
of small business. This distribution is critical in mobilising government SMMEs support since most of
the direct beneficiaries belong to the historically disadvantaged group. The Broad-Based Black
Economic Empowerment Act of 2003 aimed at supporting black-owned businesses, most of which are
small, both by ensuring a preference in government procurement and by incentivising large businesses
to support black-owned suppliers. There are controversial opinions about the success of BBBE, and
the analysis of these different views falls outside the scope of this report.

2.8.2 SMMEs ownership by gender

In all South Africa’s Metros, the BCM is the only metro in the country that nearly achieved equal
gender parity, with 50.9% SMMEs operated by female and 49.1% SMMEs operated by male. However,
The NMBM has the most male dominated SMME owners in the country with, three quarter of SMMEs
owned by male and a quarter by their female counterpart.

The overall picture in Table 13, reveals that during 3Q2020, for every 10 SMMEs in the province, 6
SMMEs were owned by male and 4 SMMEs by female.

Table 13. More female entrepreneurs in the BCM
                                    Male            Female            Total         % Share    Female ratio Male ratio
BCM                                   22 793           23 612           46 405        20%         50.9%          49.1%
NMBM                                  31 147           10 084           41 231        18%         24.5%          75.5%
EC Non-Metros                         87 675           55 700          143 375        62%         38.8%          61.2%
Total SMMEs in the EC               141 616            89 396          231 011       100%         38.7%          61.3%
Source: Statistics South Africa, Own calculations derived from the QLFS (2020)
2.8.3 SMMEs owned by young people in the province.
The need for youth owned SMMEs and youth entrepreneurs in South Africa, and particularly in the
Eastern Cape cannot be overstated. Why? Many graduates are unemployed. Several young people are
not in employment, education, or training institutions (NEET).
According to Stats SA’s QLFS data, in 3Q2020, the Eastern Cape had the highest youth unemployment
rate (60%) in the country (43% for RSA). The rate of unemployment among the young people stands
at 63.5% in the Eastern Cape Non-Metros; 56.1% in the NMBM and 47.9% in the BCM.
Figure 6. Slightly more than a quarter of SMMEs in the Eastern Cape are owned by youth aged 30-34
70000
60000
50000
40000
30000
20000
10000
0
Age Age Age Age Age Age Age Age Age Age Age Age Age
15-19 20-24 25-29 30-34 35-39 40-44 45-49 50-54 55-59 60-64 65-69 70-74 75+
SMMEs 0 13 342 9 437 60 841 35 864 29 573 32 158 15 305 22 856 6 845 3 397 692 702
Source: Statistics South Africa, Own calculations derived from the QLFS (2020)
Moreover, South Africa had in total 17.8 million people Not in Education, Employment, or Training of
which 8,8 million (49.5%) were youth NEET. In other words, almost half of total NEET in the country
are youth. Of the 8.8 million youth NEET in the country, 1,1 million were in the Eastern Cape. Of the
1.1 million youth NEET in the Eastern Cape, 859 672 (75%) reside in non-metropolitan areas, 165 847
(15%) in NMB metro, and only 113 231 (10%) in the BCM metro. The two metros (NMB & BCM)
account for a quarter of all youth NEET in the province (ECSECC report on NEET: 2020). The province
is yet to reap demographic dividend, as a huge number of youth remain excluded from education and
employment.
SMMEs in the province are unevenly spread between owners of different age group. Figure 6 shows
that of the 231 011 SMMEs in the province, 64% are owned by adults aged 35 and above; and 36% are
owned by young people. It also shows that more than a quarter (26%) of SMMEs in the Eastern
Cape are owned by youth aged 30-34. Young10 people (aged 15 to 24) are less likely to become
entrepreneurs, mostly because they lack the assets, experience and networks required for success.
10
In the Eastern Cape, young employers and self-employed people are more commonly found in the informal
sector and micro enterprise. If they were business owners, they are most likely to have an informal
microenterprise with no employees.This study proposes SMMEs development among the youth as a strategy to (re)integrate young people
into the labour market through entrepreneurship geared towards small businesses. The intervention
could help to address the issue of youth social exclusion, deprivation, poverty, and poor human
capital.
2.9 Number of SMME owners by marital status
The majority of SMMEs in the province are owned by “married” people (46.7%), followed by those
who are “never married” (41.9%).
Table 14. Number of SMME owners by marital status
Growth Distribution
Number of SMME Owners by marital status
rate (%) (%)
3Q2015-
3Q2015 3Q2019 1Q2020 2Q2020 3Q2020 3Q2020
3Q2020
1: Married 90 437 121 063 104 052 113 757 107 810 19% 46.7%
2: Living together like husband & wife 9 097 20 699 12 175 10 502 10 384 14% 4.5%
3: Widow/Widower 13 813 20 603 14 971 18 268 12 310 -11% 5.3%
4: Divorced or Separated 5 643 11 902 5 949 10 975 3 775 -33% 1.6%
5: Never married 75 544 68 100 88 152 94 308 96 732 28% 41.9%
Total 194 535 242 367 225 298 247 810 231 011 19% 100.0%
Source: Statistics South Africa, Own calculations derived from the QLFS (2020)
Unfortunate circumstances like divorce (separation) and losing a partner (and become
widow/widower) have negative effects on SMMES owners. Table 14 shows that, between 3Q2015 and
3Q2020, SMME ownership by window/widower and by divorced people dropped respectively by 11%
and 33%.
2.10 SMMEs by type of enterprises
For every 10 SMMEs in the province, 9 falls under private enterprises. Few are NGO, public
enterprises, or government-controlled entities.
As indicated earlier in Table 5, the province has an insignificant number of small businesses in utility
industry (electricity, water, and gas supply). There are two main reasons for that. The first one is the
monopoly in large players, like Eskom. For example, in South Africa, the bulk of electricity supply in
South Africa is generated by ESKOM. The second reason is that these large players in the utility
industry are shielded by high barriers to entry.Table 15. SMMEs by type of enterprises
South Africa Eastern Cape
3Q2015 3Q2019 2Q2020 3Q2020 3Q2015 3Q2019 2Q2020 3Q2020
1: National/provincial/local government 1 788 3 480 43 413 8 201 566 - 10 406 5 060
2: Government controlled business (Eskom, Telkom) 2 153 - - - - - - -
3: A private enterprise 2 083 866 2 463 226 2 048 668 2 192 939 175 467 202 367 160 393 204 565
4: Non-profit organisation (NGO/CBO) 11 777 15 480 13 328 10 820 1 539 811 869 370
5: A private household 135 332 166 480 305 456 150 708 16 964 39 189 76 142 21 016
Total SMMEs 2 234 917 2 648 666 2 410 866 2 362 669 194 535 242 367 247 810 231 011
South Africa Eastern Cape
3Q2015 3Q2019 2Q2020 3Q2020 3Q2015 3Q2019 2Q2020 3Q2020
1: National/provincial/local government 0% 0% 2% 0% 0% 0% 4% 2%
2: Goverment controlled business (Eskom, Telkom) 0% 0% 0% 0% 0% 0% 0% 0%
3: A private enterprise 93% 93% 85% 93% 90% 83% 65% 89%
4: Non-profit organisation (NGO/CBO) 1% 1% 1% 0% 1% 0% 0% 0%
5: A private household 6% 6% 13% 6% 9% 16% 31% 9%
Total SMMEs 100% 100% 100% 100% 100% 100% 100% 100%
Source: Statistics South Africa, Own calculations derived from the QLFS (2020)
Table 15 confirms the finding that there is no single record of SMMEs from government-controlled
businesses, like ESKOM. Panel B of Table 14 shows that during the third quarter of 2020, the majority
of SMMEs in the country (93%) and in the Eastern Cape (89%) operated in the “Private enterprises”.
Of the 231 011 SMMEs in the province, only 5 060 SMMEs operated in the “public sector”.
2.11 Number of SMMEs registered for Value-Added Tax (VAT).
VAT is an indirect system of taxation that is currently levied at 15% (as of 1 April 2018) on the value of
all goods and services supplied by vendors. It is mandatory for any business (whether the business is
registered as a Sole Proprietorship or Private Company) to register for VAT. The registration is
compulsory if the income earned in any consecutive twelve-month period exceeded or is likely to
exceed R1 million.
Figure 7. SMMEs registered for VAT
100%
90%
80%
70%
60% 53% 60% 74% 78% 80% 88%
80% 83% 88% 92%
50%
40%
30%
20%
10% 21% 18%
0%
NC WC GT RSA NW EC KZN FS MPL LMP
Registered for VAT Not registered for VAT Unspecified
Source: Statistics South Africa, Own calculations derived from the QLFS (2020)You can also read