Study of Polymerization Growth Uniformity in Polymer Gel Dosimeter
←
→
Page content transcription
If your browser does not render page correctly, please read the page content below
ACTA PHYSICA POLONICA A                                                           No. 1    Vol. 139    (2021)

                         Study of Polymerization Growth
                       Uniformity in Polymer Gel Dosimeter

                               A. Medjakala and K. Mansoura,b,∗
     a
       Laboratory of Electronic Materials Study and Their Medical Applications,
     University Brothers Mentouri — Constantine 1, Ain El Bey Road, 25000 Constantine, Algeria
     b
       University Salah Boubenider — Constantine 3,
     University Town Ali Mendjeli, Constantine, Algeria

                                  Received: 28.09.2020 & Accepted: 27.11.2020

                                                    ∗
     Doi: 10.12693/APhysPolA.139.84                     e-mail:   karim.mansour@univ-constantine3.dz

     In this work, the spatial uniformity of the polymerization growth of the MAGIC gel in the case of
     an internal irradiation with iodine-131 was studied. A compartmental mathematical model taking into
     account the kinetics of polymerization of the MAGIC gel was developed and validated by experimen-
     tal measurements. In order to check the radioactivity homogeneity distribution in the samples, we
     performed their scintigraphy, while — in order to study the rate of polymerization — we measured
     the intensity of the MRI signal emitted by each of the samples. The wide dispersion in signal strength
     observed between different regions of the same sample indicates that the value of the relaxation time T2
     varies from one point to another. Scintigraphy and MRI images showed that a homogeneous distribution
     of 131 I activity does not necessarily imply isotropic polymerization. The phenomenon is probably due
     to the fact that iodine-131 emits beta particles with different energies and the length of polymers does
     not increase with the same speed for all the polymers in formation. On this basis, we have established
     a mathematical model which compartmentalizes different species of protons which participate in the
     modification of the MRI signal.
     topics: internal dosimetry, MAGIC gel, radio-induced polymerization, mathematical modelling

                 1. Introduction                              water. Radiosensitive gels are detectors capable
                                                              to restore the spatial distribution of the absorbed
   Internal radiation therapy allows a higher dose            dose [4]. The quantity of a polymer formed at dif-
of radiation in a smaller area than might be possi-           ferent locations depends on the amount of radiation
ble with external radiation treatment [1]. However,           received at the particular location.
few dosimetric data are available [2]. Different ap-             A new type of polymer gel dosimeters, which re-
proaches in radionuclide dosimetry depend on many             spond well to an absorbed dose, manufactured in
factors [3–5]. Between the need to document the               the presence of normal levels of oxygen, was de-
delivered irradiation and the possibility to optimize         scribed by Fong et al. [6] and referred to by the
the treatment, the development of clinical dosime-            acronym MAGIC (methacrylic and ascorbic acid in
try is contrasted. It is now possible to perform per-         gelatin initiated by copper). The response to an ab-
sonalized dosimetries, considering the pharmacoki-            sorbed dose can be evaluated using magnetic reso-
netics of radiopharmaceuticals and the morphology             nance imaging (MRI). The MRI signal is directly
of each patient. Knowledge of the absorbed dose               related to the density of protons. However, the in-
and determination of the dose-response relationship           tensity of this signal depends on the relaxation time
for critical organs and tumors are necessary to op-           which varies according to the environmental situa-
timize treatments. Dosimetric tools adapted to this           tion of the proton. The relaxation time of a proton
technique are also used because the particles have            belonging to a monomer will be different from that
a weak path in the body and conventional dosime-              of a proton belonging to a polymer. However, the
ters do not allow a three-dimensional reconstruction          uncertainty in the measured dose has two sources:
of the distribution of an absorbed dose.                      the uncertainty due to a calibration curve and the
   Polymer gel dosimetry is a technique used to ver-          uncertainty from the R2 map which is the most im-
ify radiation dose distribution delivered by cancer           portant [7].
radiotherapy. The polymerization consists of the                 High energy radiation interacts with organic mat-
addition of monomers and cross-linking of polymer             ter by various physical and chemical mechanisms
chains induced by free radicals from radiolysis of            resulting in the formation of short-lived excited

                                                         84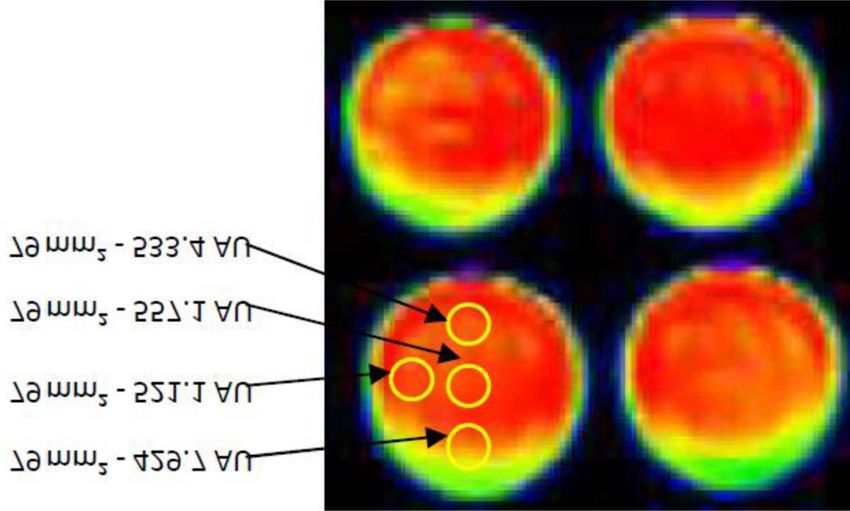
Study of Polymerization Growth. . .

species and of chemical entities, such as thermal-            dishes. Each of them contains 20% of the added ac-
ized electrons and neutral or ionic free radicals             tivity. Moreover, we made sure that the Petri dishes
exhibiting longer life times, allowing them to un-            were completely filled to prevent residual air from
dergo bimolecular reactions with various molecular            reducing polymerization and causing spontaneous
compounds by translational diffusion [8].                     polymerization stripes.
   The aim of this paper is to study the spatial                 To check the homogeneity of the radioactivity dis-
uniformity of the polymerization growth of the                tribution in the gel, scintigraphic images of the Petri
MAGIC gel in the case of an internal irradiation by           dishes containing the samples were made 1 and 3 h
iodine-131. A compartmental mathematical model                after the preparation of the iodine-131-MAGIC gel.
taking into account the kinetics of polymerization            The scintigraphic images were made by a GE Dis-
of the MAGIC gel is discussed in Sect. 2 and the ex-          covery NM/CT670 scanner.
perimental results which allowed us to validate this             In order to analyze the spatial uniformity of poly-
mathematical model are examined in Sect. 3.                   merization growth in the MAGIC gel dosimeter, two
                                                              MRI acquisitions were taken 72 and 120 h after the
           2. Material and methods                            preparation of the gel samples. To achieve the ther-
                                                              mal balance and a uniform result, the Petri dishes
                                                              were placed in the treatment room 12 h before the
            2.1. Preparation of samples                       images were made. Measurements were realised on
  The MAGIC gel was prepared according to the                 a GE model 1.5 Tesla MRI imager with a head an-
protocol established by Fong et al. [6]. This protocol        tenna. The spin echo method was used with the
can be schematized in the following steps:                    following parameters: the TE (time echo) of 20 ms,
                                                              the repetition time of 2000 ms and the matrix size
   1. Deionised water in the amount of 700 ml                 of 256 × 256.
      (water for HPLC BIOCHEM Chemopharma)
      is poured into a beaker under constant agi-                         2.2. Mathematical modelling
      tation to which 80 g of gelatine (BIOCHEM                  The polymerization initiated by ionizing radia-
      Chemopharma) are added.                                 tion occurs through the mechanism of the radiolysis
   2. The mixture is heated to 50◦C.                          of water, thus free radicals [9]. The general poly-
   3. At 50◦C, 2 g of hydroquinone (BIOCHEM                   merization process can be broken down into four
      Chemopharma) diluted in 48 ml of deionized              steps: the formation of free radicals, the initiation,
      water are added.                                        the propagation and the termination [10]. Several
                                                              advantages can be found in the particularities of
   4. The solution is air-cooled at 38◦C, then 0.35 g         a radiation-initiated polymerization which benefit
      of ascorbic acid (BIOCHEM Chemopharma)                  the processing efficiency or produce final materials
      diluted in 50 ml of deionized water and 0.02 g          with unique properties [11].
      of copper sulfate (SIGMA-ALDRICH) diluted                  The chain initiation can take place as soon as
      in 30 ml of deionized water are added.                  the properly selected initiator starts to decompose
   5. The new mixture is shaken for 3 min.                    into free radicals. The initiation is completed when
   6. Methacrylic acid (BIOCHEM Chemopharma)                  the initiator radical has been added to the first
      with a concentration of 9% is added to the gel          monomer unit, M , to produce the chain initiating
      which is shaken for 3 min to make it homoge-            species M1• . From a kinetic standpoint, the rate of
      neous.                                                  initiation Ri is controlled by the initiator decompo-
                                                              sition. Though directly related to the decomposi-
The obtained gel is poured into 10 bottles with               tion rate of the initiator Rd , the effective initiation
screw caps and each bottle contains 90 ml of this             rate Ri depends on the efficiency factor which takes
gel. These vials were vortex-loaded for 2 min and             into account the fraction of generated free radicals
then refrigerated at 4◦C, 18 h before adding iodine-          that effectively add to the monomer for producing
131. In order to verify the density homogeneity of            M1• — the chain initiating species [12].
the gel, we checked each of the samples by computed              The propagation consists of the iterative growth
tomography and measured the dispersion of the CT              of the initiating radical M1• that forms, after enough
numbers values. The dispersion of the measured CT             additions, a macro radical. By comparing the ef-
numbers varies between 2 and 4% which confirms                fects of substituents on the stability of the free
the homogeneity of the samples. The tomodensit-               radical, higher propagation rate constants are ob-
ometric images were carried out using a General               served for less stabilized active centers. However,
Electric CT Optima 660 (128 slices — 2015).                   for achieving the formation of chains with a high de-
   To manufacture the amounts of radioactivity                gree of polymerization, the reactivity of free radicals
to be added to the gel samples, the contents of               must be mainly directed towards propagation, lim-
a 4.0 GBq capsule are diluted in 80 ml of deion-              iting competing reactions of a charge transfer [13].
ized water and activities of 200 to 600 MBq with              The radiolysis is the radiation-induced dissociation
a 50 MBq step have been formed. The mixture is                of water molecules in several highly reactive radicals
stirred during 3 min and then poured into five Petri          and ions [14].

                                                         85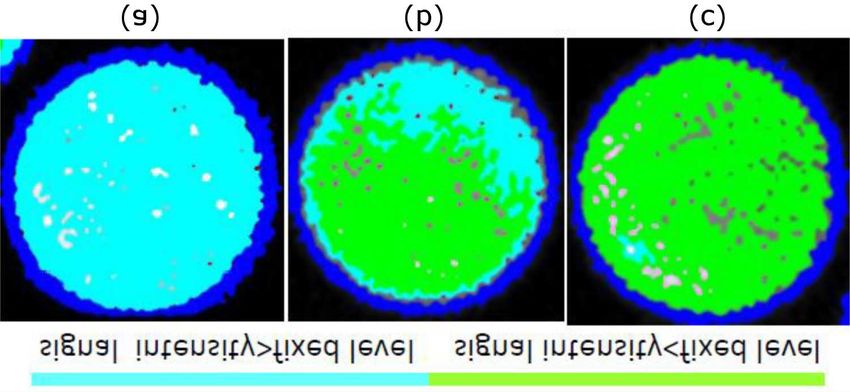
A. Medjakal et al.

                                                                Moreover, the protons in each of the compart-
                                                              ments will contribute to the MRI signal in pro-
                                                              portion to their densities. Therefore, this signal
                                                              will consist of the signals emitted respectively by
                                                              the protons of the water (iwater ), the protons of
                                                              the gelatine (ig ) and those of the two compart-
                                                              ments. For a control sample (unirradiated gel), the
                                                              MRI signal intensity is the sum of the signals emit-
                                                              ted by the water protons, the gelatin protons and
                                                              the monomer protons P1 (0) (the initial number of
                                                              monomer protons). Then, the MRI signal intensity
                                                              for this sample is given by
                                                                  i0 = P1 (0) m0 e−R20 TE + iwater + ig .      (5)
  Fig. 1. (a) Schematization of a polymerization              The number of protons of compartment 1 (protons
  process, (b) proposed bicompartmental model.                of the monomers) is denoted by P1 (t) and P2 (t) is
                                                              the number of protons of compartment 2 (protons
                                                              of the polymers: growing or formed) with a proba-
   All steps can be described by mathematical equa-           bility of transfer per unit of time p1 (t) proportional
tions. It is important to note that all speeds are            to the absorbed dose rate Ḋ(t). Thus,
time-dependent because the dose rate is also time-
dependent. Thus, the rate of initiation of chain rad-            p1 (t) = k1 Ḋ(t)                               (6)
icals Ri (t) may be written as                                and it is equivalent to the polymerization initiation
               d [M • ]                                       probability.

    Ri (t) =                = 2f kd [I(t)] ,       (1)
                  dt      i
                                                                The dose rate Ḋ(t) in the case of internal irradi-
where [M • ] represents the total concentration of all        ation is given by [15]:
chain radicals irrespective of size and [I(t)] is the                      CX
                                                                  Ḋ (t) =    a(t)                              (7)
initiator concentration at time t. The rate constant                       m
kd is the rate for its decomposition into two radi-           with
cals R• per molecule and f represents the fraction
                                                                           X
                                                                  CX = k      ni Ei φi ,                        (8)
of these primary radicals initiating the chains.                           i
   Furthermore, the rate of chain termination Rt
                                                              where a(t) is the activity [MBq], ni is the number
may be written as
                                                              of radiations having an energy Ei [MeV] emitted by
                  d [M • ]

                                            2                 the nuclear transition of the radioelement X, φi is
    Rt (t) = −                  = 2kt [M • ] .     (2)
                     dt      t                                the fraction of emitted energy absorbed by the tar-
When Ri (t) = Rt (t), the steady-state concentration          get, m is the mass of the target [kg] and k is a con-
of chain radicals can be expressed by                         stant [Gy kg/(MBq s MeV)].
             r
        •        kd                                              Then, the absorbed dose at the time t after the
    [M ] = f         [I(t)],                       (3)        sample preparation is
                 kt
while the rate of propagation is then                                     CX a (0)
                      r                                           D (t) =            1 − e−λp t ,               (9)
                           kd                                              m λp
    Rp (t) = kp [M ] f         [I(t)].             (4)
                           kt                                 where λp = 0.693/Tp and Tp ≈ 8 days is the physi-
Note that Rp (t) also represents the rate of polymer-         cal period of iodine-131.
ization.                                                        The model depicted in Fig. 1 can be accordingly
   In the ionizing radiations case, the factor f rep-         described
resents the quantum yield for the chain initiation                dP1 (t)     dP2 (t)
(the number of pairs of chain radicals generated per                      =−           = −k1 ḊP1 (t) ,    (10)
                                                                    dt           dt
quantum absorbed).                                            then
   To establish a description of the variations in the            (
proton densities of different species contributing to               P1 (t) = P1 (0) e−k1 Ḋt             (11)
the formation of the MRI signal, we have classi-                    P2 (t) = P1 (0) 1 − e−k1 Ḋt .
fied them in two categories: (i) the category of mo-
                                                              At the time τ and the gel having received a dose
bile protons (water and monomers protons) and (ii)
                                                              D (τ ), the relaxation rate increases and is given by
the category of gelatin and polymer protons. Our
model is constituted by two compartments: com-                                      CX a (0)
                                                                                               1 − e−λp τ =

                                                                 R2 (τ ) = R20 + α
partment 1 is formed by monomer protons and com-                                     m λp
partment 2 — by protons of growing or already
formed polymers (see Fig. 1). The rest of the pro-                 R20 + αγ(τ ),                                (12)
tons contribute to the formation of the signal but            where α determines the change in the rate per unit
do not modify it.                                             dose.

                                                         86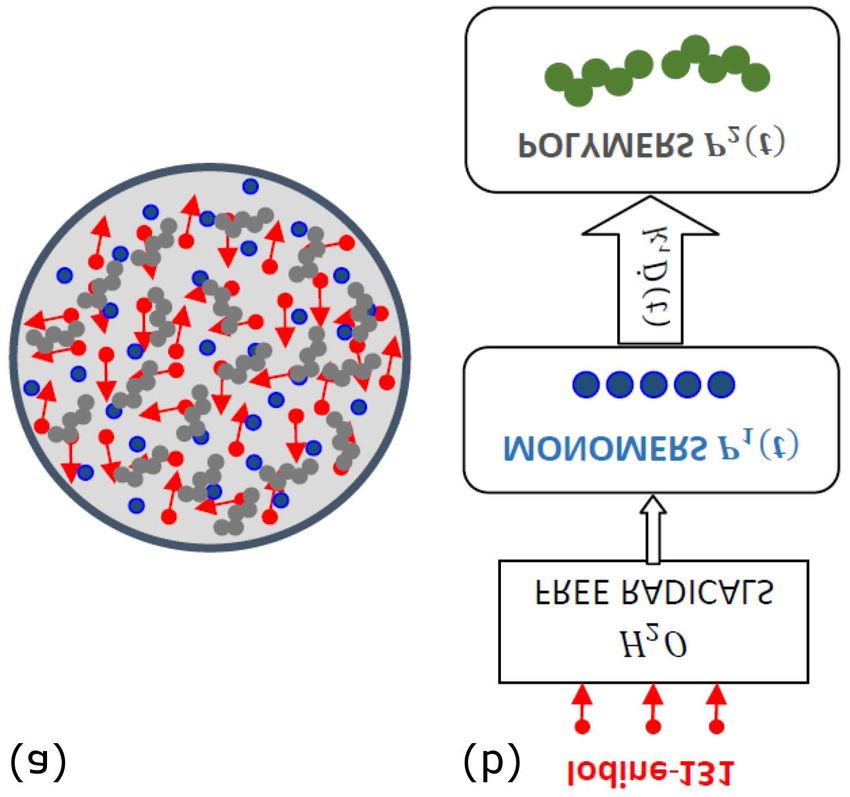
Study of Polymerization Growth. . .
Then, the MRI signal intensity becomes
i(τ ) = P1 (τ ) m0 e−R20 TE
+P2 (τ ) m0 e−(R20 +αγ(τ ))TE . (13)
For the MAGIC–iodine-131 gel, the signal intensity
at the time τ is given by
i1 (τ ) = ζmono (τ ) + ζpoly (τ ) + iwater + ig , (14)
where
ζmono (τ ) = P1 (0) m0 e−k1 γ(τ ) e−R20 TE ,
1− e−k1 γ(τ ) −R20 TE
ζpoly (τ ) = P1 (0) m0 exp αγ(τ )TE
e .
(15)
In order to simplify the above expressions, one cal- Fig. 3. Mean MRI signal intensity (arbitrary unit)
culates versus the activity a(0) deposited in samples
i0 − i1 (τ )
−k1 δ(τ )
(average ±σ).
= P 1 (0) m0 1 − e
e−R20 TE
× 1 − e−TE α δ(τ ) . (16)
This result means that the number of polymers
for each length will depend on the same parame-
ters and the average of the proton relaxation rate
R2 = R20 + αD will change over time.
3. Results
In order to check the radioactivity homogeneity
distribution in the samples, we have scanned them Fig. 4. Intensity MRI signal (arbitrary units) of
by scintigraphy. If aj is the activity contained in the four samples having received the same activity
sample j and ij is the intensity of the scintigraphic (80 MBq).
signal emitted by this sample, then the signal in-
tensity and activity are linked by a linear relation
ij = αaj + β, (17)
where α and β are two constants determined by the
least squares method. The correlation coefficient
is denoted by r and β represents the background
noise. Curves presented in Fig. 2 give variations of
the mean signal intensity measured by scintigraphy
versus the activity of iodine-131 deposited in the
MAGIC gel samples.
Fig. 5. NM (a) and MR (b) images of the same
sample.
Furthermore, in order to study the rate of poly-
merization, we measured the intensity of the MRI
signal emitted by each of the samples. We therefore
considered the signal emitted by an axial section of
the sample and studied the statistical dispersion of
the signal between pixels. For each activity, five
measures were taken. Curves in Fig. 3 give the av-
erage values, with the standard deviations of signal
intensities measured for each activity (see Fig. 4).
The wide dispersion in signal strength observed
between different regions of the same sample shows
Fig. 2. Mean scintigraphic signal intensity (arbi- that this sample does not emit a homogeneous sig-
trary unit) versus the activity a deposited in the nal. This also means that the value of the relaxation
sample (average ±σ). HAPG = hour after prepa- time T2 varies from one point to another. There-
ration of the gel. 1 HAPG: i (a) = 5.50a + fore, we manually segmented the different MR im-
38.94, r2 = 0.972; 3 HAPG: i (a) = 4.99a + 35.89, ages by using a multilevel thresholding image seg-
r2 = 0.962. mentation [16] (see Fig. 5b).
87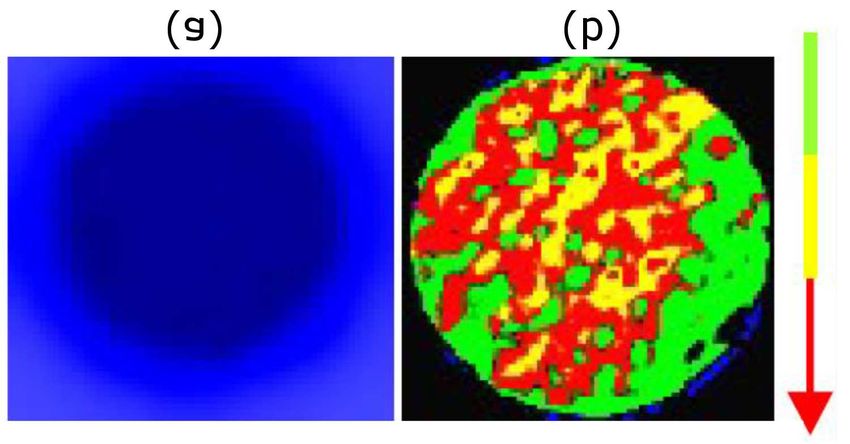
A. Medjakal et al.
4. Discussion
Dosimetry studies are generally difficult to per-
form in vectorized internal radiotherapy. By mea-
suring the variations of the MRI signal of the ir-
radiated gels [17], we studied the homogeneity of
the radio-induced polymerization. Scintigraphy and
MRI images showed that a homogeneous distri-
bution of 131I activity does not necessarily imply
isotropic polymerization. Indeed, Fig. 3b shows
that the polymerization seems not to be isotropic
despite a homogeneous distribution of radioactivity
(Fig. 5a). This phenomenon is probably linked to
the fact that iodine-131 emits beta particles with
different energies and the length of the polymers
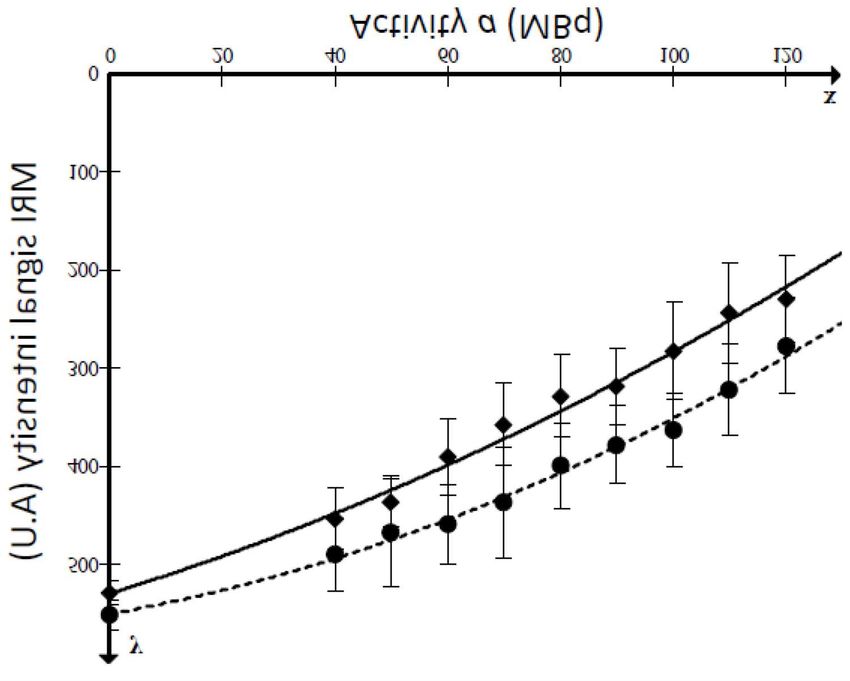
Fig. 6. Variations of the MRI signal intensity ver-
sus the deposited activity. Dashed line: 550(1 −
does not increase with the same speed for all the
−3 −3 polymers in formation. Moreover, this result can
e−3.28×10 a )(1 − e−1.90×10 a ). Solid line: 550(1 −
−4 −3 be explained by the fact that the conversion curves
e−1.24×10 a )(1 − e−2.14×10 a ) (experimental val- of methacrylic acid are linear and the resulting
ues and fitted curves from (10)). polymer does not appear to have a stereoregular
structure.
The functioning of any polymer gel system is the
radiation-induced polymerization of the monomer
species present in the gel. Traditionally, radiation
induces polymerization of a monomer and a cross
linker. In single monomer systems, several fac-
tors affect the rate of polymerization or the rate
of monomer consumption. The observed heteroge-
neous polymer structure can be attributed to a pos-
sible increase in the termination directly related to
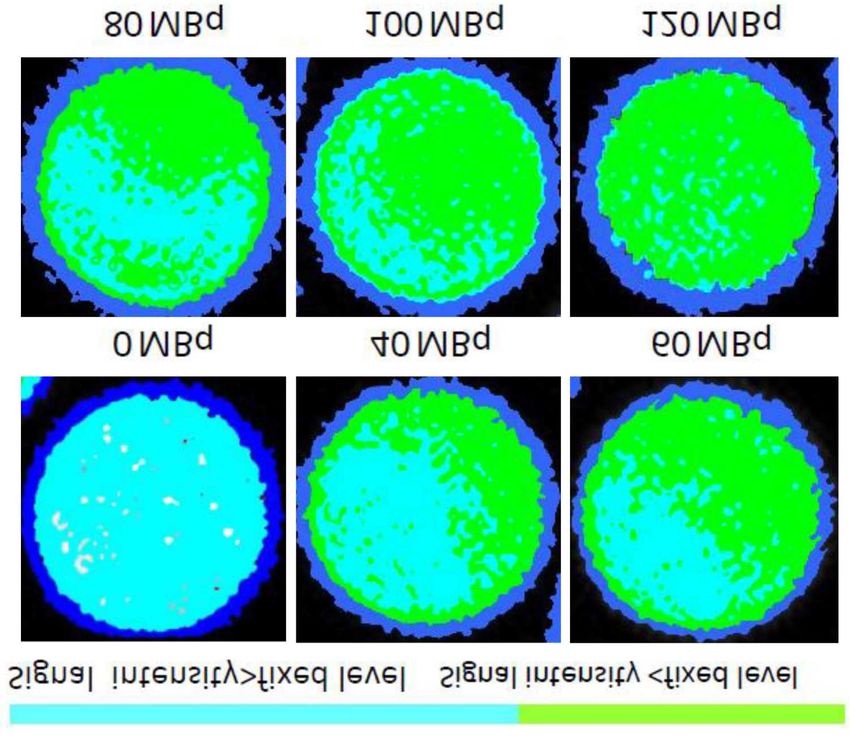
Fig. 7. MR images of the same sample segmented the initial monomer concentration.
by using multilevel thresholding. (a) Without ac-
tivity, (b) 72 HAPG, and (c) 120 HAPG.
However, these first results suggest that addi-
tional measurements must be carried out in order
to study with precision the polymerization process
and its influence on the MRI signal of the MAGIC
gel dosimeter.
The values of the calculated standard deviations
(Fig. 3) show a large dispersion of the signal inten-
sities on the same sample. This dispersion is due
to the fact that the irradiation is carried out con-
tinuously with a decreasing dose rate. As a result,
the polymerization cannot evolve in the same way
at all points of the sample.
Images in Fig. 5 were made on the same sam-
ple, before the introduction of radioactivity (con-
trol sample), 72 h and 120 h, respectively, after the
introduction of iodine-131. These images were seg-
mented manually to highlight that two distinct ar-
eas give different intensities of the MRI signal. Also,
despite a uniform distribution of radioactivity in the
Fig. 8. MR images segmented by using multi- sample (verified by scintigraphic images), the poly-
level thresholding obtained for different deposited merization does not appear to have constant kinet-
activities. ics in the sample. This result is in agreement with
our hypotheses made to build the proposed math-
In order to validate the proposed mathemati- ematical model (Fig. 1). Furthermore, the image
cal model, the experimental values were fitted us- in Fig. 5 shows that the polymer compartment con-
ing (10) (see Fig. 6). Furthermore, the MR images tains several sub-compartments emitting signals of
of samples were segmented into two classes by using different intensities which justifies the hypothesis
a multilevel thresholding image segmentation [16] according to which, at a given instant t, the length
(see Figs. 7 and 8). of the polymers is not the same.
88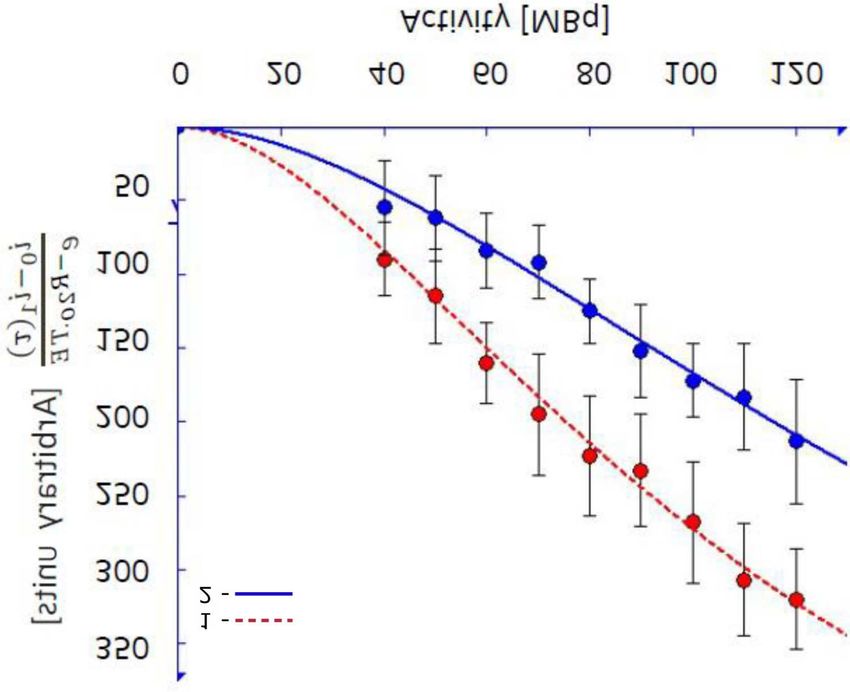
Study of Polymerization Growth. . .

   The curves in Fig. 5 show that the values of                                   References
the intensity of the MRI signal can be fitted by
the equations established from the proposed model.                [1] S. Becker, S. Laffont, F. Vitry et al., Nucl.
However, the initial equations do not take into ac-                   Med. Commun. 29, 815 (2008).
count the fact that the relation rate R varies with               [2] J. Gear, C. Chiesa, M. Lassmann,
time. It is then necessary to establish a mathemati-                  P.M. Gabiña, J. Tran-Gia, C. Stokke,
cal relationship which accounts for these variations.                 G. Flux, EJNMMI Phys. 7, 15 (2020).
                                      k1
   We have also noted that the aTE        ratio varies as
a function of time. In fact, it is 0.748 and 0.580, 72 h          [3] L. Strigari, M. Konijnenberg, C. Chiesa,
and 120 h, respectively, after the preparation of the                 M. Bardies, Y. Du, K.S. Gleisner, M. Lass-
samples. Since TE is fixed by the measurement con-                    mann, G. Flux, Eur. J. Nucl. Med. Mol.
ditions, the varying values are those of k1 and a .                   Imaging 41, 1976 (2014).
It seems that these two parameters are modified by                [4] W.S. Snyder, M.R. Ford, G.G. Warner,
the presence of polymers which increases with time.                   H.L. Fisher, J. Nucl. Med. 10, 5 (1969).
However, it is necessary to consider more complex                 [5] R. Loevinger, M. Berman, MIRD Pamphlet
measurements to confirm variations in the ratio of                    No. 1, Society of Nuclear Medicine, New
these two parameters and verify that these varia-                     York 1976.
tions are statistically significant.                              [6] P.M. Fong, D.C. Keil, M.D. Does,
                                                                      J.C. Gore, Phys. Med. Biol. 46, 3105
                   5. Conclusion                                      (2001).
   A polymer gel is a highly reliable 3D dosimeter                [7] M. Keshtar, A. Takavar, M.H. Zah-
in vectorized internal radiotherapy. The basic prin-                  matkesh, A.R. Montazerabadi, J. Biomed.
ciple is to measure the variations of the intensity of                Phys. Eng. 7, 299 (2017).
the MRI signal emitted by this dosimeter. It has                  [8] M. Ferry, Y. Ngono-Ravache, C. Aymes-
been shown that these variations in the MRI signal                    Chodur, M.C. Clochard, X. Coqueret,
are directly linked to the kinetics of the radiation-                 L. Ortella, E. Pellizzi, S. Rouif, S. Esnouf,
induced polymerization. However, our measure-                         in: Reference Module in Materials Science
ments performed on samples receiving internal ir-                     and Materials Engineering, Elsevier, Ams-
radiation suggest that this kinetics is neither ho-                   terdam 2016.
mogeneous nor isotropic. On this basis, we have                   [9] G. Odian, Principles of Polymerization,
established a mathematical model which compart-                       4th ed., Wiley, New York 2004.
mentalizes the different species of protons that par-            [10] C. Baldock, Y. De Deene, S. Do-
ticipate in the modification of the MRI signal. From                  ran, G. Ibbott, A. Jirasek, M. Lepage,
this model, the mathematical equation of the MRI                      K.B. McAuley, M. Oldham, L.J. Schreiner,
signal emitted by the irradiated gel, as a function                   Phys. Med. Biol. 55, 1 (2010).
of the activity initially present in the samples, was
                                                                 [11] F. Courbon, P. Love, S. Chittenden,
established. In addition, we have shown that the
                                                                      G. Flux, P. Ravel, G. Cook, Cancer Bio-
equation describing the variations in the relaxation
                                                                      ther. Radiopharmaceut. 2, 427 (2006).
rate R2 is not a linear function of the absorbed dose
but rather a function with an exponential compo-                 [12] W.Y. Chiu, G.M. Carratt, D.S. Soong,
nent. Therefore, our results seem to be in contra-                    Macromolecules 16, 348 (1983).
diction with the data in the literature but in reality           [13] K. Matyjaszewski, T.P. Davis, Handbook of
they complement them because they suggest cor-                        Free Radical Polymerization, Wiley, New
recting the value of the absorbed dose taking into                    York 2003.
account the calibration equation R2 (D) that we                  [14] J.W.T. Spinks, R.J. Woods, An Intro-
established.                                                          duction to Radiation Chemistry, 3rd ed.,
   Moreover, our experimental results show that it is                 Wiley, New York 1990.
also necessary to introduce the probabilistic aspect             [15] W.E. Bolch, K.F. Eckerman, G. Sgouros,
of the radiation-induced polymerization of polymer                    R. Thomas, J. Nucl. Med. 50, 477 (2009).
gels (polymerization growth, early termination of                [16] S. Pare, A. Kumar, G.K. Singh, V. Bajaj,
the polymerization, etc.) into the equations describ-                 Iran. J. Sci. Technol. Trans. Electr. Eng.
ing the proposed mathematical model. This is pre-                     44, 1 (2020).
cisely the work currently carried out by our team
                                                                 [17] M.J. Maryanski, J.C. Gore, R.P. Kennan,
with the aim to establish the mathematical equa-
                                                                      R.J. Schulz, Magn. Reson. Imaging 11,
tions of different stages of radiation-induced poly-
                                                                      253 (1993).
merization in order to take them into account in the
modelling.
   Finally, the obtained results can serve as a basis
for the development of a new approach in the deter-
mination of the absorbed dose from the calibration
curves.

                                                            89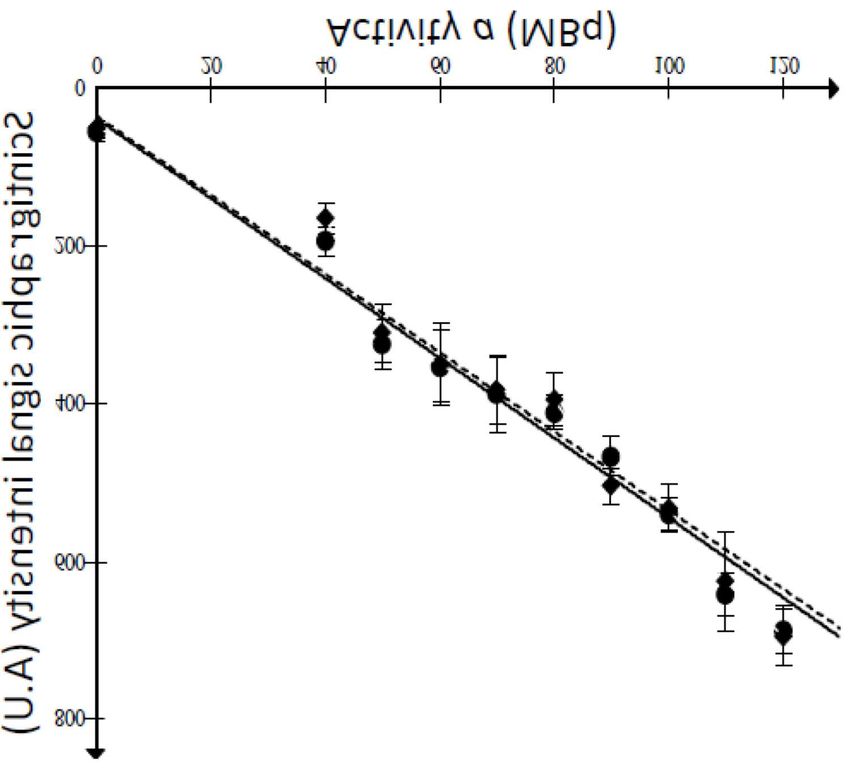
You can also read