Volume 41, Issue 2 The trashy side of baseball: An econometric analysis of the Houston Astros cheating scandal.
←
→
Page content transcription
If your browser does not render page correctly, please read the page content below
Volume 41, Issue 2

   The trashy side of baseball: An econometric analysis of the Houston Astros
                                 cheating scandal.

                                                           Brandli Stitzel
                                                     West Texas A&M University

                    Ryan S Mattson                                                              Rex Pjesky
      West Texas A&M University and The Center for                                      West Texas A&M University
                   Financial Stability

                                                              Abstract
In this paper, we investigate the efficacy of the cheating scheme employed by the Houston Astros the 2017 Major
League Baseball season, in which they won the championship. We present evidence that the cheating scheme
profoundly affected player performance and increased the number of wins the Astro's accumulated in the 2017
season. We analyze individual player performance in the 2017 season to estimate the average individual benefit to the
Astros players from the scheme. We use these estimates to calculate the benefit to the team in terms of offensive
performance and the cumulative impact on the team's overall performance. We estimate the team won at least 2-3
games and potentially as many as 15 games they might not have otherwise won had they not cheated. Our analysis
presents the first estimates of the benefits of this momentous event.

Our preferred Secondary JEL Category is Z2: Sports Economics
Citation: Brandli Stitzel and Ryan S Mattson and Rex Pjesky, (2021) ''The trashy side of baseball: An econometric analysis of the Houston
Astros cheating scandal.'', Economics Bulletin, Vol. 41 No. 2 pp. 507-522.
Contact: Brandli Stitzel - bstitzel@wtamu.edu, Ryan S Mattson - rmattson@wtamu.edu, Rex Pjesky - rpjesky@wtamu.edu.
Submitted: October 23, 2020. Published: April 09, 2021.
1. Introduction
Baseball has a history of cheating: the Black Sox, Pete Rose, and the steroid era1 all mar
baseball’s past. The most recent dark chapter unfolded before the 2020 Major League Baseball
season. Late in 2019, the Houston Astros were accused of using video cameras to steal opponent
signs during their championship 2017 season. A Major League Baseball investigation confirmed
the allegations of cheating (MLB.com, 2020). The League penalized the Astros’ organization,
Astros’ general manager, Jeff Lunhow, and manager, AJ Hinch. More importantly, the
confirmation of cheating tainted the Astros’ 2017 World Series Championship (Rosenthal and
Drellich 2019).
The Astro's cheating scheme is not the first in professional sports. Duggan and Levitt (2002)
provided economic and statistical evidence that Sumo wrestling matches were often rigged.
Sumo wrestling rules provide the opportunity for individuals wrestlers to gain by swapping
victories in certain situations. Duggan and Levitt's empirical work found evidence that such
swapping was taking place.
Becker (1968) provides the economic framework for the evaluation of cheating in sports. Becker
argues cheating will increase as the benefit of cheating rises or when the probability of being
caught falls. Therefore, those who seek to gain an advantage from cheating will design a scheme
to maximize the benefit from cheating and minimizes the chances of getting caught. The Astro's
cheating scheme fits this formula.
The focus of baseball is the competition between the batter and the pitcher. The pitcher seeks to
get the batter “out” by causing him to miss three pitches or by inducing weak contact enabling
the defenders to retire the batter on the basepaths. To obtain an out, the pitcher uses various pitch
types and pitch locations to disrupt the batter’s ability to hit the pitch. The batter’s uncertainty
about the pitcher’s intentions on any given pitch is paramount to the pitcher’s success. The
pitcher and his catcher, communicate via the catcher’s hand signals. These hand signals tell the
pitcher which pitch type and where to throw. For a discussion on the process, value, and ethics of
sign stealing baseball see Barna (2019).
The Astros positioned video cameras in center field of their home stadium and trained them to
steal the opponent’s catcher’s signs to the pitcher. They then conveyed this information in real-
time to an operator behind their team’s dugout who used decoding software and audible signals
to communicate the pitch information to the batter in time for him to react to the pitch.
Knowing the pitcher’s intended pitch and location is an enormous advantage for the batter. The
batter no longer needs to discern between pitch types and can then predict the pitch’s eventual
location relative to the strike zone based on relative movement tendencies of different pitches.
The value of this is high because the act of deciding whether or not to swing at a pitch, and the
ability to hit it, happens during an extremely short time frame, as short as 375 milliseconds
(Takeuchi and Inomata, 2009).
1
Tynes (2006)The 2017 championship Astros had the most prolific single-season offensive output at the time.2
Would the team have won the World Series or even made the playoffs without cheating?
Despite the potential benefits and scope of cheating, Major League Baseball did not expunge or
even place a qualification on the Astros' championship season. Therefore, the league did not
think the cheating had a decisive impact on the season. In contrast, this paper presents evidence
that the cheating scheme had a profound effect on player performance and increased the number
of wins the Astro's accumulated.
2. Data
An extensive data set of pitch and at-bat characteristics is merged with a novel data set that
tracks the audible signal to the batter, given by an operator behind the dugout banging on the
trash can. In pairing the occurrence and non-occurrence of the signal with the characteristics of
each encounter, the effect of the real-time information about the pitch is quantified. Detailed
information about each pitch's characteristics and outcome with and without the cheating signal,
is a unique and rich resource allowing for careful and precise measurement of the Astro’s
cheating effectiveness.
Bill Petti's open-access R program baseballr provides information about each plate appearance.
Petti’s package scrapes data from FanGraphs.com and Baseball-Reference.com, creating an
exhaustive data set with measures over select time frames. Specifically, it scrapes data regarding
pitch speed, pitch movement, pitch location, launch speed of a struck ball, launch angle, and
other characteristics about each plate appearance's outcomes. These data are paired with Tony
Adams' databases of the audible cheating signal-the trash can 'bang'. Estimation techniques
coupled with this data are used to quantify the Astros' overall season benefit resulting from the
illicit strategy.
Adams' data reveals two distinct regimes for the audible bang signal. The first regime appears to
be a 'training' period, starting with the first game of the regular season, April 3rd, against the
Seattle Mariners to the May 24th game against the Detroit Tigers. During this time, there are an
average of two bangs heard each game. However, after May 28th to the end of the regular
season, the average increases immediately to 29 audible signals per game, implying more
frequent use of the system. The two regimes are seen clearly in Figure 1, which also
demonstrates the signaling scale throughout the 2017 season. It is crucial to note that signals only
occur in home games.
2
As measured by weighted runs created (wRC+). wRC+ quantifies a batter’s offensive performance by weighting
their individual offensive outcomes by the expected run value of that offensive outcome.
https://library.fangraphs.com/offense/wrc/Figure 1: Tony Adams Audible Bang Signal Data Figure 2 reports the percentages of pitches with an audible signal observed at any time during the plate appearance by inning. The pattern is consistent with a well-considered strategy of cheating. There were few signals in the first inning because opponent hand signals, known as signs, needed to be discovered and cataloged. Thus, the Astros had a lower frequency of audible signals during the first inning. As the game progresses, the frequency of the signal rises. Then, on average, signal use decreases late in games since the value of cheating is small if the outcome of the game is not in question. The frequency of audible signals increases again if the game goes to a 10th inning. A 10th inning spike is expected since the value of cheating is likely at its highest during this time. The home team bats last, so the game is in "sudden death." Perhaps surprisingly at first glance, if the game extends to a 12th inning, the occurrence of the cheating signal drops. Why might the signal drop if the 11th and 12th inning may be “sudden death”? After the 10th inning, many fans leave the stadium, and a drop in noise makes the audible bang signal much clearer and increases the likelihood of someone discovering the cheating scheme. These summary statistics imply a well thought out strategy employed with discipline and rigor.
Figure 2: Frequency of Audible Signals Per Inning

Figure 3 reports the frequency of audible signals per type of pitch. The audible signal produces
inside information for the batters on the type of pitch to expect. Not all pitcher repertoires
include all types of pitches, so the Astros design the system to help batters distinguish the
pitcher's fastball from their main off-speed pitch. Some pitchers feature more than one off-speed
pitch, which the Astros' operator differentiates by producing multiple consecutive audible
signals. A common scheme is to give one signal bang for a slider (a type of breaking pitch), two
for a changeup (typically a straighter and slower pitch to disrupt the batter's timing), and no
signal for a fastball. Thus, signals occur on types of pitches where ''inside information'' matters
most. Figure 3 highlights that the Astros commonly employ the scheme against various kinds of
off-speed pitches and generally do not for fastball variants (sinkers, two-seamers, and four-
seamers). The audible, real-time signal is valuable for breaking pitches. The distribution of the
signals given by pitch confirms this.
Figure 3: Audible Signal and Type of Pitch

A summary glance of the data set suggests that the Astros employed the cheating scheme to help
batters identify the pitch type that was coming next. This complex process developed throughout
the season and within each game. By the middle of the 2017 season, it was consistently and
often. The most common offspeed pitches were signaled 20-30% of the time at home games.
Further analysis in this paper determines the marginal benefit of using the strategy and quantifies
the Houston Astros' advantage during its first World Series Championship season in the next
section.

                                       3. Estimation and Results

Batters control two essential factors of their plate appearance outcomes: the speed and vertical
angle at which the ball leaves the bat. Defenders position themselves around the baseball
diamond to cover the field. The batter tries to hit the ball to places on the field where fielders are
not, and the pitcher attempts to throw pitches that force the ball to be hit to areas defended by the
fielders. At the same time, teams will anticipate where the ball might be hit in the field and
reposition themselves in defensive alignments, called “shifts”, to maximize fielding the ball.
Pitchers will throw certain pitches based on these defensive shifts.

The key metric that determines the pitcher/batter competition's success is the ball's launch angle
off the bat after it has been hit. Pitchers mainly try to influence the horizontal direction of the
ball as it comes off the bat. By controlling this direction, the pitcher controls where in the field
the ball will land. If the fielders' defensive shift correctly anticipates the direction the ball is hit,
they maximize the batter's chance of being out.
The counter-strategy of the batter is to control the vertical launch angle of the ball. The batter
will try to either hit a home run in which case, fielder position does not matter, or hit the ball so
sharply that it will thwart the fielders' efforts to get the batter out.
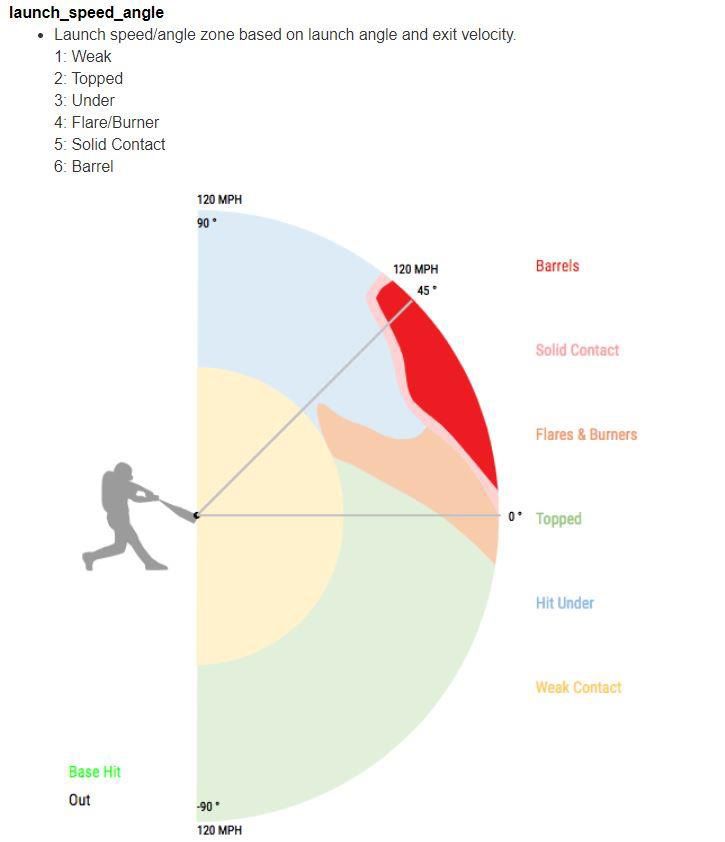
The optimal launch angle is approximately 25 degrees (Sawicki et al., 2003). Figure 4 from
Baseball Savant3 demonstrates the relationship between launch speeds and launch angles.
Regardless of the angle, balls hit softly are “weak” contact. Balls hit at too high a launch angle
produce easy catches, known as fly-outs or pop-ups. Balls hit at lower launch angles create
ground balls, which have lower odds of producing extra-base hits and often create easy outs
made by infielders.
Figure 4: Launch Speeds and Launch Angle Relationship, from Baseball Savant.
The scheme improves the Astros' offense in two ways. First, the hitters are more selective in
what types of pitches they try to hit. If batters know what pitch was coming, they select ones that
3
https://baseballsavant.mlb.com/csv-docsthey have a higher probability of hitting at the best launch angle. Second, they avoid swinging at
non-strike pitches; reducing weak contact and improving the pitch count of the at bat. The
number of times a batter swings at a pitch that is not a strike is called the "chase rate."
The audible bang strategy effects the launch speed and angle of balls put in play and benefits of
lower chase rates. The results are interpreted in their effects on the offense's total production and
runs. The model provides an estimate of the additional wins the Astros gained as a result of
cheating.
A fixed-effects panel data methodology is appropriate to estimate the impact of the cheating
strategy. The effect on launch speed, launch angle, and chase rate are estimated in Equation (1),
Equation (2), and Equation (3). Results are presented in Tables I, II, and III, respectively.
� �
�, ,� = , ,� + �� � , ,� +�, ,�
(1)
, ,� = , ,� +� �, ,� +�, ,�
(2)
�r( , , ,� = |�) = Φ( , ,� +� �, ,� +�, ,� )
(3)
Equation (1) estimates the effect of the scheme on launch speed per at-bat during game �
denoted as � , only for balls put in play. Equation (2) estimates the effect of the scheme on
launch angle per at-bat during game � denoted as , only for balls put in play. Equation (3)
estimates the effect of the scheme on chase rate per pitch during plate appearance in game �
denoted as , , for all non-strikes faced by the batter. Effective speed of the pitch , the
horizontal movement , the vertical movement , fixed effects for pitch type and year, , were
controls common to all estimations as defined in matrix � with vector of coefficients �.
�
�
� �, ,� = ,
, ,�
.
, ,�
[ � ] [ , ,� ]
The models uses data from the 2015-2017 MLB seasons.
A is the variable of interest in each equation, indicating the audible signal; the “trashy” hallmark
of the Astro’s attempt to alert the batter of the pitch type and potential location. The batter
decodes the presence or absence of the signal to learn the kind of pitch he faces next.
When the batter hears the signal, he knows that the next pitch will be the pitcher's primary off-
speed pitch. If the batter hears no signal during an at-bat, he knows the pitch would be a fastball
with a high probability. All three equations are estimated twice. In the first estimation, A takesthe binary value of one for all pitches during a plate appearance with the signal present once. In
the second estimation, A takes the binary value of one only for specific pitches coinciding with
the signal. In the tables, the first set of estimations were denoted as A while the second set of
estimations were denoted B.
The results demonstrate that the audible bang resulted in positive and significant increases in
launch speeds and launch angles, implying that batters hit the ball better when cheating was
occurring.
Table I: Fixed Effects Estimation Results on Launch Speed.
A B
COEFFICIENT SE COEFFICIENT SE
Bang 1.509*** 0.672 3.870*** 1.052
X Movement -0.267*** 0.028 -0.267*** 0.028
Y Movement -0.933*** 0.062 -0932*** 0.062
Effective Speed 0.038*** 0.007 -0.038*** 0.007
Pitch Type FE x x
Year FE x x
Constant 87.199*** 0.663 87.199*** 0.663
note: *** pTable III: Fixed Effects Estimation Results on Swinging at Non-Strikes.
A B
COEF SE COEF SE
Bang -0.068* 0.035 -0.298*** 0.055
X Movement -0.002 0.002 -0.002 0.002
Y Movement -0.109*** 0.003 -0.109*** 0.003
Effective Speed 0.017*** 0.000 0.017*** 0.000
Pitch FE x x
Year FE x x
Constant -2.087*** 0.036 -2.088*** 0.036
note: *** pThe above estimates measure the increase in offensive production and runs resulting from the
cheating scheme. The Pythagorean win-loss formula translates how many additional wins the
Astros have due to the extra runs.
Launch speed and angle affect a batter’s offensive production in two ways. First, better hit balls
improve the probability of reaching base, is measured by the On Base Percentage (OBP)6.
Second, better hit balls improve the hitting outcomes of batters; it increases the number of hits
and converts some hits into more valuable hits. This is tracked by Slugging Percentage (SLG)7.
Decreasing the batter’s chase rate impacts OBP by increasing the number of walks the Astros’
batters manage.
The league relationship between launch speed and OBP and SLG, the league relationship
between launch angle and OBP and SLG, and the league relationship between the chase rate and
OBP are estimated8 to convert launch and chase rate results into offensive production. This
provides the basis for translating the observed point estimates of the three factors into estimates
of how cheating increased the Astro’s production.
Given these league-wide relationships, each Astros batter’s OBP and SLG is corrected for the
scheme’s estimated benefit. The Astros’ batter’s OBP and SLG numbers are recalculated from
their observed 2017 levels by the weighted number of plate appearances during which bangs are
observed9. The resulting OBP and SLG numbers are aggregated to the team level. The estimates
suggest cheating increased the Astros’ team SLG by 5 points and their OBP by 1 point.
The league relationship between OBP and runs, and the relationship between SLG and runs was
estimated10. These relationships allow for an estimate of the number of runs the Astros should
have scored in the absence of the scheme. Table IV presents the observed runs, win percentage,
and wins compared to the recalculated runs, win percentage, and wins.
Table IV: Actual and Estimated (Lower Bound) Runs, Win Percentages, and Wins
Runs From
Scored Allowed Pythag W% Pythag W Pythag L
Scheme
Actual 896 - 700 62.1% 101 61
SLG Adjusted 882 14 700 61.4% 99 63
OBP Adjusted 892 4 700 61.9% 100 62
Total Adjusted 878 18 700 61.1% 99 63
The Pythagorean results estimate the Astros’ cheating scheme earned them 18 runs and won
them 2-3 regular-season games they would not have otherwise won.
6
On Base Percentage (OBP)=(walks+hit by pitches+hits)/plate appearances
7
Slugging Percentage (SLG)=Total Bases/At Bats or (Singles + Doubles + Triples + Home runs)/At Bats
8
These estimates are produced in Appendix A
9
This process is presented in Appendix A
10
Estimates presented in Appendix A.These are lower bound estimates as the only audible signal type considered is the banging of the
trash can. There is speculation that the team employed other types of audible signals such as
whistles, players shouting code words from the dugout, and even buzzers. Further, these
estimates only reflect cheating done at home. Teams did have access to live camera feeds when
playing at opponent venues. The Astros could have employed the same strategies in stadiums
where the typical centerfield camera facilitated seeing the catcher’s signals. Thus, estimates
accounting for cheating on the road and other signaling forms would yield larger results. Table V
presents three upper bound tests assuming the Astros employed the cheating scheme for the
entire season, all home games, and all home games after the scheme was employed in full force
on May 28th.
Table V: Actual and Estimated (Upper Bound) Runs, Win Percentage and Wins
Runs From
Scored Allowed Pythag W% Pythag W Pythag L
Scheme
Actual 896 - 700 62.1% 101 61
Full Season Adjusted 741 155 700 52.8% 86 76
Home Adjusted 819 77 700 57.7% 93 69
May 28th Adjusted 837 59 700 58.8% 95 67
These upper bound tests give a range of 6-15 games potentially won by the scheme.
4. Conclusion
The preliminary results demonstrate a significant and quantifiable effect of the Astros cheating
strategy. The Houston Astros developed and implemented an effective signal cheating strategy
during the 2017 season that led to better batting outcomes and more wins throughout the
season. Given this quantification of the cheating outcome, it is natural to wonder if Major
League Baseball should consider further penalties to Astros given their World Series title.
Further development of this project will use more sophisticated methods of estimation, such as
nearest-neighbor matching for plate appearance data, and measuring the benefit of the cheating
scheme on the performance of individual players, as a cursory evaluation of the data indicates
that individual batter outcomes are substantially higher when using the scheme. Nearest neighbor
matching could provide fruitful analysis following Dehejia and Wahba (2002). Further the data
could provide an empirical application for non-parametric quantile regression methods such as
those demonstrated in Atsalakis, Bouri, and Pasiouras (2020) and Wang, Zeng, and Liu
(2019).This trashy bang audible signal cheating scheme improved both team level and individual
performance for the Astros during the 2017 season, requiring further analysis and deeper
consideration than given by Major League Baseball.5. References Atsalakis, George S., Elie Bouri, and Fotios Pasiouras. "Natural disasters and economic growth: a quantile on quantile approach." Annals of Operations Research (2020): 1-27. Barna, Andrew G. (2019) "Stealing Signs: Could Baseball's Common Practice Lead to Liability for Corporate Espionage." Berkeley J. Ent. & Sports L. 8: 1. Becker, Gary S. (1968). "Crime and Punishment: An Economic Approach." Journal of Political Economy. 76, 169-217. Dehejia, Rajeev H., and Sadek Wahba. "Propensity score-matching methods for nonexperimental causal studies." Review of Economics and Statistics 84.1 (2002): 151-161. Duggan, Mark, and Steven D. Levitt. (2002). "Winning Isn't Everything: Corruption in Sumo Wrestling." American Economic Review. 92. 1594-1605. MLB.com. (2020, January 13). MLB completes Astros' investigation [Press release]. Retrieved from https://www.mlb.com/press-release/press-release-mlb-completes-astros-investigation Petti, Bill. baseballr. http://billpetti.github.io/baseballr/. Accessed February 2019. Rosenthal, Ken and Evan Drellich. “The Astros Stole Signs Electronically in 2017— part of a much broader issue for major league baseball” The Athletic Nov 12, 2019 Sawicki, Gregory S., Mont Hubbard, and William J. Stronge. (2003) "How to hit home runs: Optimum baseball bat swing parameters for maximum range trajectories." American Journal of Physics 71.11: 1152-1162. Wang, Shaojian, Jingyuan Zeng, and Xiaoping Liu. "Examining the multiple impacts of technological progress on CO2 emissions in China: a panel quantile regression approach." Renewable and Sustainable Energy Reviews 103 (2019): 140-150. Takeuchi, Takayuki, and Kimihiro Inomata. (2009) "Visual search strategies and decision making in baseball batting." Perceptual and Motor Skills 108.3: 971-980E. Tynes, Jarred R. (2006) "Performance enhancing substances: Effects, regulations, and the pervasive efforts to control doping in Major League Baseball.": 493-509.
Appendix A

To convert our point estimates of the scheme’s impact on players performance into the total
impact on the Astros seasons the following three step process is employed. These steps translate
the basic benefits of the cheating scheme, those on launch factors and chase rate, into common
measurements of player performance, and those into the amount of runs scored by the team,
which provides a basis for estimating the number of wins the cheating scheme would have
helped the Astros win. Figure 1 presents this process.
          1. Convert the point estimates on the Astros’ improved launch speed, launch angle, and
             chase rate into what the expected improvements in OBP and SLG would be via the
             estimated league wide relationship between these factors.
          2. Convert the estimated improvements in OBP and SLG into the expected
             improvements in runs.
          3. Convert the estimated improvement in runs into the expected improvement in wins
             via the Pythagorean Win formula.

Figure A1. How the cheating scheme impacted the Astros’ 2017 season results.

Step 1.
In step one we convert the point estimates of how the Astro’s player benefitted from the cheating
scheme in terms of launch speed, launch angle, and chase rate into measures of overall offensive
performance for players, namely on base percentage and slugging percentage.
To start we estimate the league wide relationship between launch speed, launch angle, and on
base percentage following equation A.1. We estimate the league wide relationship between
launch speed, launch angle, and slugging percentage following equation A.2. These estimates are
presented in Table A.I.
Chase rate impacts on base percentage is two ways. First, it increases the number of walks a
batter obtains by not swinging at strikes. Second, it improves the pitch count a batter faces for
future pitches which improves his odds to reach base via a hit. Thus, we estimate the league wide
relationship between walk rate and chase rate via equation A.3 and between hit rate and chase
rate via equation A.4. These estimates are presented in Table A.II.
,� = + �̃ ,� + ̃ ,� + ̃ ,� +� ,�
A.1
� ,� = �
+ �
�̃ ,� + � ̃ ,� + � ̃ ,� +� �
,�
A.2
� ,� = �
+ �
,� + � �,� A.3
ℎ ,� = ℎ
+ ℎ
,� + � ℎ,� A.4
Table A.I. Relationship between Launch Speed, and Launch Angle on OBP and SLG in the MLB for 2014-2016
OBP SLG
COEF SE COEF SE
Launch Speed 5.036*** 0.075 18.329*** 0.151
Launch Angle 2.498*** 0.047 6.382*** 0.081
Angle Squared -0.126*** 0.001 -0.159*** 0.002
Constant -34.030*** 6.848 -1,012*** 12.919
note: *** p̂ =�
̃ �=
+� �=
+ �= �=
+ A.5
�=
[ ] [ �̃ +̃ +̃ + + ℎ̃ ]
̂
� = �=
� �=
+ �=
�̃ �
+̃ �
+̃ �
+ � A.6
Where ̂ is the estimated On Base Percentage of Astros’ cheater adjusting for the benefit
of the audible signal. �̃ = � −� ̅ is the corrected Walk Rate for cheater . � is the
observed walk rate when there is an audible signal for cheater . � ̅ is the estimated benefit to
�=
the Walk Rate from the Astro’s cheating strategy from A.3. is the number of Plate
�=
Appearances for cheater that do no end with a ball in play given an audible signal. is
the number of Plate Appearances for cheater that do not end with a ball in play given no
�=
audible signal. is the number Balls in Play for cheater when no audible signal is
�=
observed. is the observed On Base Percentage for cheater when no audible signals are
�=
observed. is the number Balls in Play for cheater when bangs are observed. �̃ =
� − �̅ is the corrected launch speed of the cheating strategy for Astros cheater . � is the
observed launch speed of cheater when there is an audible signal. �̅ is the estimated benefit to
launch speed from Equation (1). is the league wide benefit to On Base Percentage from
launch speed. ̃ = ( − ̅ ) is the corrected launch angle for cheater . is the observed
̅
launch angle of cheater when there is an audible signal. is the estimated benefit to launch
angle from Equation (2). is the league wide benefit to On Base Percentage from launch
angle. Similarly, is the league wide benefit to On Base Percentage from launch angle
squared. �
is a constant from A.1. ℎ̃ = (ℎ − ℎ̅) is the corrected Hit Rate for cheater . ℎ
is the observed Hit Rate when there is an audible signal for cheater . ℎ̅ is the estimated benefit
to the Hit Rate from the Astro’s cheating strategy from A.4.
For Equation A.6, the Slugging Percentage is dependent on the estimates with similar definitions
to the launch speed angle variables. In this case � �= is the observed slugging rates for
cheater when there is no audible signal. In this case then, � , � , and � are the league
wide benefits to Slugging Percentage of launch speed, launch angle, and launch angle squared
respectively, while � is the constant from Equation A.2.
Step 2
Given the corrected On Base Percentage and Slugging Percentages for each Astro player we
want to estimate the number of runs the team should have scored in the absence of the scheme.
To this end, we first estimate the relationship between runs and On Base Percentage (equation
A.7) and Slugging Percentage (A.8) for the entire league. We then use these estimates in
conjunction with the corrected On Base Percentages and Slugging Percentages to estimate how
many runs the Astros should have scored via equation A.9., , ,
,� = + ,� +� ,�
A.7
, , � , �
,� = + � ,� +� ,�
A.8
, ∑ � ̂ , � ∑ ℓ ̂� A.9
= +
∑ � ∑ ℓ
Where, ,� is the number of runs scored by team f in season y, , and , � are the
estimated coefficients from A.7 and A.8. � and ℓ are the plate appearances and at bats of
cheater k respectively. Those are weighted by ̂ and ̂ � from A.5 and A.6, and summed
over all cheaters.
Table A.III. estimates the marginal impact of On Base Percentage (equation A.7) and Slugging
Percentage (A.8) for the league on Runs.
Equation A.9 calculates the numbers of runs the Astros should have scored given the corrected
OBP and SLG from equations A.5 and A.6. Notice that the corrected player OBP and SLG
results are weighted by the number of plate appearances and at bat the player has.
Table A.III. Relationship between On Base Percentage and Slugging Percentage on Run production in the MLB for 2006-2016.
A B
Runs COEF SE COEF SE
Scaled OBP 4.851*** 0.149
Scaled SLG 2.743*** 0.069
Constant -855.689*** 48.396 -402.506*** 28.455
note: *** pYou can also read