Study on the thermal properties and insulation resistance of epoxy resin modified by hexagonal boron nitride
←
→
Page content transcription
If your browser does not render page correctly, please read the page content below
e-Polymers 2021; 21: 681–690
Research Article
Lei Guo, Shilin Ding, Shuai Yuan, Xiaofeng Gou, Fenglin Cai, Dongyang Wang*, and
Haiquan Zhao
Study on the thermal properties and insulation
resistance of epoxy resin modified by hexagonal
boron nitride
https://doi.org/10.1515/epoly-2021-0069
received July 22, 2021; accepted August 10, 2021
1 Introduction
Abstract: To study the effect of doping hexagonal boron The oil immersed on-board traction transformer is the
nitride (h-BN) on the thermal properties and insulation heaviest single equipment in the traction system of high-
resistance of epoxy resin (EP) and the mechanism of this speed electric multiple units (EMUs) (1). Using a dry-type
effect, h-BN/epoxy composites with h-BN content of 0, on-board traction transformer instead of the current oil
10, 20, 30, and 40 phr were prepared. Meanwhile, the immersed on-board traction transformer can remove the
corresponding molecular dynamics model of h-BN/epoxy oil tank, insulating oil, and other parts of the oil immersed
composites was established, and the thermal conduc- transformer and achieve the goal of reducing the weight of
tivity, volume resistivity, glass transition temperature, the EMUs’ traction system. Epoxy resin (EP) has excellent
and microstructure parameters of h-BN/epoxy compo- insulation performance and chemical corrosion resistance.
sites were obtained. When the h-BN content is 40 phr, So it is widely used as an insulation material in the dry-
the thermal conductivity of h-BN/epoxy composite is type transformer (2,3). However, the thermal conductivity
increased by 138% compared to pure EP, and the glass of EP is low. Its thermal conductivity is mostly in the range
transition temperature is increased by 76 K. At the same of 0.17–0.21 W/(m·K), which greatly limits heat dissipation
time, doping h-BN will reduce the insulation perfor- from the dry-type transformer (4,5). The loss of dry-type
mance of EP. However, the lowest volume resistivity of
on-board traction transformer is higher than that of dry-
h-BN/epoxy composite is still 1.43 × 10¹⁵ Ω·cm, and the EP
type transformer with the same capacity, and the heat
composite still has good insulation performance. The
dissipation condition of dry-type on-board traction trans-
fraction free volume and mean square displacement of
former is worse due to the limitation of multiple unit train
EP decrease with the doping of h-BN, which indicates
space, among which the heat dissipation problem of winding
that h-BN can hinder the movement of molecular seg-
is particularly prominent. So higher requirements are put
ments of EP, which is the reason for the increase in glass
forward for the thermal conductivity of EP (6).
transition temperature.
The thermal conductivity of EP can be effectively
Keywords: epoxy resin, hexagonal boron nitride, thermal improved by doping inorganic nanofillers with high thermal
conductivity, glass transition temperature, volume resistivity conductivity (7,8). In the electrical industry, inorganic nano-
fillers with high thermal conductivity and good electrical
insulation performance such as boron nitride (BN), alu-
minum nitride, and alumina should be selected to meet
insulation requirements (9–13). Among them, hexagonal
boron nitride (h-BN) has high intrinsic thermal conductivity,
excellent insulation performance, excellent mechanical
properties, and high temperature resistance. So h-BN is
* Corresponding author: Dongyang Wang, School of Electrical very much suitable for improving the thermal conductivity
Engineering, Southwest Jiaotong University, Chengdu 611756,
of EP in dry-type on-board traction transformers (14).
China, e-mail: jiulingthebest@163.com
Lei Guo, Shilin Ding, Shuai Yuan, Xiaofeng Gou, Fenglin Cai,
In recent years, there is an increase in research
Haiquan Zhao: School of Electrical Engineering, Southwest Jiaotong on EP-modified. Wang et al. (15,16) showed that adding
University, Chengdu 611756, China cubic boron nitride and h-BN can improve the thermal
Open Access. © 2021 Lei Guo et al., published by De Gruyter. This work is licensed under the Creative Commons Attribution 4.0 International
License.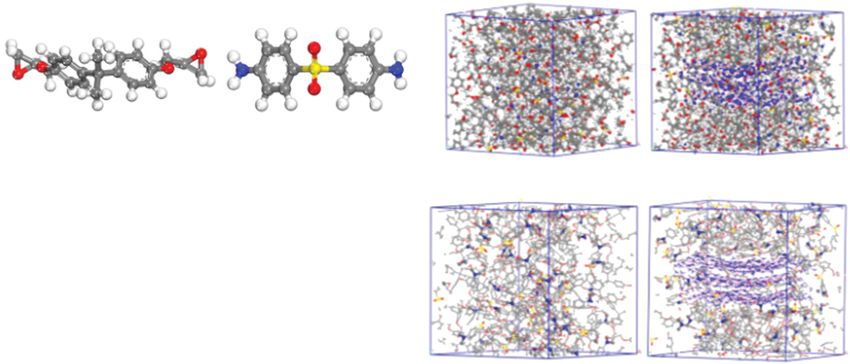
682 Lei Guo et al.
conductivity of EP, but adding agglomerated h-BN parti- in material microstructure parameters, establish the rela-
cles can improve the thermal conductivity better. How- tionship between micro and macro, so as to make a more
ever, the breakdown strength of BN/EP composite will reasonable explanation of the mechanism of interaction
decrease compared to EP. Martin et al. (17) found that between filler and matrix, and then explain the reasons
the surface treatment of BN with a high concentration of for the changes in macro properties. Therefore, a combina-
silane coupling agent can significantly improve the thermal tion of the experimental method and the molecular simu-
conductivity of BN/EP composites. The thermal conduc- lation method can comprehensively study the properties of
tivity of BN/EP composites can be further improved by materials.
about 30% by ball milling of BN. Zhang et al. (18) found To study the effect of doping h-BN on the thermal
that compared to h-BN, adding two-dimensional boron properties and insulation resistance of EP and to analyze
nitride nanosheets (BNNS) can further improve the thermal the mechanism of the effect, the h-BN/EP composites
conductivity of EP. When the content of BNNS is 25 vol%, with h-BN content of 0, 10, 20, 30, and 40 phr (phr means
the thermal conductivity of EP can be increased by 528%, one part of filler per 100 parts of EP by mass) were pre-
but the dielectric constant and dielectric loss will further pared, and the h-BN/EP composite model corresponding
increase compared to h-BN. The above research fully shows to h-BN content was established. The thermal conductivity
that adding h-BN can improve the thermal conductivity of and volume resistivity of h-BN/EP composites were mea-
EP, and the addition of h-BN will lead to a decrease in the sured by experiments. The glass transition temperature,
electrical insulation performance of EP. Articles in refs free volume, and MSD of h-BN/EP composites were calcu-
(19–21) explain that the formation of a heat conduction lated by MD simulation.
path of h-BN in the matrix is the reason for increasing
the thermal conductivity of the composites and enhancing
the dispersion of h-BN in the matrix, and that reducing the
interfacial thermal resistance between h-BN and the matrix 2 Materials and methods
can improve the thermal conductivity of composites. These
explanations are based on the results of macro experi-
2.1 Materials
ments, and not directly found through microstructure para-
meters. So the micro mechanism is not clear, and the rea-
EP: bisphenol A epoxy resin E51 (epoxy value 0.51 mol/100 g),
sons for the change in the macro-performance of EP caused
provided by Shanghai resin factory. Curing agent: 4,4′-diami-
by h-BN are not understood well. Therefore, the micro
nodiphenylsulfone (4,4′-DDS), provided by Shanghai resin
mechanism behind the effect of h-BN on the thermal pro-
factory. h-BN: micron hexagonal boron nitride, flake,
perties of EP needs to be studied further.
average diameter of 10 μm, provided by Henan Shenhua
With the development of computer technology, the
Chemical Co., Ltd.
molecular dynamics (MD) simulation method is widely
used to study the properties of materials (22). MD simula-
tion can not only calculate the macro properties of mate-
rials, such as thermal conductivity, mechanical proper- 2.2 Sample preparation
ties, glass transition temperature, and the coefficient of
thermal expansion, but also calculate the microstructure First, EP E51 and curing agent (85 wt% of EP mass) were
parameters such as free volume and mean square displa- mixed manually and stirred evenly, and then a certain
cement (MSD) of materials (23–25). Tang et al. (26) com- mass of h-BN (0–40 phr of epoxy mixed system) was
bined the experimental with molecular simulation method added into the mixture. After adding h-BN, the mixture
and found that the thermal stability of the insulation paper was ultrasonically dispersed at 30°C for 10 min. After
modified with polyphenylsilsesquioxane (PPSQ) was ultrasonic dispersion, the mixture was put into an 85°C
better than that of the insulation paper before modifica- oil bath and stirred by a high-speed disperser (300 rad/min)
tion. Furthermore, using the MD simulation method, it was for pre-curing for 50 min. Finally, the pre-cured EP mix-
found that PPSQ increased the free volume of the whole ture was poured into a preheated (85°C) mold, and the
system, which led to the more intensive molecular chain mixture was molded (pressure 5 MPa) and cured for 1 h in
bonding of the aramid fiber so that the thermal stability of a flat curing press. Then the composite samples were
the modified insulating paper was enhanced. MD simula- obtained by curing the mixture for 2 h at 120°C and
tion method can be very convenient to study the changes 160°C, respectively.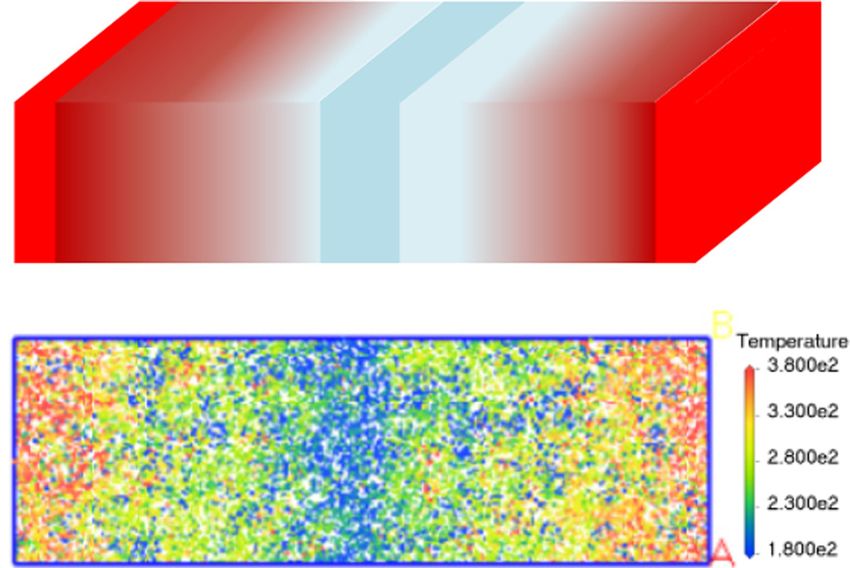
Thermal properties and insulation resistance of EP 683
2.3 Characterization of samples Ammeter
A
After the fracture surface was sprayed with gold, the mor- Protective electrode
phology of the fracture surface was observed by a scan-
ning electron microscope (SEM, quanta FEG 250; FEI Main electrode
Company, USA). Measured object Power Supply
Counter electrode
2.4 Thermal conductivity test
Figure 1: Principle of volume resistivity measurement.
The thermal conductivity of the samples was tested by
Hot-Disk TPS2200 thermal constant analyzer. The thermal
3 MD simulation
conductivity of samples at room temperature was tested by
the transient plane heat source method. The test standard 3.1 Establishment of the model
was ISO22007-2.
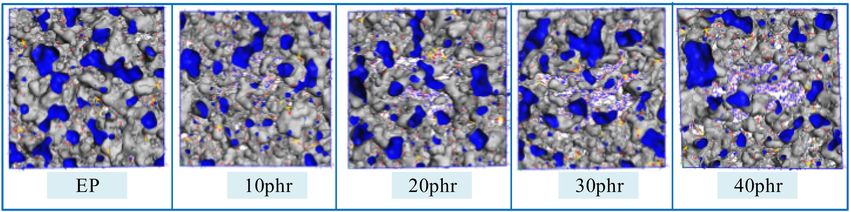
The pure crosslinked EP model and the h-BN/EP model
with different h-BN content were established, respec-
tively. Bisphenol A diglycidyl ether (DGEBA) was selected
2.5 Resistivity test as the EP matrix, and 4,4′-DDS was selected as the curing
agent (Figure 2a). Materials Studio 2017 was selected as
According to GB/T 1410-2006, an SM7120 high resistivity the molecular simulation software. The model building
meter was used to test the volume resistivity of the steps are as follows:
sample. The electrode used in the test had a three elec- (a) The DGEBA, 4,4′-DDS, and h-BN models were estab-
trode structure. The test voltage was 500 V and the lished, respectively. The initial EP model and the
ambient temperature was 20°C. The test sample was a h-BN/EP initial model with h-BN content of 10, 20,
circular sample with a diameter of 80 mm and a thickness 30, and 40 phr were established, respectively, by
of 1 mm. During the test, the sample was in close contact using the amorphous cell module. The parameters
with the electrode. of the initial model are shown in Table 1.
The volume resistivity can be calculated according to (b) Geometric optimization of the initial model (the max-
Eq. 1: imum number of iterations is 5,000 steps) is carried
out to reduce the energy of the model. The geometri-
πD1 2 R
ρv = × v (1) cally optimized model was first optimized at 200 ps
4t 10
under NPT (indicating that the system has a certain
where ρv is the volume resistivity, D1 is the diameter of number of particles (N), pressure (P), temperature
main electrode, which is 70 mm, t is the thickness of the (T)) ensemble, and the temperature was set at 600 K.
sample, which is 1 mm, and Rv is the volume resistance. Then, 200 ps kinetic optimization was carried out at
The volume resistance test platform is shown in 300 K under NVT ensemble, which means that the
Figure 1. At this time, the current flowing through the system has a certain number of particles (N), volume
surface of the measured object flows into the power (V), and temperature (T). The h-BN/EP model needs
supply inside the high resistance meter through the pro- to fix the h-BN before the above optimization, and
tective electrode, and the current flowing through the then the geometric optimization of the model and
volume direction of the measured object can be correctly the dynamic optimization of the NVT ensemble at
measured by the ammeter inside the high resistance 600 K and 200 ps are carried out, respectively. This
meter, so as to calculate the corresponding volume resis- step is to prevent deformation in the process of h-BN
tance value. Then the volume resistivity can be calculated optimization. Finally, the optimized model is shown in
by Eq. 1. The test time of volume resistivity is 5 min, and Figure 2b, which can be used for subsequent cross-
the value of volume resistivity is recorded every 1 s. linking reaction.
Finally, the median value is taken as the volume resis- (c) The crosslinking reaction process is as follows: The
tivity of the corresponding sample. crosslinking reaction process of EP is complex, but684 Lei Guo et al.
(a) (b)
DGEBA 4'4-DDS
Epoxy h-BN/EP
(c) (d)
R1 R2
A-CH-CH2+NH2-B A-CH-CH2-NH-B
O OH
A-CH-CH2-N-B
A-CH-CH2+A-CH-CH2-NH-B OH
N-B
OH
O OH
A-CH-CH2-N-B Epoxy h-BN/EP
Figure 2: (a) Molecular models of DGEBA and 4,4′-DDS. (b) Pure EP model and h-BN/EP model before crosslink. (c) Crosslink reaction
process of EP. (d) Pure EP model and h-BN/EP model after crosslink reaction.
Table 1: Structural parameters of the initial model To use the model after crosslink for the subsequent
parameter calculation, structural optimization and dynamic
Content of Atomic Cell dimension Density optimization are needed to eliminate the internal stress of
h-BN (phr) number (x × y × z) (Å) (g/cm3) the system. First, the geometry of the model was optimized,
0 5080 46.8 × 46.8 × 46.8 0.6 and then five cycles of anneal with a total time of 140 ps
10 4394 37.3 × 37.3 × 37.3 1.054 were carried out in the temperature range of 300–650 K.
20 4295 38.1 × 38.1 × 38.1 0.991 After cyclic annealing, the model with the lowest potential
30 4596 39.2 × 39.2 × 39.2 0.998
energy was selected to optimize the dynamics of 200 ps NPT
40 4981 40.2 × 40.2 × 40.2 1.025
ensemble at 600 K, and then 200 ps NVT ensemble at 300 K.
The final model was used for the subsequent molecular
the main reaction process has two steps (Figure 2c). simulation.
The first step is the reaction of the epoxy group of the
EP monomer molecule with the primary amine of
the curing agent molecule, and the second step is 3.2 Model verification based on thermal
the reaction of the secondary amine of the product conductivity
after the reaction of the epoxy group of the EP
monomer molecule with the primary amine of the In MD simulation, the reverse non-equilibrium MD (RNEMD)
curing agent molecule in the first step (27–29). The method is usually used to calculate the thermal conductivity
initial cutoff distance is 3.5 Å, the maximum cutoff of materials (27,30). According to the RNEMD method (31),
distance is 8 Å, the step size is 0.5 Å, the maximum the model is evenly divided into several layers (40 layers
crosslinking degree is 85%, and the crosslinking tem- in total are divided in this study) along a certain direction
perature is set at 300 K. Finally, the crosslinking (z direction is selected in this study). The outermost layer at
model with 80% crosslinking degree is obtained as both ends is called “hot layer,” and the two layers in the
shown in Figure 2d, which is used for subsequent middle are called “cold layers” (Figure 3a). By exchanging
performance calculation. the kinetic energy between the coldest particles in the hot
(d) The step length involved in the simulation process is layer and the hottest particles in the cold layer at each time
set to 1 fs, the pressure is set to 1 atm, the temperature interval Δt, the energy ΔE exchange is realized, and the
control method is selected Nose, and the pressure energy flux J is applied to the system:
control method is Berendsen. The force fields of EP
1 ΔE
model and h-BN/EP model are calculated by COMP- J= (2)
2A Δt
ASSII and Universal, respectively, and Ewald and
Atom based are selected, respectively, for static force where A is the area perpendicular to the flux direction and
and van der Waals force. the coefficient 2 is caused by periodic boundary conditions.Thermal properties and insulation resistance of EP 685
Hot layer Cold layer Hot layer segments. Macroscopically, it is the critical temperature
(a)
for the transition of polymer glass state and rubber state
(32,33). The mechanical properties, dielectric properties,
density, volume, and other parameters of the polymer will
1 2 3 Ă Ă 20 21 Ă Ă 38 39 40
change significantly before and after the glass transition
temperature. Therefore, it is important to study the effect
of changing the content of h-BN on the glass transition
(b) temperature of EP.
As the density of polymer will change obviously
before and after the glass transition temperature, the
glass transition temperature of EP and its composites
can be obtained by the curve of polymer density and
temperature. In MD calculation, the relationship between
material density and temperature is obtained by cooling
Figure 3: (a) Model diagram of RNEMD method. (b) The temperature the model. First, the model was heated to 600 K by 100 ps
distribution of the model along the z direction when the temperature in an NVT ensemble and by 150 ps in an NPT ensemble
gradient is stable.
at 600 K. Then, the model temperature was gradually
reduced to 260 K by 20 K/250 ps cooling rate. At each
After many times of energy exchange, a stable temperature
temperature, the MD of 100 ps in NVT ensemble and
gradient is formed in the system, as shown in Figure 3b. Then
150 ps in NPT ensemble were calculated.
the corresponding thermal conductivity can be calculated:
J
λ=− (3)
dT / dz
3.4 Free volume
where J is the energy flux, dT/dz is the temperature gra-
dient, and a negative sign indicates that the direction of According to the free volume theory, the volume of mate-
the energy flux is opposite to the gradient. rials includes the volume occupied by molecules (Vo) and
In the MD calculation, to better divide the layers, the the volume not occupied by molecules (Vf). The free
model is extended about three times along the direction of volume is dispersed in the materials in the form of
the partition layer (z direction). So it is necessary to estab- “holes,” providing space for the movement of molecular
lish a separate thermal conductivity calculation model. chains (34). The fractional free volume (FFV) and the free
The specific parameters of the model are shown in Table volume size of amorphous polymer materials affect the
2. During the simulation, the force field is universal, the properties of polymer materials, such as glass transition
temperature is set to 300 K, the time step is 1 fs, and the temperature. The FFV is calculated as follows:
time step of each kinetic energy exchange is 150.
Vf
FFV = × 100% (4)
Vo + Vf
3.3 Glass transition temperature
3.5 MSD
The glass transition temperature (Tg) of polymer is the tem-
perature that excites the movement of polymer molecular The atoms in the system are always in constant motion.
MSD refers to the average square displacement of parti-
Table 2: Structural parameters of thermal conductivity calculation model
cles in the system, which can be used to describe the
motion ability of molecular segments (35). In the system
Content of Atomic Cell dimension Density containing N particles, MSD is defined as:
h-BN (phr) number (x × y × z) (Å) (g/cm3) N −1
1
0 3598 23.2 × 23.2 × 71.5 1.188
MSD = ∑ (∣Ri(t ) − Ri(0)∣2 ) (5)
3N i=0
10 5107 26.7 × 28.0 × 73.6 1.193
20 4899 26.2 × 28.1 × 76.8 1.138 where Ri(t) and Ri(0) are the displacement vectors of
30 5189 26.1 × 27.8 × 83.2 1.156
any atom i in the system at time t and initial time,
40 5316 24.7 × 29.1 × 83.8 1.211
respectively.686 Lei Guo et al.
Figure 4: The SEM image of (a and b) EP and (c and d) h-BN/EP composite with 40 phr h-BN content.
4 Results and discussion average value, and the thermal conductivity of h-BN/EP
composite with different h-BN content is obtained, as
shown in Figure 5. The thermal conductivity of pure EP
4.1 Sample morphology
The SEM images of pure EP and h-BN/EP composite with
0.55
40 phr of h-BN filler are shown in Figure 4. It can be seen from
the figure that the cross section of pure EP is very smooth, and
Thermal conductivity/(W/(m·K))
0.50
the cross section becomes very rough after adding h-BN.
0.45
Further observation shows that, it can be seen that after
adding h-BN, even when the filler content reaches the max- 0.40
imum of 40 phr, h-BN can still be well dispersed in the EP
0.35
matrix without obvious agglomeration. h-BN fillers are stacked
in the EP matrix to form a thermal conduction path, which 0.30
helps to improve the thermal conductivity of the epoxy.
0.25
0.20
4.2 Thermal conductivity 0 10 20 30 40
The content of h-BN/phr
The thermal conductivity test results of five groups of
samples with the same h-BN content are taken as the Figure 5: Thermal conductivity of EP composites with different h-BN content.Thermal properties and insulation resistance of EP 687
is 0.2243 W/(m·K), and the thermal conductivity of com- Table 4: Volume resistivity of h-BN/EP composites with different
posites with h-BN filler content of 10, 20, 30, and 40 phr h-BN content
is 0.3035, 0.3772, 0.4134, and 0.5337 W/(m·K), respec-
tively. The thermal conductivity of the composite increases Content of h-BN (phr) Volume resistivity (Ω·cm)
by 35%, 68%, 84%, and 138%, respectively. With the 0 1.49 × 10¹⁷
increase of h-BN content, the thermal conductivity of the 10 4.39 × 10¹⁶
composite increases gradually. 20 3.01 × 10¹⁶
30 5.86 × 10¹⁵
When the content of h-BN is 40 phr, the thermal con-
40 1.43 × 10¹⁵
ductivity of the composites is greatly improved. The main
reason is that when the content of h-BN is less, h-BN does
not fully form a thermal conduction path in the EP by an order of magnitude, and the volume resistivity of
matrix. However, the thermal conductivity of the EP com- h-BN/EP composite is 5.86 × 10¹⁵ Ω·cm. When the h-BN
posites is slightly improved due to the high thermal con- content is 40 phr, the volume resistivity of the composite
ductivity of h-BN itself. When the content of h-BN reaches decreases to 1.43 × 10¹⁵ Ω·cm. Compared with pure EP, the
40 phr, h-BN forms a thermal conduction path in the EP, volume resistivity of h-BN/EP composite is still very high,
which can further improve the thermal conductivity of and h-BN/EP composite still has good electrical insulation
the EP so that the thermal conductivity of the composite properties.
is greatly improved.
The thermal conductivity obtained by MD method is
compared with the experimental results, as shown in
Table 3. It can be seen from the results that under the 4.4 Glass transition temperature
same h-BN content, the simulation results are basically
the same as the experimental results, and the error is The density of the model corresponding to 18 temperature
small, which indicates that the MD simulation results points is obtained. When the relationship between den-
are reliable. sity and temperature is drawn in a two-dimensional coor-
dinate axis, an obvious decomposition inflection point
can be found in the data points. By fitting the data points
before and after the inflection point linearly, two different
4.3 Volume resistivity density and temperature curves before and after the
glass transition temperature can be obtained. Tg is the
The volume resistivity test results are shown in Table 4, temperature corresponding to the intersection of the two
and the volume resistivity of h-BN/EP composite changes curves, as shown in Figure 7.
with h-BN content is shown in Figure 6. It can be seen
from Figure 6 that with the increase of h-BN content, the 200
volume resistivity of h-BN/EP composite decreases gra-
dually. When the content of h-BN in EP is large, the
Volume resistivity/(1015Ω‧cm)
decreasing trend of the volume resistivity of h-BN/EP 150
composites becomes slow. The volume resistivity of pure
EP is 1.49 × 10¹⁷ Ω·cm. When the amount of h-BN reaches
100
30 phr, the volume resistivity of the composite decreases
50
Table 3: Simulation and experimental value of thermal conductivity
Content of Simulation value Experimental value
0
h-BN (phr) (W/(m·K)) (W/(m·K))
0 0.2192 0.2243
0 10 20 30 40
10 0.2992 0.3035
20 0.3799 0.3772 The content of h-BN/phr
30 0.4263 0.4134
Figure 6: Volume resistivity of EP composites with different h-BN
40 0.5508 0.5337
content.688 Lei Guo et al.
1.26 Table 5: h-BN/EP composite FFV with different h-BN content
EP
10phr
1.24 486K 20phr Content of h-BN (phr) Vo (Å3) Vf (Å3) FFV (%)
1.22 30phr
40phr 0 42321.58 11251.06 21.00
1.20
Density/(g/cm3)
10 37796.84 8122.13 17.69
451K 476K 20 37334.62 7589.98 16.89
1.18
30 40599.37 7603.28 15.77
1.16 430K
40 43682.61 7794.24 15.14
1.14
1.12 410K
different h-BN content is obtained. As shown in Figure 8,
1.10
the free volume distribution of the system is shown in
1.08
different h-BN content. The blue part in the figure repre-
250 300 350 400 450 500 550 600 650 sents the free volume, while the gray part is the free
Temperature/K volume surface. It can be seen from the figure that when
the content of h-BN is low, the free volume distribution is
Figure 7: Tg fitting results of EP composites with different h-BN
scattered. With the increase of h-BN content, the free
content.
volume distribution area gradually began to gather, and
the dispersion became worse. This indicates that h-BN can
The Tg of pure EP is 410 K, while the Tg of h-BN/EP hinder the molecular chain movement of EP.
composites with h-BN content of 10, 20, 30, and 40 phr is The corresponding FFV (Table 5) can be obtained by
430, 451, 476, and 486 K, respectively. With the increase Eq. 4. It can be seen from the table that the FFV of pure EP
of h-BN content, the glass transition temperature of EP is 21%. With the increase of h-BN content, the FFV of
composites increases gradually. When the content of h-BN/EP composite decreases gradually. This is mainly
h-BN is 40 phr, the glass transition temperature of EP because with the addition of h-BN, h-BN occupies part of
composites is 76 K higher than that of pure EP. The the free volume of the original EP, resulting in the
main reason is that the addition of h-BN will hinder the decrease of FFV of the composite. On the other hand,
movement of molecular segments of EP, and the more the decrease of FFV indicates that the movement of mole-
obvious blocking effect is with the increase of h-BN con- cular segments in h-BN/EP composites is weakened, that
tent so that higher is the temperature needed to stimulate is, the addition of h-BN will hinder the motion of mole-
the movement of molecular segments, resulting in the cular segments in EP, and the greater the content of
increase of Tg of EP. h-BN, the stronger the hindrance.
4.5 Free volume 4.6 MSD
The free volume is calculated by the scanning probe method. The optimized h-BN/EP composite model with different
The probe radius is set to 1 Å by creating Connolly surface h-BN content was simulated again under the NPT ensemble
and the free volume of h-BN/EP composite model with of 50 ps, and the structure was output every 1 ps. The MSD
Figure 8: Free volume distribution of different model.Thermal properties and insulation resistance of EP 689
higher the content of h-BN, the stronger the blocking
3.0 0phr effect. This is also the reason for the increase of glass
10phr
20phr transition temperature of h-BN/EP composites.
2.5
30phr
40phr
2.0 Funding information: This project was supported by
National Natural Science Foundation of China (U1834203),
MSD/(Å2)
1.5 Sichuan Science and Technology Program (Youth Science
and Technology Innovation Research Team Project)
1.0 (2020JDTD0009).
0.5 Author contributions: Shilin Ding and Shuai Yuan: designed
and performed the experiments; Shilin Ding and Shuai
0.0
Yuan: data curation, formal analysis; Shilin Ding and
0 10 20 30 40 50 Xiaofeng Gou: writing – original draft; Dongyang Wang
Time/(ps) and Fenglin Cai: writing – review and editing; Lei Guo
and Haiquan Zhao: funding acquisition. All authors have
Figure 9: EP composite MSD with different h-BN content. read and agreed to the published version of the manuscript.
curves of h-BN/EP composite model with different h-BN Conflict of interest: Authors state no conflict of interest.
content were obtained by MSD analysis of the final 50-frame
structure, as shown in Figure 9. It can be seen from the Data availability statement: The data presented in this
figure that with the increase of h-BN content, the MSD value study are available on request from the corresponding
of h-BN/EP composite decreases, indicating that the addi- author.
tion of h-BN will inhibit the movement of EP molecular
segments, and the higher the content of h-BN, the stronger
the inhibition.
References
5 Conclusion (1) Ronanki D, Singh SA, Williamson SS. Comprehensive topolo-
gical overview of rolling stock architectures and recent trends
in electric railway traction systems. IEEE Trans Transp Electr.
In this study, the effects of h-BN on the properties of EP
2017;3:1–1.
were studied by experiments and MD simulation, and the
(2) Wang L, Gao W, Zhang X, Xu S, Ren S, Guo J. Preparation and
conclusions are as follows: performance of high thermal conductive epoxy resin compo-
(1) The addition of h-BN can improve the thermal con- site insulating materials. Insulat Mater. 2021;54(2):20–6.
ductivity of EP. The higher the content of h-BN, the (3) Wang Y, Liu Y, Wang S, Xu H. The effect of electrothermal aging
greater the improvement in thermal conductivity. When on the properties of epoxy resin in dry-type transformer. Trans
China Electrotech Soc. 2018;33(16):3906–16.
the content of h-BN is 40 phr, the thermal conductivity
(4) Lin Y, Huang X, Chen J, Jiang P. Epoxy thermoset resins with
of h-BN/EP composite reaches 0.5337 W/(m·K). high pristine thermal conductivity. High Volt.
(2) The addition of h-BN can increase the glass transition 2017;2(3):139–46.
temperature of EP. When the h-BN content is 40 phr, (5) Wang Y, Wang S, Huang Y, Yi L, Cai Y. Study on thermal aging
the glass transition temperature is 486 K, which is characteristics of epoxy resin of dry-type transformer. High
Volt Eng. 2018;44(1):187–94.
76 K higher than that of pure EP.
(6) Guo L, Ding S, Yuan S, Gou X, Wang L, Zhou L. Molecular
(3) Adding h-BN can not only improve the thermal pro-
dynamics simulation of thermo-mechanical properties of
perties of EP but also reduce its insulation resistance. hexagonal boron nitride/epoxy resin composites. High Volt
When the content of h-BN is 40 phr, the volume resis- Eng. July 2021. Epub ahead of print 2. doi: 10.13336/j.1003-
tivity of h-BN/EP composite is about 2 orders of mag- 6520.hve.20201456.
nitude lower than that of pure EP, but it is still as (7) Jiang P, Chen J, Huang X. Research status of thermally con-
ductive but electrically insulating polymer nanocomposites.
high as 1.43 × 10¹⁵ Ω·cm. Therefore, the EP composite
High Volt Eng. 2017;43(9):2791–9.
still has good insulation performance. (8) Du B, Kong X, Xiao M, Li J, Qian Z. Advances in thermal per-
(4) With the increase of h-BN content, the FFV of EP will formance of polymer-based composites. Trans China
decrease, and the MSD value will also decrease. The Electrotechnical Soc. 2018;33(14):3149–59.690 Lei Guo et al.
(9) Huang X, Jiang P, Tanaka T. A review of dielectric polymer (23) Zhang X, Chen X, Xiao S, Wen H, Wu J. Molecular dynamics
composites with high thermal conductivity. IEEE Electr Insul M. simulation of thermal-mechanical properties of modified SiO2
2011;27:8–16. reinforced epoxy resin. High Volt Eng. 2018;44(3):740–9.
(10) Meng X, Du B. Review of high thermal conductivity polymer (24) Xie Q, Duan Q, Zhang L, Zhao Y, Lu L, Huang Z. Molecular
dielectrics for electrical insulation. High Volt. 2016;1(1):34–42. dynamics simulation of the influence of nano-SiO2 filling on
(11) Ma A, Chen W, Hou Y, Zhang G. The preparation and cure thermo-mechanical properties of highly cross-linked epoxy
kinetics researches of thermal conductivity epoxy/AlN com- resin. High Volt Eng. 2020;46(05):1596–605.
posites. Polym-Plast Technol. 2010;49(4):354–8. (25) Wen H, Zhang X, Wu Y, Yang Z. Molecular dynamics simulation
(12) Sun J, Wang D, Yao Y, Zeng X, Pan G, Huang Y, et al. Boron of SrTiO3/epoxy resin composites with different filling pro-
nitride microsphere/epoxy composites with enhanced thermal portions. Insulat Mater. 2019;52(8):16–23.
conductivity. High Volt. 2017;2(3):147–53. (26) Tang C, Zheng W, Wang L, Xie J. Thermal stability of polypheny-
(13) Wang Q, Li Z, Yin Y, Wu J. Thermal conductivity and breakdown lsilsesquioxane-modified meta-aramid insulation paper. High
strength study of micro/nano-alumina/epoxy resin composite. Volt. 2020;5(3):264–9.
Insulat Mater. 2013;46(2):49–52. (27) Liu X, Rao Z. A molecular dynamics study on heat conduction
(14) Lin Z, Yan Q, Dai W, Lv L, Tan X. Research progress on hexa- of crosslinked epoxy resin based thermal interface
gonal boron nitride-based thermal conductive composites. materials for thermal management. Comp Mater Sci.
J Integr Technol. 2019;8(01):24–37. 2020;172:109298.
(15) Wang Z, Iizuka T, Kozako M, Tanaka T. Development of epoxy/ (28) Shenogina NB, Tsige M, Patnaik SS, Mukhopadhyay SM.
BN composites with high thermal conductivity and sufficient Molecular modeling approach to prediction of thermo-
dielectric breakdown strength part I- sample preparations mechanical behavior of thermoset polymer networks.
and thermal conductivity. IEEE Trans Dielect El In. Macromolecules. 2012;45(12):5307–15.
2011;18(6):1963–72. (29) Wang Z, Lv Q, Chen S, Li C, Sun S, Hu S. Glass transition
(16) Wang Z, Iizuka T, Kozako M, Tanaka T. Development of epoxy/ investigations on highly crosslinked epoxy resins by molecular
BN composites with high thermal conductivity and sufficient dynamics simulations. Mol Simulat. 2015;41(18):1515–27.
dielectric breakdown strength part II-breakdown strength. (30) Liu X, Rao Z. Molecular dynamics simulations on the heat and
IEEE Trans Dielect El In. 2011;18(6):1973–83. mass transfer of hypercrosslinked shell structure of phase
(17) Martin D, Spiros T, Emmanuel L. Boron nitride filled epoxy with change nanocapsules as thermal energy storage materials.
improved thermal conductivity and dielectric breakdown Int J Heat Mass Tran. 2019;132:362–74.
strength. Compos Sci Technol. 2015;110:152–8. (31) Müller-Plathe F. A simple nonequilibrium molecular dynamics
(18) Zhang X, Hu G, Wu Y, Tang J. Study on the thermal and method for calculating the thermal conductivity. J Chem Phys.
dielectric properties of epoxy resin modified by boron nitride 1997;106(14):6082–5.
nanosheets. High Volt Eng. 2021;47(2):645–51. (32) Fu K, Xie Q, Zhang L, Lv F, Zhao Y, Huang Z. Molecular
(19) Liu L, Shen S, Wang Y. Enhanced thermal conductivity of dynamics simulation of thermomechanical properties of
flexible h-BN/polyimide composites films with ethyl cellulose. DGEBA/DCPDE double-crosslinked epoxy resin. High Volt Eng.
e-Polymers. 2019;9(1):305–12. 2019;45(9):2722–31.
(20) Wu X, Liu W, Ren L, Zhang C. Highly thermally conductive (33) Xie Q, Fu K, Liang S, Liu B, Lu L. Micro-structure and thermo-
boron nitride @UHMWPE composites with segregated struc- mechanical properties of crosslinked epoxy composite modi-
ture. e-Polymers. 2020;20(1):510–8. fied by nano-SiO₂: a molecular dynamics simulation.
(21) Randhawa K, Patel A. Enhancing tribo-mechanical properties Polymers. 2018;10(7):801–17.
and thermal stability of nylon 6 by hexagonal boron nitride (34) Bondi A. Free volumes and free rotation in simple liquids and
fillers. e-Polymers. 2020;20(1):733–45. liquid saturated hydrocarbons. J Phys Chem.
(22) Li Q, Huang X, Liu T, Ni J, Wang Z, Zhang Y, et al. Application 1954;58(11):929–39.
progresses of molecular simulation methodology in the area (35) Yin F, Tang C, Li X, Wang X. Effect of moisture on mechanical
of high volt insulation. Trans China Electrotechn Soc. properties and thermal stability of meta-aramid fiber used in
2016;31(12):1–13. insulating paper. Polymers. 2017;9(10):537–51.You can also read