Subtidal Ecological Survey Noises Islands
←
→
Page content transcription
If your browser does not render page correctly, please read the page content below

Subtidal Ecological Survey Noises Islands

                                            i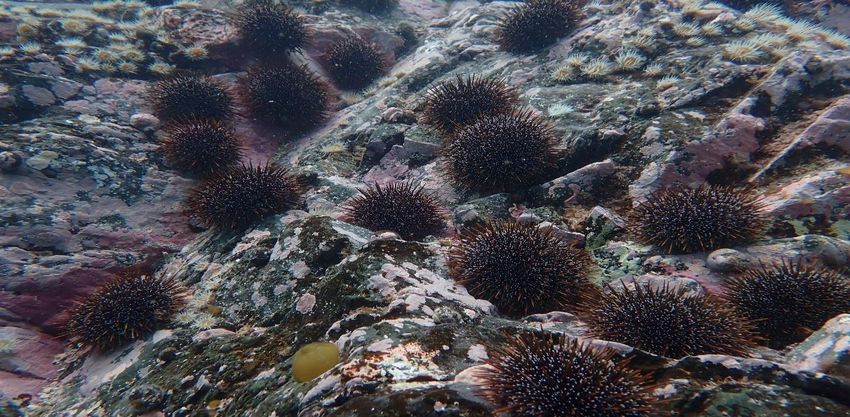
Subtidal Ecological Survey Noises Islands

 Prepared for: The Noises Marine Protection and Restoration Project Team (The Noises
      Trust, Tāmaki Paenga Hira Auckland Museum and University of Auckland)

                                              Report Status

 Version                     Date                       Status                      Approved
                                                                                    By:
 V1                          31 July 2021               Draft V.1                   STM
 V2                          26 August 2021             Final

It is the responsibility of the reader to verify the currency of the version number of this report.

                                          Tim Haggitt PhD1,2

                         1-Institute of Marine Science – University of Auckland
                               2- eCoast – Marine Research and Consulting

                                                                                                      ii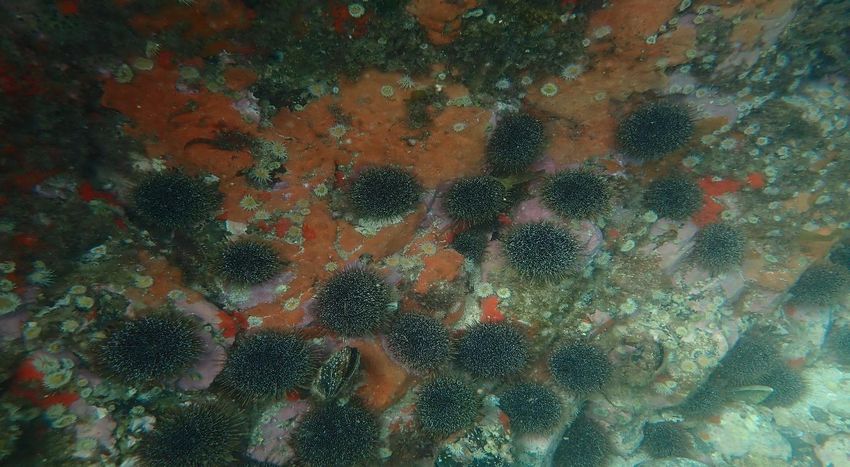
Executive summary

  •   A subtidal biological survey of rocky reef benthic habitats and dominant species
      was undertaken at eight sites across the Noises Islands in autumn 2021. Soft
      sediment sampling was also undertaken along the south-west coastline of Ōtata
      island to quantify tipa/scallop abundance.

  •   Rocky reef habitats were brown macroalgal and urchin (kina)-grazed barrens
      dominated, with the distribution and abundance of species and benthic habitats
      highly variable across sites and depth strata.

  •   In addition to brown macroalgal habitat, the Noises Islands group comprises an
      array of biogenic habitats and high diversity areas spanning multiple depth strata.
      Key examples include anemone beds, subtidal kūtai/green-lipped mussel beds,
      rhodolith beds, and sessile invertebrate communities dominated by large sponges.

  •   For the majority of sites surveyed there were clear impacts associated with
      sediment deposition, whereas expansive areas of urchin barrens habitat remain
      indicative of an absence of large predators such as tāmure/snapper and
      koura/lobster that would otherwise control kina (Evechinus chloroticus) densities
      and grazing activity.

  •   Reef fish biodiversity was low to moderate, but consistent with assemblage
      compositions recorded for the inner-Hauraki Gulf elsewhere (e.g., Long Bay,
      Waiheke Island, Rakino Island). Commonly, targeted species such as
      tāmure/snapper, kahawai, red moki, and butterfish were observed during the
      survey. For both tāmure/snapper and red moki, the majority of fish censused
      were sub-legal.

  •   Despite complex rocky reef habitat being present at several sites, very low
      numbers of kōura /spiny rock lobster (Jasus edwardsii) were recorded (< 0.25
      individuals 500 m-2).

  •   Tipa/scallop abundance was estimated to be 23.0 scallops (± 5.5 SE) 100 m-2,
      which equates to very- ow abundance. Legal-sized individuals occurred at an
      average density of 3.1 (± 1.3 SE) 100 m-2.

  •   However, data now exist that can serve as a platform for further information
      gathering and to monitor future environmental change across the Noises Islands
      group. This will be especially important in the context of any marine protection
      and habitat restoration initiatives that may take place. It is also anticipated that
      the data will be used for a range of educational and outreach activities that have a
      common goal towards whole system thinking around concepts of regeneration,
      restoration, and protection.

                                                                                        iii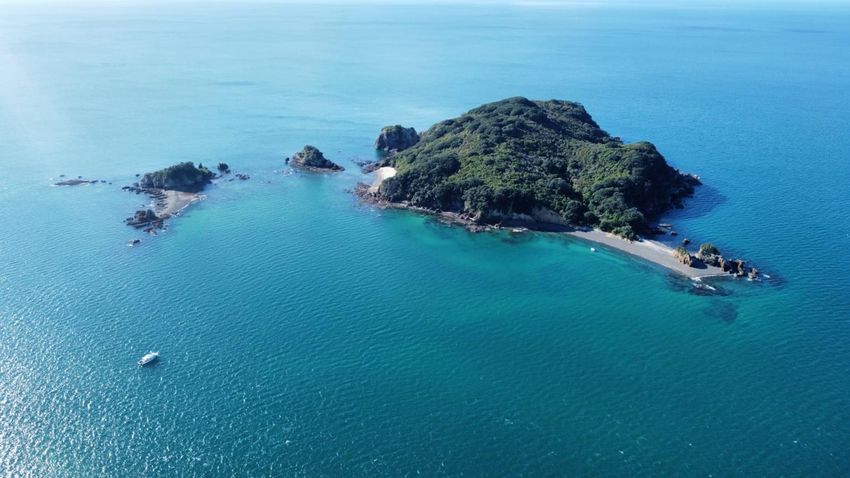
Table of Contents

Executive summary ...................................................................................................................................... iii
1.0 Preamble .................................................................................................................................................... 5
2.0        Methods ................................................................................................................................................ 8
   2.1         Rocky reef benthic sampling .................................................................................................... 8
   2.2         Reef fish abundance and diversity ....................................................................................... 11
   2.3         Kōura/Lobster abundance ...................................................................................................... 11
   2.4         Tipa/scallop and hururoa/horse mussel abundance ................................................... 11
   2.5         Data analysis................................................................................................................................. 12
3.0        Results ................................................................................................................................................. 13
   3.1         Habitat distributions ................................................................................................................. 13
   3.2         Rimurimu/Macroalgal habitat............................................................................................... 17
   3.2         Sessile invertebrates ................................................................................................................. 25
   3.3         Mobile invertebrates ................................................................................................................. 29
   3.4         Reef fish .......................................................................................................................................... 34
   3.5         Kōura/Lobster ............................................................................................................................. 39
   3.6         Soft sediment bivalves .............................................................................................................. 39
4.0        Discussion .......................................................................................................................................... 42
   4.1         General findings - biological habitat and species distribution ................................. 42
   4.2         Where to from here? ................................................................................................................. 48
5.0        References ......................................................................................................................................... 51
Appendix One ................................................................................................................................................ 54
Appendix Two ............................................................................................................................................... 54
Appendix Three ............................................................................................................................................ 57
Appendix Four ............................................................................................................................................... 61

                                                                                                                                                                     4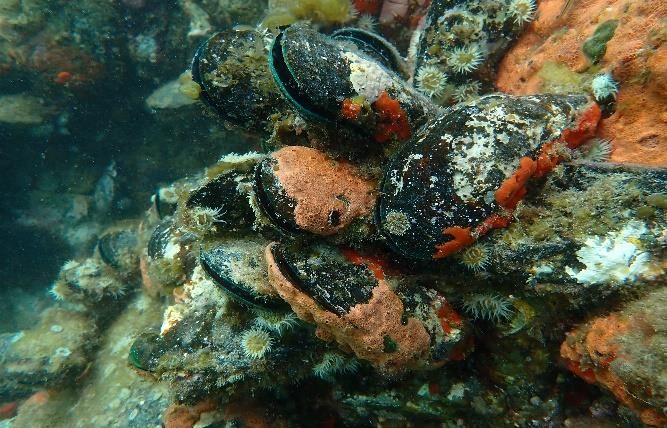
1.0 Preamble

This report details the main findings from a subtidal ecological baseline survey of select
sites encompassing the Noises Island Group within the central Hauraki Gulf/Tikapa
Moana/Te Moananui ā Toi. Specific aims of the survey were to: 1) quantify the
distribution of main habitat types and the size and abundance of dominant rocky reef
organisms (macroalgae, mobile and sessile invertebrates, reef fish and rock lobster) and,
2) evaluate qualitatively the densities of tipa/scallops and hururoa/horse mussels within
a discrete bed.

The Noises Islands is comprised of four main islands – Ōtata, Motuhoropapa,
Maria/Ruapuke and the David Rocks - that are all pest free. Additional smaller islands
include Orarapa (Haystack), Ike, Scott, and Sunday, with a range of rocky pinnacles such
as the Ahaaha’s Tern Rock and, Zeno Reef constituting the group. Its pest free status is
nationally significant, with Maria Island being New Zealand’s first pest free Island. The
Noises Island Group has been privately owned since the 1930’s by the Neureuter family
(refer to noises.co.nz for detailed history).

Historically, the Islands have been considered “islands of abundance” due to their
ecological diversity and functioning. Significant effort has gone into pest-eradication,
native species introductions and weed control. Collectively, these efforts have resulted
in substantial ecological gains that have seen the translocation of critically threatened
species such as wētāpunga (Deinacrida heteracantha) and more recently the Duvaucel’s
gecko (Hoplodactylus duvaucelii). However, over the last decade the Neureuter family
has voiced their concern around the declining sate of the marine ecosystem – both
intertidal and subtidal realms. Key observations have included:

   •   Reduced intertidal abundance and diversity of sessile and mobile invertebrates in
       particular crabs, pāua, mussels, and seaweeds;
   •   Lack of beach-cast seaweed through space and time;
   •   Reduction in several seabird species such as blue penguins/korora (Eudyptula
       minor); white fronted terns (Sterna striata); Tara / Larus novaehollandiae - Tara-
       punga / red-billed gull/tarāpunga (Chroicocephalus novaehollandiae); black-
       backed gull/karoro (Larus dominicanus); and, total loss of pārekareka/spotted
       shag (Phalacrocorax punctatus).
   •   Reduction in subtidal rocky reef macroalgal diversity/abundance and increase in
       urchin barrens spatial extent;
   •   Reduction in reef fish diversity;
   •   Collapse of kōura lobster populations;
   •   Reduction in intertidal and subtidal mussel reefs;
   •   Reduction in intertidal seaweed spatial extent and invertebrates (e.g., rock crabs);
   •   Increase in sediment deposition on rocky reef habitats in tandem with elevated
       turbidity;
   •   Reduction in tipa/scallop and hururoa/horse mussel distribution and abundance
       adjacent Ōtata and Motuhoropapa Islands. Changes consistent with harvest
       pressure, dredging, and anchoring;

                                                                                         5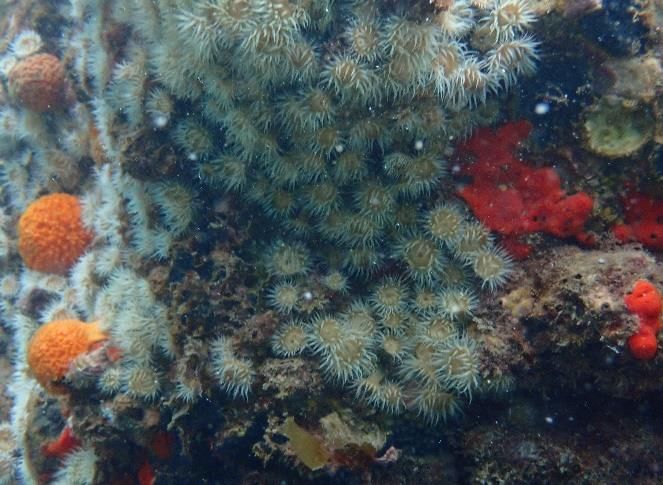
•   Presence of benthic algal blooms in warmer oceanographic periods consistent
       with Ostreopsis siemensis (Shears and Ross, 2009, 2010); and
   •   Accelerating erosion of areas of intertidal mudstone, e.g., south-western coastline
       Ōtata.

Many of these observations and findings are not Noises Islands-centric and match similar
reports from nearby Rakino and Waiheke Islands and fits within the wider reported
degraded state of the Hauraki Gulf/Tikapa Moana/Te Moananui ā Toi., i.e., declining
environmental state, which is rapidly occurring and, in some cases, irreversible. (Hauraki
Gulf Forum, 2020). Impacts and threats to the Gulf range from highly localised (dredging,
point-source pollution) to more broad-scale, (sedimentation, and those associated with
climate and ocean change). The State of our Gulf 2020 report (Hauraki Gulf Forum 2020)
lists the top five impacts to the Gulf as being climate change, ocean acidification,
sedimentation, fishing, and pollution. Conceivably, the latter three can be controlled and
managed using existing legislative frameworks; however, the State of our Gulf 2020
report acknowledges that the current weighting is tipped too far toward development
and resource utilisation.

Based on personal concern and well-founded insight, the Neureuter family have
spearheaded engagement with iwi and other stakeholders around whole-ecosystem
thinking and identifying mechanisms for protection and restoration for the Noises Islands
marine environment - with a guiding kaupapa of achieving better environmental and
conservation-related outcomes. Ultimately, in doing so, an improved marine
environmental state and functionality would undoubtedly translate to an improved
terrestrial environmental state and functionality – acknowledging that the two are
unequivocally intwined.

The Noises Islands group has had a long history of scientific study and endeavour and
while the terrestrial realm has undoubtedly received the most attention a range of studies
have also encompassed the marine environment as summarised in (Table 1.1). However,
despite these, there remains very little quantitative baseline information from which to
evaluate environmental change.

In 2019, the Neureuter’s hopes for restoring the marine ecosystem received a major
boost with the formation of The Noises Marine Restoration Project, a partnership
between the family trust, Tāmaki Paenga Hira Auckland War Memorial Museum, and
the University of Auckland. The partnership was formed in part thanks to a Gulf
Innovation Fund Together (GIFT) grant from Foundation North, with the Auckland
Museum and University of Auckland providing their time in-kind.

This current survey aims to build on the 2017 qualitative habitat survey undertaken by
Haggitt and Shears (2017); primarily through collection of quantitative information on
benthic rocky reef habitats and the abundance of key species at a range of rocky reef sites
representative of the Noises Islands group. Key aspects of the sampling include:

   •   Collection of data on the abundance(s) and depth-distribution of key benthic
       organisms per unit area including the percent cover of physical variables such as
       fine sediment per unit area;
   •   Begin to spatially map subtidal, green-lipped mussel habitat at select locations;

                                                                                         6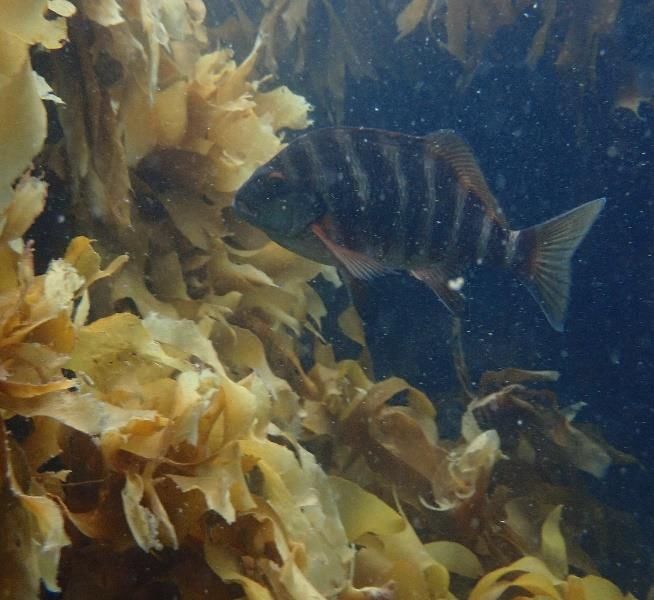
•   Repeat reef fish underwater visual census (UVC) at sites surveyed in 2017;
   •   Evaluate koura/lobster size and abundance at sites surveyed in 2017; and,
   •   Evaluate subtidal scallop density of Ōtata Island’s south-western coastline.

It is anticipated that the collection of the above data will:

   •   Build upon the existing benthic habitat and reef-fish datasets for the Noises
       Islands;
   •   Allow for comparisons to be made to other locations (Waiheke Island, Rakino
       Island, Long Bay, Leigh, Tawharanui, and Te Whanganui-a-Heī);
   •   Support and compliment other research being done by the Auckland War
       Memorial Museum and the University of Auckland associated with the Noises
       Islands.
   •   Help contribute to the “voice of Ōtata” and Mātauranga Māori approach to
       ecosystem management and thinking.

Table 1.1. Summary of key marine related intertidal and subtidal research studies
(incomplete) that have involved the Noises Islands. Note there is significant seabird
research past and present that is being undertaken by Auckland War Memorial Museum
and Auckland Council not reported here.

 Study details                                           Researcher(s)
 Spatial predictive modelling - invertebrate diversity   Franz Smith (2004; 2006)
 and assemblage structure Hauraki Gulf/Tikapa
 Moana/Te Moananui ā Toi, includes Noises Islands.
 Soft sediment benthic surveys quantifying benthic       Severine Dewas, Steve O’Shea (2008-
 diversity and dog cockle (Tucetona laticostata)         2011), Auckland University of Technology
 abundance biogenic structure.
 Intertidal seaweed species observations.               Mike Wilcox. Auckland Botanical Society
                                                        (2008)
 Ecklonia radiata removals, photosynthetic and net Catlin Blain, Nick Shears – University of
 primary production studies                             Auckland (2016)
 2017 subtidal habitat and reef fish survey             Nick Shears Tim Haggitt University of
                                                        Auckland/eCoast (2017)
 Intertidal sampling 2019– Ōtata Island                 Tim Haggitt University of Auckland/eCoast
                                                        - ongoing
 Underwater soundscapes – impacts of boat noise. – Louise Wilson, Craig Radford – University
 Noises included as part of a wider Hauraki Gulf/ of Auckland - current
 Tikapa Moana/Te Moananui ā Toi study
 Kina removal Ōtata Island – Noises included as part of Kelsey Miller, Nick Shears – University of
 a wider Hauraki Gulf/Tikapa Moana/Te Moananui ā Auckland - current
 Toi study
 Archaeological work - Ōtata Island midden analysis.    Dr. Louise Furey, Emma Ash – Auckland
                                                        War Memorial Museum; Ngāi Tai ki
                                                        Tāmaki - current

                                                                                             7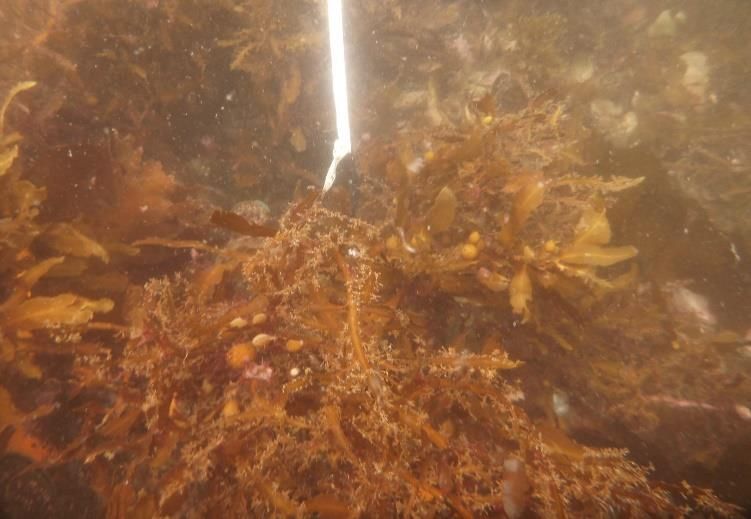
2.0    Methods

The following survey methodology pertains to subtidal rocky reef and soft sediment sampling
undertaken over March-May, 2021 (Austral autumn). Key components of the sampling
included depth-stratified benthic, kōura/lobster, reef-fish, and scallop sampling utilising
SCUBA. All work was be conducted from the University of Auckland’s research vessel
Hawere using industry standard data acquisition methodologies as follows:

2.1     Rocky reef benthic sampling
To quantify macroalgal abundance, biomass, and diversity and sessile and mobile
invertebrate abundance and diversity, depth-stratified sampling was undertaken at eight
sites (Fig. 2.1); refer to Appendix 1.0 for site coordinates. Benthic sampling followed the
general sampling methods/protocols of Shears and Babcock (2007). The sites surveyed
were as follows: Motuhoropapa Island north-east (NE), Motuhoropapa Island south-east
(SE), Ōtata Island north-east (NE), Ōtata Island south-east (SE), David Rocks (DR),
Maria/Ruapuke Island (MI) Ahaaha Rocks (AA), and Orarapa Island (OI). Within each site
3 depth strata were sampled where possible classified as shallow (1-3m depth MLWS);
mid (5-8 m depth MLWS); and, deep (>10 m depth MLWS).

To document the depth distribution of broad-scale habitats at each site, the extent of the reef
from shallow to deep was videoed using a GoPro Camera (Hero 4+). To obtain quantitative
information on the extent of dominant species and community composition a total of four
haphazardly deployed 1m2 quadrats were sampled within each of the depth strata (shallow,
mid, and deep) as follows:

       Rimurimu/Macroalgae
All large brown macroalgae and turfing algal species within each quadrat was counted,
measured, or their percent cover estimated. The total length (TL) of all brown algae was
measured to ± 5 cm and individual measurements of stipe length (SL) to ± 5 cm for the
laminarian alga Ecklonia radiata. Macroalgal length measurements were then converted to
biomass based on length-dry weight relationships presented Shears and Babcock (2003) (see
Table 2.1).

        Encrusting species
The primary (substratum) percent cover of foliose algae, turfing algae, encrusting algal species,
encrusting invertebrates (e.g., sponges and ascidians bryozoans), as well as sediment and sand
percent cover were recorded in each 1 m2 quadrat using a visual estimation technique (see
Shears and Babcock, 2003). Briefly, quadrats were divided into quarters (1/4 =25 %) to assist
in estimating covers of dominant forms, while the covers of minor forms were estimated on the
basis that a 10 x 10 cm area equates to 1 % cover. This technique is considered to be the most
suitable for this study as it is efficient and ensures that the cover of all forms are recorded,
unlike point-intercept methods. Sub-samples of any unidentifiable species were taken,
preserved, and then identified accordingly.

        Kina/Urchins
All urchins occurring within each 1 m2 quadrat were counted and their behavioural
characteristics noted, i.e., grazing in the open (exposed behaviour) or occupation of crevices
and holes (cryptic behaviour). The test diameter of all urchins >10 mm were measured to the
nearest 5 mm with replacement.

                                                                                               8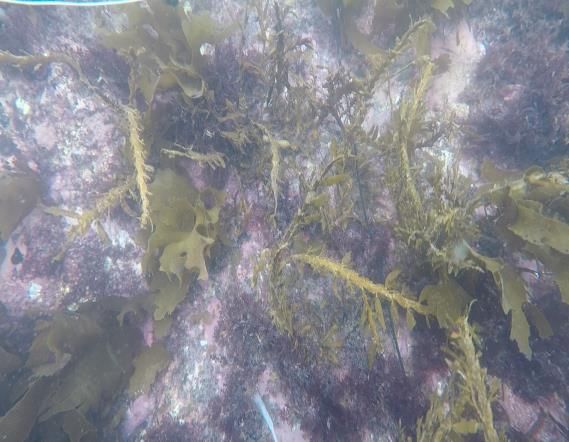
Pūpū/Gastropods and mobile invertebrates
All gastropods on the substratum and on macroalgae (stipes, fronds, and laminae) within each
1 m2 quadrat were counted and the largest shell dimension (width or length) measured to the
nearest 5 mm. For example, shell width was measured for Cookia sulcata; whereas shell height
was measured for Cantharidus purpureus. The total length of pāua (Haliotis species), limpets
(Cellana stellifera), and chitons were also measured. For echinoderm species excluding
urchins encountered (seastars, holothurians) only counts were made.

Note: All animal taxa enumerated in the survey were checked using the New Zealand Inventory
of Biodiversity (Gordon, 2009), New Zealand Coastal Marine Invertebrates Vol.1 (Cook,
2010) and additional UoA unpublished identification guides.

Figure 2.1. Location of eight rocky reef benthic sampling sites (yellow marks) and soft
sediment sampling sites (green marks) Noises Islands group – Autumn 2021. Source: Google
Earth. Refer to Appendix 1.0 for GPS coordinates.

                                                                                          9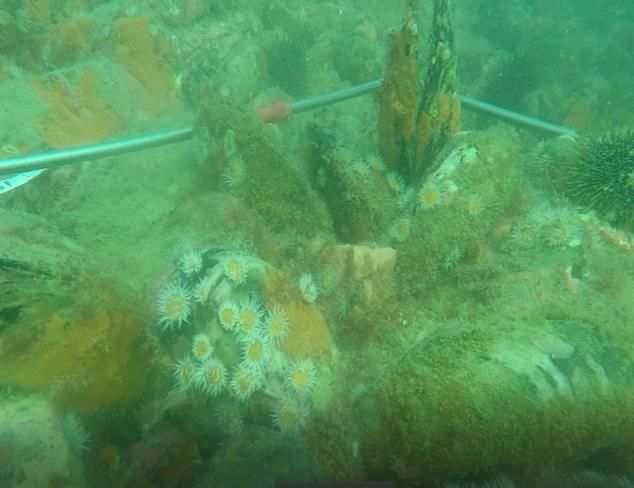
Table 2.1. Algal species and functional groups used in analysis along with length-weight
and/or percent cover-weight relationships for biomass estimates. y = dry weight (g), x = total
length (cm), SL = stipe length (cm) and LL = laminae length (cm). Data are from Shears and
Babcock (2003).

            Brown algae
            Carpophyllum angustifolium           y = 0.068x – 0.27
            C. maschalocarpum                    ln(y) = 1.764ln(x) – 4.311
            C. plumosum                          ln(y) = 1.472ln(x) – 3.850
            C. flexuosum                         ln(y) = 2.049ln(x) – 5.251
            Xiphophora chondrophylla             y = 1.786x – 4.171
            Ecklonia radiata – Stipe             ln(y) = 1.671ln(SL) –3.787
                              – Laminae          ln(y) = 1.177ln(SL × LL) – 3.879
            Sargassum sinclairii                  y = 0.075x + 0.124
            Landsburgia quercifolia              ln(y) = 1.971ln(x) – 5.058

            Small brown algae,                     ln(y) = 2.587ln(x) – 6.443
            e.g. Zonaria turneriana                1% = 2.5 g
            Brown turf, e.g. Distromium, Dictyota spp. 1% = 1.5 g
            Brown encrusting, e.g. Ralfsia        1% = 0.1 g
            Red algae
            Osmundaria colensoi                    ln(y) = 1.720 ln(x) – 3.379, 1% = 22.9 g
            Pterocladia lucida                     ln(y) = 1.963 ln(x) – 5.076 0., 1% = 10.0 g
            Melanthalia abscissa                  ln(y) = 1.775 ln(x) – 4.247
            Red foliose, e.g. Plocamium spp. ln(y) = 2.649 ln(x) – 8.812
            Red turfing (< 5 cm), e.g. Champia spp. 1% = 1.7 g
            Coralline turf, e.g. Corallina officinalis 1% = 4.5 g
            Crustose corallines                         1% = 0.1 g
            Red encrusting                               1% = 0.1 g
            Green algae
            Codium convolutum                            1% = 4.7 g
            Others, e.g. Ulva sp.                       1% = 1.7 g
            Filamentous algae                            1% = 0.2 g

        Invasive species
In recent years, parts of the New Zealand coastline have been subject to several invasive species
introductions such as the laminarian Undaria pinnatifida, the ‘solitary' sea squirt (clubbed
tunicate) Styela clava, Mediterranean fan-worm Sebella spallanzanii and the paddle-crab
Charybdis japonica. All quadrats and adjacent areas within the sampling envelope at each site
will be qualitatively checked for the possible occurrence of these taxa.

        Environmental variables
Physical variables: rock type, depth, sand, and sediment percent cover were assessed for each
site as part of the study. The nature of the rock type within quadrat was recorded based on 6
categories:

   •   Low lying platform reef;
   •   Boulder reef;
   •   Platform and boulder reef mix;
   •   Cobbles;
   •   Complex platform reef characterised by overhangs and crevices.

                                                                                                 10
2.2 Reef fish abundance and diversity
To evaluate the abundance and diversity of reef fish taxa at each of the six sampling sites,
a total of 9 reef fish transects were done within the 3-8 m depth range using underwater
visual censuses (UVC) methodology (Willis et al. 2000). To census reef fish, a diver
fastened a 30 m fibreglass transect tape to the substratum, then swam 5 m before
commencing counts to avoid sampling any fish attracted to the diver. The transect tape
was swum out to 30 m, with all fish visible 2.5 m either side of the swim direction counted.
Where certain schooling species (e.g., sweep Scorpis lineolatus) were too numerous to be
counted, numbers were estimated in their 20’s. Cryptic species were not surveyed due to
their small size (e.g., clinids, syngnathids, and tripterygiids other than the oblique
swimming triplefin Obliquichthys maryannae - if present). All tāmure/snapper
(Chrysophrus auratus) and red moki (Cheilodactylus spectabilis) censused were sized to ±
50 mm based on visual estimation. In instances where fish followed divers between
transects, care was taken to not include previously censused individuals in subsequent
replicate transects. Similarly, fish seen outside of the transect survey width were not
sampled, but their presence and corresponding depth were noted. Depth (m) at the start
and end of each transect and the occurrence of 7 habitat types (Ecklonia radiata; Ecklonia
radiata and sponge; mixed algae; Carpophyllum flexuosum; urchin barrens habitat;
shallow Carpophyllum; and sand) were recorded at 5 m intervals along each transect (as
present). All UVC censuses were done between 08:00 and 16:00 NZST.
2.3 Kōura/Lobster abundance
Following reef fish sampling, areas of reef deemed suitable as kōura/lobster habitat were
searched for the presence of the spiny rock lobster Jasus edwardsii and packhorse lobster
(Sagmariasus verreauxii) using three 50 m x 10 m (500 m2) haphazardly placed transects.
When encountered the size and, where possible, sex of each kōura/lobster was
determined by visual estimation (see MacDiarmid, 1991). Torches were used to aid in the
detection of kōura/lobster within deep holes and crevices. Depth and habitat variables
(as above) were also recorded.
2.4 Tipa/scallop and hururoa/horse mussel abundance
To evaluate tipa/scallop (Pecten novaezelandiae) and hururoa/horse mussel (Atrina
zelandica) density, a total of ten haphazardly placed 100 m2 transects were sampled
within a predetermined area off the south-western coast of Ōtata island. The survey area,
which was initially defined by the Neureuter family, is considered to be a popular
tipa/scallop bed. To survey tipa/scallop and hururoa/horse mussel density, a buoyed
shot line was deployed to mark the start of each transect. Two divers then descended the
shot line to the seabed. Once on the seabed one of the divers swam out a 50 m transect
tape down a pre-determined compass direction. The second diver followed behind
videoing the main soft sediment habitats approximately 1m above the seabed until
reaching the end of the transect. Following this both divers worked their way back slowly
to the transect origin sampling 1m either side of the transect counting and sizing (± 1 mm
using vernier callipers) all tipa/scallops encountered. Hururoa/horse mussels both
living, and dead were also recorded. To ensure the correct area was searched along each
diver held a 1m length, (20 mm dia.) PVC pipe perpendicular to each transect. Depth (m)
at the start and end of each transect were also recorded.
112.5 Data analysis
Both multivariate (many species) and univariate (single species) statistical tests were used to
analyse benthic rocky reef data with the majority undertaken using PRIMER-E statistical
software (Clarke and Warwick 2001) and associated routines; particularly PERMANOVA1
(Anderson et al. 2008). Unless otherwise stated, for the majority of species enumerated, means
are presented ± their associated standard error (SE).
Multivariate analyses using PERMANOVA were run on either (log x+1) or square-root
transformed multispecies data (macroalgae, sessile invertebrate and mobile invertebrate data)
using a Bray-Curtis similarity (resemblance) measure. Analysis of macroalgae assemblage
composition was based on biomass estimates, sessile invertebrate analysis was based on count
and percent cover data (combined), and mobile invertebrate analysis was based on count data.
Irrespective of analyses, the same model design and associated factors were examined. Of
specific interest was evaluating community assemblage variation across Sites (Motuhoropapa
north-east and SE, Ōtata Island north-east and south-east, David Rocks, Maria Island, Ahaaha
Rocks and Orarapa Island); Depth strata (shallow; mid; and deep), and the associated
Site×Depth interaction. Individual analyses were run on full models (all effects) using 4999
permutations. All significance levels corresponded to α = 0.05.
The multivariate null hypothesis tested was - H0: there is no statistically significant difference
in the species assemblages (e.g., macroalgae, sessile invertebrate assemblages etc.) across
sites; and among depth strata (shallow, mid, and deep).
Metric multi-dimensional scaling using principal coordinates analysis (PCO) (Anderson et al.
2008) was utilised to support multivariate PERMANOVA and visualise patterns based on the
among sites and depths in multivariate space. All analyses were run either (log x+1), or square-
root transformed multispecies data using a Bray-Curtis similarity measure. To further elucidate
species contributions to the patterns depicted from PCO, Pearson’s correlation coefficient and
SIMPER analyses were undertaken (Clarke and Warwick 2001).
To test for differences in single-species (univariate) abundances –across sites and depth-strata
PERMANOVA was run on log (x+1) transformed single species data using a Euclidean
distance measure (which is equivalent to traditional ANOVA (see Anderson et al., 2008)).
The univariate null hypothesis tested was - H01: there is no statistically significant difference
in the response variable (e.g., Ecklonia radiata density) across sites; and among depth strata
(shallow, mid, and deep).
A similar approach to that above was used to analysis reef fish data; however, as only one depth
strata was surveyed (mid) we were only interested in among-site differences.
1
PERMANOVA (permutational multivariate analysis of variance) is used for the analysis of
univariate or multivariate data in response to factors, groups or treatments in an experimental design.
123.0 Results
3.1 Habitat distributions
Rocky reef structure and associated biological habitats varied in accordance with location
and depth. Broad physical and biological habitat descriptions at a site-specific level are
summarised and presented in Table 3.1 and Figs 3.1-3.2. For those sites with continuous
rocky reef habitat that extended beyond 10 m depth, there was a general pattern of
macroalgal habitats being dominant in shallow and deep depth strata and urchin barrens
habitat concomitant with turfing and crustose coralline habitats prevalent at mid depths.
(Fig 3.2A-F). Thereafter at depths > 10 m depth, Ecklonia radiata and sponge habitats
were universally the dominant habitat types. For those sites with only a shallow extent
of rocky reef habitat, e.g., Maria Island and Orarapa Island there was trend for mixed algae
and Carpophyllum flexuosum habitats to dominate, with urchin barrens habitat either
sparse to non-existent or extremely patchily distributed. The very shallow subtidal < 1
m depth (not quantitatively sampled) at the majority of sites was often characterised by
a band of oysters (native and Pacific combined) intermixed with fucalean algae such as
Hormosira banksii and Xiphophora chondrophylla.
Equally, there was high variation in physical elements across the survey sites.
Motuhoropapa and Ōtata Island’s had a large spectrum of rocky reef architecture ranging
from pinnacles, overhangs, crevices, guts, and extensive platform reef throughout mid
and deeper depths. Both large and small boulder complexes were also evident at these
sites providing high habitat complexity. In a similar way, Ahaaha Rocks were also notable
for diverse rocky reef habitat elements including, pinnacles, platform reef with deep
crevices and boulder complexes. David rocks, Maria Island and Orarapa Island all had
moderate complexity comprised of platform reef with occasional crevices, guts, and
boulder complexes. Typically, at the termination of rocky reef habitats across sites,
coarse sediment, shell hash and dog cockle (Tucetona laticostata) whole shell
combinations were the prevalent soft sediment habitat types. Large rhodolith (mearl)
patches (10s m) in extent were also a dominant feature along the northern coastline of
Maria Island.
13Perna canaliculus
Perna canaliculus/Ecklonia
Mixed algae
Crustose coralline algae/urchin barrens
Coralline turf
Anenome bed
Ecklonia radiata
Ecklonia radiata/sponge
Carpophyllum flexuosum
Shell hash/coarse sand
Rhodolith
0 0
1 Motuhoropapa NE 1 Motuhoropapa SE
2 2
3 3
4 4
5 5
6 6
7 7
8 8
9 9
10 10
11 11
0 0
1 Otata NE 1 Otata SE
2 2
3 3
4 4
5 5
6 6
7 7
8 8
9 9
10 10
Depth (m)
11 11
0
1 Maria Island 0 Ahaaha Rocks
2 1
3 2
3
4
4
5 5
6 6
7 7
8 8
9 9
10 10
11 11
0 0
1 David Rocks 1 Orarapa Island
2 2
3 3
4 4
Y Data
5 5
6 6
7 7
8 8
9 9
10 10
11 11
0 5 10 15 20 25 30 35 40 45 50 55 60 65 70 75 80 85 90 0 5 10 15 20 25 30 35 40 45 50 55 60 65 70 75 80 85 90
Distance (m)
Figure. 3.1. Habitat distribution in accordance with depth (MLWS) and distance (meters)
across eight rocky reef dominated sites Noises Islands March 2021. Refer to Figure 2.1
for site locations.
14Table 3.1. General rocky reef site descriptions Noises Islands sampling sites March 2021.
Site Physical habitats Biological habitats
Motuhoropapa Island North East (MNE) Gently sloping rocky reef (bedrock) habitat characterised by guts in shallow water < Sparse mixed algal habitat in shallow water < 2m depth dominated by Carpophyllum
2m depth transitioning to gently sloping large platform terraces interspersed with maschalocarpum transitioning rapidly into urchin barrens habitat – the dominant
cobble habitat with increasing depth. Rock rubble common at reef/soft sediment habitat at this site. High cover of coralline turf, fine sediment, and highly moribund
interface at approximately 10m depth. Soft sediment habitat characterised by Carpophyllum flexuosum in deeper water > 7 m depth. Sponges Tethya burtoni and
coarse sediment, shell hash, and whole-shell matrix. Reef complexity moderate. Fine Raspailia topsenti common towards rocky reef and soft sediment interface at
sediment percent cover conspicuous and increasing with depth. approximately 10m depth. Sponges (Callyspongia ramosa) common on shell-hash
adjacent reef edge.
Motuhoropapa Island South East (MNS) Moderately sloping rocky reef (bedrock) habitat characterised by overhangs and Mixed algal habitat patchily distributed between 0-3 m depth. Small patches of green-
vertical sections of reef between 1-5m depth. Beyond 5m transitioning into gently lipped mussels < 2m depth. Narrow bands of urchin grazed barrens habitat patchily
sloping large platform terraces interspersed with small boulder habitat with distributed between 1-10m depth. Ecklonia radiata and Carpophyllum flexuosum
increasing depth. Reef extends out to approximately 12m depth transitioning into dominant > 5m-10m depth. Ecklonia radiata and diverse sponge habitat characteristic
coarse sediment, shell hash and whole-shell matrix. . Reef complexity moderate to > 10m depth.
high. Fine sediment percent cover conspicuous and increases with depth.
Ōtata Island North east (ONE) Moderately sloping rocky reef habitat characterised by overhangs and vertical Dense mixed algal habitat between 0-3 m depth transitioning abruptly into extensive
sections of reef between 1-5 m deep. Beyond 5 m transitioning into gently sloping urchin-grazed barrens habitat with encrusting sponges and ascidians common.
large platform terraces interspersed with small and large boulder habitat with Ecklonia radiata and sponge habitat increases in abundance beyond 12m depth, but
increasing depth. Reef extends out to approximately 15m depth transitioning into patchily distributed.
coarse sediment, shell hash and whole-shell matrix. . Reef complexity moderate to
high. Fine sediment percent cover conspicuous and increases with depth.
Ōtata Island South East (OSE) Vertical reef and pinnacles common between 0-3m transitioning into gently sloping Patchily distributed mixed algal habitat between 0-3 m depth transitioning abruptly
rocky reef (bedrock) platform habitat interspersed with small and large boulders into extensive urchin-grazed barrens habitat with encrusting sponges and ascidians
out to 12 depth which transitions into coarse sediment, shell hash, and whole-shell common. Ecklonia radiata and sponge habitat increases in abundance beyond 9 m
matrix. depth, but patchily distributed with frequent breaks in the canopy.
David Rocks (DR) Vertical reef and pinnacles characteristic of shallow depths , 3 m depth. Moderately Coralline turf dominant between 0-3 m depth associated with vertical reef. Green-
sloping platform reef between 3 m-9 m depth, thereafter large boulders are lipped mussels abundant between 3-8 m depth interspersed with urchin-grazed
common down to 12 m depth. barrens habitat. Ecklonia radiata dominant beyond 9m depth, often co-occurring with
low density green-lipped mussels.
Maria Island (MI) Moderately sloping rock reef habitat with occasional overhangs and vertical Patchily distributed green-lipped mussel habitat between 0-1m depth intwined with
sections of reef between 1-3 m deep. Boulder reef habitat common between 5-8m mixed algal habitat. Narrow areas of urchin barrens habitat between 2-4m depth
depth. Rocky reef habitat terminates in soft sediment matrix around 8m depth, which gives way to mixed Ecklonia radiata and Carpophyllum flexuosum dominated
which is comprised of coarse sediment, shell hash, and whole shell. Rhodolith habitats down to 8m depth. Rhodolith habitat common beyond rocky reef at depth
patches common. along with course shell-hash, whole shell substrate supporting dense dog-cockle beds.
Ahaaha Rocks (AA) Complex reef system characterised by vertical reef and network of pinnacles Dense green-lipped mussel and Anthothoe albocincta anemone habitat between 0-3m.
between 0-10m depth, intermixed with areas of moderately sloping reef. Reef Rapid transition into Ecklonia radiata habitat beyond 3m depth becoming the
comprised of platform bedrock reef, small and large boulders, and cobbles. Reef dominant macroalga forming continuous monospecific cover out to the lower limit of
terminates in fine to medium sand at approximately 15m depth. rocky reef substratum at around 18 m depth. Ecklonia radiata canopy thins
dramatically beyond 10m depth with large sponges increasing in abundance.
Orarapa Island (OI) Steeply sloping reef system comprised of cobbles boulders and bedrock platform Dense, green-lipped mussel habitat between 0-3m depth followed by Carpophyllum
reef between 0-12m depth. flexuosum becoming the dominant macroalga forming continuous monospecific cover
out to the lower limit of rocky reef substratum 8 m depth.
15A B
C D
E F
G H
Figure 3.2. Examples of main biological habitat types across sites – Noises Islands March 2021.
A) Mixed algal habitat- Maria Island; B) Anemone (Anthothoe albocincta) – Ahaaha Rocks; C)
kūtai/green-lipped mussels (Perna canaliculus) David Rocks and D) Ahaaha Rocks; E) Urchin-
grazed barrens – Ōtata Island; F) sessile-invertebrate Ōtata Island – mid depth; G) Ecklonia
radiata – Motuhoropapa Island; H) large sponge Ecionemia alata – Ōtata Island.
163.2 Rimurimu/Macroalgal habitat
Three main brown macroalgal species were synonymous with highest algal abundance,
biomass, and habitat structure across the eight sites surveyed. These were the laminarian
alga Ecklonia radiata (true kelp), and the fucalean algae (rockweeds) Carpophyllum
flexuosum and Carpophyllum maschalocarpum, which often formed enclosed canopies
and were associated with high algal biodiversity. As is typical with macroalgal
assemblages, there was high variability in both species-specific abundance, size, and
biomass across the sites and depth strata surveyed (Figs 3.3-3.7; refer to Appendix 2.0
for single species analyses). However, coarse depth-distributional patterns were
apparent that included the kelp Ecklonia radiata attaining highest abundance, size, and
biomass in either shallow and/or deep depth-strata. Lower Ecklonia radiata abundance
and biomass in the mid-depth strata, reflects the dominance of urchin-grazed barrens
habitat (Figs 3.1, 3.2E) or the presence of kūtai/green-lipped mussel habitat (Figs 3.1,
3.2D).
In shallow-water, Ecklonia radiata was commonly intermixed with other fucalean
species; whereas, at deeper depths (> 8 m) Ecklonia radiata stands tended to be either
monospecific (only Ecklonia) or co-occurring with Carpophyllum flexuosum. Size
structures based on stipe length (SL) also differed between depth strata, with smaller
individual’s more characteristic of shallow depths and slightly larger individuals more
common in deeper water (Fig. 3.5). Canopy cover at depth was patchy at both
Motuhoropapa and Ōtata sites, where there was also evidence of canopy regression and
both urchin (Evechinus chloroticus) and amphipod (Orchomenella ahhu) grazing (Fig. 3.6).
At Ahaaha Rocks, Ecklonia radiata formed a reasonably continuous monospecific stand
from approximately mid-depth (6 m) out to the termination of rocky reef habitat at
approximately 15 m depth. Resultantly, this site also had the highest biomass, being a
representative example of continuous kelp forest habitat. Orarapa Island was also of note
due to the dominance of Carpophyllum flexuosum forming monospecific stands from mid
depth (5 m)out to deeper areas of reef > 10 m depth (Fig. 3.6). This is also reflected in
size frequency distributions (Fig. 3.7).
A total of 29 algal species were enumerated across survey sites, many of which were
understory in nature and equally diverse in size and architecture i.e., ranging from erect
multi-branched and foliose through to filamentous, encrusting, and turfing forms.
Macroalgal richness was highest in either shallow or deep depth strata (Fig. 3.10).
However, it is likely that the macroalgal species diversity presented here is under-
representative of maximum algal diversity across the Noises Island groups due in part to
1) the timing of the survey (Austral autumn); and, 2) the high sediment percent cover
prevalent across sampling sites making species detection and identification difficult in
some instances.
Common understorey species encountered during the survey were the brown algae
Carpomitra costata, Zonaria turneriana, Halopteris virgata, Colpomenia sinuosa, Zonaria
turneriana, Dictyota spp; and, red algae Champia laingii, Pterocladia lucida, and Gigartina
spp. Two forms of red coralline algae – crustose (CCA) and articulated/turfing – (CT)
17were also conspicuous at many of the sites; albeit exhibiting high variation across depth
strata (Fig. 3.7).
30 50
Ecklonia Motuhoropapa NE Ahaaha Rocks
25 40
C. mash
20 C. flex
30
15
20
10
5 10
0 0
30 30
Motuhoropapa SE David Rocks
25 25
20 20
Abundance m-2 (+ SE)
15 15
10 10
5 5
0 0
40 35
Otata NE Orarapa Island
30
30 25
20
20
15
10 10
5
0 0
70 30
Otata SE Maria Island
60 25
50
20
40
15
30
Depth strata 10
20
10 5
0 0
Shallow Mid Deep Shallow Mid
Depth Strata
Figure 3.3. Abundance of three habitat forming brown macroalgae across eight sites in
relation to depth – Noises Island, Autumn 2021. Species include the kelp Ecklonia radiata,
and rockweeds Carpophyllum flexuosum and Carpophyllum maschalocarpum. Data are
averages + SE. Note: x and y axis differ among graphs.
Macroalgal community composition based on biomass estimates was found to be
statistically different across sites and depth strata based on PERMANOVA (Table 3.2),
although the PCO ordination indicated no clear groupings with respect to either site or
depth (Fig. 3.9A). This primarily reflects the high variation in macroalgal community
composition and somewhat fragmented nature of algal communities across the rocky reef
subtidal environs comprising the Noises Islands, supported further by the statistically
significant Site×Depth interaction (Table 3.2). Macroalgal species that best explain the
various site groupings across the ordination, based on corresponding Pearson’s
correlation coefficients are presented in Fig. 3.9B.
18300 500
Motuhoropapa NE Ahaaha Rocks
Ecklonia
250 400
C. mash
200 C. flex
300
150
200
100
50 100
0 0
300 300
Motuhoropapa SE David Rocks
250
Biomass g dwt-1 m-2 (+ SE)
250
200 200
150 150
100 100
50 50
0 0
300 300
Otata NE Orapapa
250 250
200 200
150 150
100 100
50 50
0 0
300
Otata SE 300
250 Maria Island
250
200 200
150 150
100 Depth strata 100
50 50
0 0
Shallow Mid Deep Shallow Mid
Depth Strata
Figure 3.4. Biomass of three habitat forming brown macroalgae across eight sites in
relation to depth – Noises Islands, Autumn 2021. Species include the kelp Ecklonia
radiata, and rockweeds Carpophyllum flexuosum and Carpophyllum maschalocarpum.
Data are averages + SE. Note: x-axis and y-axis differs among graphs.
Both coralline turf (CT) and crustose coralline algae(CCA) were the two most dominant
algal groups across sites and depth strata; albeit exhibiting high variation in percent
cover and biomass across depth strata (Fig. 3.8). However, coralline turf was especially
dominant in shallow water at Motuhoropapa SE, Ōtata NE, Orarapa Island and both
shallow and mid-depth at Ōtata SE. Brown and red turfing algae were also present across
sites but tended to have low percent covers. SIMPER analysis based on dissimilarities
among depth strata indicated that Ecklonia radiata, Zonaria turneriana and brown and
red filamentous and turfing algae were more characteristic of deeper depth strata;
Carpophyllum maschalocarpum, Carpophyllum flexuosum, Carpophyllum plumosum,
Xiphophora chondrophylla and Pterocladia lucida more representative of shallow depth
strata with coralline turf (CT) and crustose coralline algae (CCA) being intermediate
across all depth strata.
1920
Shallow 20
Mid 20
Deep
n=0 n=0 n=40 Motuhoropapa NE
15 15 15
10 10 10
5 5 5
0 0 0
20 20 20
n=3 n=59 n=67 Motuhoropapa SE
15 15 15
10 10 10
5 5 5
0 0 0
40 40 40
n=62 n=0 n=72 Otata NE
30 30 30
20 20 20
10 10 10
0 0 0
50 20 20
n=123 n=0 n=62 Otata SE
40
Frequency
15 15
30
10 10
20
10 5 5
0 0 0
20 20 20
n=0 n=0 n=58 David Rocks
15 15 15
10 10 10
5 5 5
0 0 0
20 30 50
n=0 25
n=94 n=96 Ahaaha' Rocks
15 40
20
30
10 15
20
10
5 10
5
0 0 0
20 20 20
n=14 n=19 n=34 Orarapa Island
15 15 15
10 10 10
5 5 5
0 0 0
20 20 50 100 150 200 250 300 350 400 450 500 550 600 650 700 750 800 850 900 950
n=29 n=58 Maria Island
15 15
10 10
5 5
0 0
50 100 150 200 250 300 350 400 450 500 550 600 650 700 750 800 850 900 950 50 100 150 200 250 300 350 400 450 500 550 600 650 700 750 800 850 900 950
Size (mm)
Figure 3.5. Size frequency distributions of Ecklonia radiata based of stipe length (SL)
across eight sites in relation to depth – Noises Island, Autumn 2021. Note: x and y-axis
differ among graphs.
Figure 3.6. A) Ecklonia radiata canopy regression Motuhoropapa–SE, consistent with
amphipod grazing; and, B) dense stands of Carpophyllum flexuosum, characteristic of
Orarapa Island.
2020
Shallow 20
Mid 20
Deep
n=0 n=0 n=40 Motuhoropapa NE
15 15 15
10 10 10
5 5 5
0 0 0
20 20 20
n=3 n=20 n=15 Motuhoropapa SE
15 15 15
10 10 10
5 5 5
0 0 0
60 20 20
n=53 n=1 n=7 Otata NE
50
15 15
20
10 10
10
5 5
0 0 0
20 20 20
n=21 n=0 n=1 Otata SE
Frequency
15 15 15
10 10 10
5 5 5
0 0 0
20 20 20
n=0 n=0 n=4 David Rocks
15 15 15
10 10 10
5 5 5
0 0 0
20 20 20
n=0 n=7 n=0 Ahaaha's
15 15 15
10 10 10
5 5 5
0 0 0
20 20 20
n=6 n=65 n=80 Orarapa Island
15 15 15
10 10 10
5 5 5
0 0 0
20 20 50 100 150 200 250 300 350 400 450 500 550 600 650 700 750 800 850 900 950
n=29 n=58
15 15 Maria Island
10 10
5 5
0 0
50 100 150 200 250 300 350 400 450 500 550 600 650 700 750 800 850 900 950 50 100 150 200 250 300 350 400 450 500 550 600 650 700 750 800 850 900 950
Size (mm)
Figure 3.7. Size frequency distributions of Carpophyllum flexuosum based on total length
(TL) across eight sites in relation to depth – Noises Island, Autumn 2021. Note: y-axis
differs among plots.
2180 80
Motuhoropapa NE David Rocks
60 60
40 40
20 20
0 0
80 80
Motuhoropapa SE Ahaaha Rocks
60 60
Percent cover m-2 (+ SE)
40 40
20 20
0 0
80 80
Otata NE
Orarapa Island
60 60
40 40
20 20
0 0
80 100
Otata SE Maria Island
Brown
80 CT
60
CCA
60 Red
40 Sediment
40
20
20
0 0
Shallow Mid Deep Shallow Mid
Figure 3.8. Percent cover of brown algae (foliose and crustose) CT – Coralline turf, CCA
– Crustose coralline algae and additional red algae (foliose and crustose) and fine
sediment across eight sites in relation to depth – Noises Islands.
2240
A Shallow
30
OR
Mid
AA Deep
MI OR
20
OSE
AA
PCO Axis 2 (26.3%)
10
AADR
MNE
0 ONEMSE
MNE OSE
OR
-10
DR MSE
OSE
ONE MSE
-20
ONE MI
-30
-40
-50 -40 -30 -20 -10 0 10 20 30 40 50
PCO Axis 1 (30.9 %)
0.8
B
0.6 Dic
Eck
0.4
PCO Axis 2 (26.3%)
CCA Flex
0.2
Colp CT
BT
PT
0.0 Zon Plum
Xipho Masc
RF
-0.2
RT
-0.4
-0.6
-0.8
-0.8 -0.6 -0.4 -0.2 0.0 0.2 0.4 0.6 0.8
PCO Axis 1 (30.9 %)
Figure 3.9. Principal coordinate analysis based on log x+1 macroalgal biomass data (27
main taxa – Appendix 3.0). A) Site-and depth-specific variation in macroalgal biomass; B)
Biplot demonstrating correlation between PCO axes and each species, (>0.25
correlation). Sites as follows: AA = Ahaaha Rocks; DR = David Rocks; MI = Maria Island;
MNE = Motuhoropapa north-east; MSE – Motuhoropapa south-east; ONE = Ōtata north
east; OSE = Ōtata south east; OR = Orarapa Island Species and species groups as follows;
BT = Brown turf; Flex = Carpophyllum flexuosum; Masc = Carpophyllum maschalocarpum;
Plum = Carpophyllum plumosum; CT = Coralline turf; CCA = Crustose coralline algae; Colp
= Colpomenia sinuosa; Dic= Dictyota kunnthii; Eck = Ecklonia radiata; PT = Pterocladia
lucida; RT = Red turf; RF = Red foliose; Xipho = Xiphophora chondrophylla; Zon = Zonaria
turneriana.
23Table 3.2. Results from PERMANOVA analysis of macroalgal biomass data (27 taxa).
Analysis was run on log (x+1) transformed data using a Bray Curtis similarity measure
and 4999 permutations. Statistically significant P-values at the 5% level are shown
italicised and in bold.
Source df SS MS Pseudo-F P(perm)
Site 7 34594 4941.9 10.53 0.0002
Depth 3 16927 5642.3 12.03 0.0002
SixDe 10 47876 4787.6 10.21 0.0002
Res 48 22523 469.2
10 10
Macroalgae Motuhoropapa NE Ahaaha Rocks
8 Sessile inverts 8
Mobile inverts
6 6
4 4
2 2
0 0
12 10
Motuhoropapa SE David Rocks
10 8
8
6
Richness m-2 (+ SE)
6
4
4
2
2
0 0
12 12
Otata NE Orarapa Island
10 10
8 8
6 6
4 4
2 2
0 0
12 12
Otata SE Maria Island
10 10
8 8
6 6
4 Depth strata 4
2 2
0 0
Shallow Mid Deep Shallow Mid
Depth Strata
Figure 3.10. Average species richness of macroalgae, sessile invertebrates, and mobile
invertebrates across eight sites in relation to depth – Noises Islands Autumn 2021. Data
are averages ± SE. Note: x-axis and y-axis differs among graphs.
The percent cover of fine sediment varied considerably among sites and depth strata. For
Motuhoropapa Island, Ōtata Island, Maria Island, and Orarapa Island sites there was a
trend for higher sediment percent cover in deeper water relative to shallow and mid-
depths. At David Rocks the percent cover of fine sediment was higher in the mid depth
strata. Sites with the highest percent cover of fine sediment were Motuhoropapa north-
24east, and Ōtata north-east where percent cover exceeded 50 % m-2. At these sites there
was also evidence of sediment impacted large sponges such as Ecionemia alata.
3.2 Sessile invertebrates
In addition to macroalgae, sponges, ascidians, encrusting bryozoans, hydroids, and hard
coral were common components of rocky reef sessile invertebrate communities across
the 8 survey sites. Species richness was found to be generally lower in shallow and mid-
depths averaging around 4-5 species m-2; whereas, in deeper water species richness
commonly ranged between 8-9 species m-2 (Fig 3.10). Dominant species encountered
included, the large grey sponge, Ecionemia alata , the golf ball sponges Tethya burtoni,
with erect branched sponges such as Callyspongia ramosa and Raspailia spp synonymous
at rocky reef/soft sediment transitions at depth. Encrusting species were commonly
represented by the sponges Cliona celata, Clathria rubens; ascidians Cnemidocarpa
bicornuta, Asterocarpa coerulea, Aplidium spp, and Didemnum spp.; and, the hard coral
Culicia rubeola. Encrusting forms were particular dominant in urchin barrens habitat
(Fig. 3.2F), whereas larger sponges with more complex architectures such as Ecionemia
alata, Apatos globosum, and Raspailia topsenti, were more common in deeper depth
strata (Fig. 3.2H).
Several unique sessile invertebrate assemblages were also encountered for example
shallow regions around the Ahaaha Rocks were particularly notable for the high percent
cover of kōtore tāhekeheke ma/anemones (Anthothoe albocincta) intermixed with
mosaics of subtidal kūtai/green-lipped mussel (Perna canaliculus) habitat. High density
kūtai/Perna canaliculus patches were also a conspicuous component throughout David
Rocks (Fig. 3.11A), Maria Island and Orarapa Island shallow and mid-depth regions (0.5-
5 m depth). Typically, where present, kūtai/Perna canaliculus beds were comprised of
large individuals > 100 mm (Fig. 3.11B) that generally supported a large diversity of
sessile invertebrates themselves. Within high density areas, kūtai/Perna canaliculus
ranged between 25-50 m-2. Average densities within those sites where high-density beds
were evident are presented in Fig 3.11A). Very sparse subtidal patches of kūtai/Perna
canaliculus were observed at Motuhoropapa south-east during the survey, which
contrasts the 2017 habitat survey that identified numerous discrete, high-density,
patches at shallow depths along much of Motuhoropapa eastern coastline (Haggitt and
Shears, 2017).
25A
50
40
Density m + SE
Mid
-2 30
20 Shallow
10 Shallow
0 Shallow
Ahaaha Rocks David Rocks Maria Island Motohoropapa north
Site
10
Motuhoropapa NE n=9
8 B
6
4
2
0
20
Ahaaha Rocks n=63
15
10
5
Frequency
0
30
David Rocks n=132
25
20
15
10
5
0
20
Orapapa Island n=38
15
10
5
0
5
10
15
20
25
30
35
40
45
50
55
60
65
70
75
80
85
90
95
0
5
0
5
0
5
0
5
0
5
0
5
0
5
0
5
0
10
10
11
11
12
12
13
13
14
14
15
15
16
16
17
17
18
Size (mm)
Figure 3.11. A density and B size frequency distributions of kūtai/Perna canaliculus
across four sites– Noises Island March 2021. Note: y-axis differs among plots.
26Sessile invertebrate community assemblage analysis indicated clear differences with
regard to depth along PCO Axis 2 (Fig. 3.12) with deep-water sites typically negatively
associated with PCO Axis 2 and mid- and shallow-water sites positively associated with
PCO-Axis 2. However, there was no clear gradient in species composition across sites
consistent with an environmental gradient. Differences in sessile invertebrate
community composition was found to be statistically significant across sites and among
depth strata based on PERMANOVA (Table 3.3).
Species contributing to the various site and depth groupings across the ordination based
on Pearson’s correlation coefficients are presented in Fig. 3.11B. Main species
responsible for depth-related differences (dissimilarity) were as follows - the sponges
Ecionemia alata, Tethya bergquistae, Plakina monolopha, and Raspailia topsenti; ascidians
Cnemidocarpa bicornuta and, the solitary cup coral Monomyces rubens were more-
characteristic of deeper strata; whereas, the anemone Anthothoe albocincta; mussels
Perna canaliculus and the hard coral Culicia rubeola were more prevalent/typical of
shallow water habitats. Species with more prevalence in mid depths were the encrusting
forms such as Aplidium spp, and Cliona celata. Refer to Appendix 3.0 for
presence/absence data.
Table 3.3. Results from PERMANOVA analysis of sessile count and percent cover data (32
taxa). Analysis was run on log (x+1) transformed data using a Bray Curtis similarity
measure and 4999 permutations. Statistically significant P-values at the 5% level are
shown italicised and in bold.
Source df SS MS Pseudo-F P(perm)
Site 7 74954 10708 7.8299 0.0002
Depth 3 39421 13140 9.6088 0.0002
SixDe 10 87777 7314.8 5.3489 0.0002
Res 48 62906 1367.5
2740
A
ONE
MSE Shallow
Mid
30 MNE
MI
ONE
20
DR
DR
Deep
MSE
AA
PCO Axis 2 (17.5%)
10
MIDR
MSE
0 OSE
OR
OSE
-10
OR AA
MNE
-20
DR
-30 ONE
AA OR
-40
-50 -40 -30 -20 -10 0 10 20 30 40 50
PCO Axis 1 (20.6 %)
0.8
B
Cbi
0.6 Ast
Aplid
Mr Rt
Tbu
0.4 Ply Gr
C ply
Ag CrCi
Ps1 Pa Cc
StelDoPara
PCO Axis 2 (17.5%)
Ea Hh Hal
0.2 Br Tbe Anth
Cal Did Pern
0.0 Plk Tet
SolPs2
Enc Bry
Epo p Cory
-0.2 Cul
Spir Ted
-0.4 Alcy
Agla
-0.6
-0.8
-0.8 -0.6 -0.4 -0.2 0.0 0.2 0.4 0.6 0.8
PCO Axis 1 (20.6 %)
Figure 3.12. Principal coordinate analysis based on square-root transformed sessile
invertebrate abundance and percent cover data (37 taxa) across eight sites – Noises
Islands - March 2021. A) Site- and depth-specific variation in assemblage biomass; B)
Biplot demonstrating correlation between PCO axes and sessile invertebrate species,
(>0.25 correlation). Sites as follows: AA = Ahaaha Rocks; DR = David Rocks; MI = Maria
Island; MNE = Motuhoropapa north-east; MSE – Motuhoropapa south-east; ONE= Ōtata
north east; OSE = Ōtata south east; OR = Orarapa Island Species and species groups as
follows: Apli=Aplidium scabellum; Ag=Aaptos globosum; Agla= Aglaophenia laxa; Alcy=Alcyonium
aurantiacum; Anth=Anthothoe albocincta; Ast=Asterocarpa coerulea; Br=Biemna rufescens;
Cal=Callyspongia ramosa; Cbi=Cnemidocarpa bicornuta; Cc=Cliona celata; Ci=Crella incrustans;
Cory=Corynactis australis; C ply=Ciocalypta polymastia; Cr=Clathria rubens; Cul=Culicia rubeola; Did=
Didemnum species; Do=Darwinella oxeata; Ea=Ecionemia alata; Enc Bry=Encrusting bryozoan; Gr= Geodia
regina; Hal=Halichondria moorei; Hh= Hymeniacidon hauraki; Mr=Monomyces rubrum; Pa=Pseudodistoma
aureum; Para=Parasmittina delicatula; Pern=Perna canaliculus Plk=Plakina monolopha; Ply=Polymastia
species; Ps1=Psammocinia species 1; Ps2 = Psammocinia species 2; Rt=Raspailia topsenti; Sol=Solanderia
sp.; Spir=Spiorbid tube worms; Stel=Stelletta crater; Tbe=Tethya bergquistae; Tbu= Tethya burtoni; Ted=
Tedania sp; Tet=Tetrapocillon novaezealandiae.
28You can also read