Suffolk: Economic Assessment of the Sport
and Physical Activity Sectors
←
→
Page content transcription
If your browser does not render page correctly, please read the page content below

Suffolk: Economic Assessment of the Sport and Physical Activity Sectors

Suffolk County Council

Suffolk: Economic Assessment of the Sport
and Physical Activity Sectors

September 2018

www.regeneris.co.uk

Suffolk Most Active County: Economic Assessment of the Sport and Physical Activity Sectors

Foreword
Undoubtedly, sport and physical activity is integral to Suffolk life. Not only is it essential to the
health and wellbeing of the whole community it also makes an important contribution to the
local economy in terms of spending, output and employment.

Despite this, the contribution that sport makes to the economy has not, to date, been fully
acknowledged. It is therefore essential that we fully understand the potential of the Sport and
Physical Activity sector in Suffolk and work collaboratively to maximise its contribution to the
economy.

The publication of Sporting Futures, the Government’s strategy for an active nation, has re-
defined what success in sport looks like by concentrating on five key outcomes. One of which is
economic development.

The Government maintains that ‘Sport and physical activity have not traditionally been
supported in the same way as other parts of the economy’ and ‘with sport and physical activity
contributing £39bn to the UK’s GDP and with one million people employed in the sport and
physical activity sectors, ensuring that this sector of the economy is effectively supported is
crucial for government.’

Furthermore, they state that, ‘a stronger and more successful sporting economy can help meet
customer needs more effectively, and a strong demand from the public for opportunities to take
part in sport and physical activity will also help drive the economy. This is on top of the direct
benefit for the UK of additional jobs and economic activity.’

The Government is unequivocal that ‘there is untapped potential in the sport and physical
activity sectors.’

This assessment speaks directly to this strategy, capturing the scope and impact of the sector in
Suffolk. Its purpose is to act as a catalyst to bring together key agencies and individuals to further
tap the potential of the sport and physical activity sector in Suffolk going forward. In doing so, it
will not only support our collaborative long-term ambition for Suffolk to become the most active
county in England but, importantly, also further support and grow the Suffolk economy.

Cllr James Reeder

Cabinet Member for Health

Suffolk County Council
Suffolk Most Active County: Economic Assessment of the Sport and Physical Activity Sectors

Contents Page
Executive Summary                                                                                  i

        Sector Analysis                                                                             i

        Opportunities                                                                             iii

        Recommendations                                                                           iv

1.      Introduction                                                                               1

        Study Scope                                                                                1

2.      Study Background                                                                          3

        Sport and Physical Activity                                                                3

        Suffolk County Council Priorities                                                          4

        Suffolk Public Health Context                                                              5

        Wider Context                                                                              8

3.      Sector Analysis                                                                           13

        Sector Definition                                                                         13

        Sport and Physical Activity in Suffolk                                                    14

        Infrastructure                                                                            22

        Skills and Provision in the Sector                                                        27

        Health                                                                                    31

4.      Economic Opportunities                                                                    37

        Improving Participation and Boosting Productivity                                         37

        Sporting Events                                                                           38

        New Venue                                                                                 46

        Future Drivers of Growth                                                                  49

        Opportunities and Regional Priorities                                                     53
Suffolk Most Active County: Economic Assessment of the Sport and Physical Activity Sectors

5.      SWOT Assessment                                                                           54

6.      Recommendations                                                                           56

        Measuring Success                                                                         57
Executive Summary
i.      Suffolk has an ambition to become the most active county in the country. The Most Active County
        partnership was established in 2012 to work towards this. The partnership involves key agencies
        and organisations collaborating to bring added value to the work that many organisations across
        Suffolk are doing to address physical inactivity.

ii.     To improve on their current standing, the County Council has identified a need to develop, grow
        and encourage investment in the Sport and Physical Activity economic sectors. This will require
        the Most Activity County partnership to engage with a broader range of projects and
        stakeholders than it has done previously.

iii.    Hatch Regeneris were commissioned to begin this work by undertaking a comprehensive
        economic assessment of the Sport and Physical Activity sectors in the county. The four key aims
        of the commission were to:

        1)     Provide a detailed overview of the Sport and Physical Activity sectors in Suffolk

        2)     Assess the value and position of the Sport and Physical Activity sectors in Suffolk

        3)     Identify major opportunities and future drivers of growth for the Sport and Physical
               Activity sectors in Suffolk

        4)     Propose a series of recommendations to help grow and develop the sectors in Suffolk

        The work will be used to broker relationships with key stakeholders across the region and to
        develop an appropriate action plan with associated governance structures.
iv.     The work highlights that the Sport and Physical Activity sectors are the highest performing
        sectors in Suffolk in terms of growth and specialisation. It also shows that there are significant
        opportunities for further growth and that it makes sense for partners across the public and
        private sectors to work together to capitalise on these and to accelerate its current positive
        trajectory.

v.      The rest of this section provides a high level summary of key messages emerging from the work.

        Sector Analysis
        Sport and Physical Activity makes an important contribution to the Suffolk economy…

vi.     Analysis shows that employment in the Sport and Physical Activity sectors has grown at a faster
        rate than for all other sectors and in comparison to the sector growth seen at the regional and
        national scales. Over the last five years employment has grown by nearly 60% to over 10,000
        employees. Evidence shows that this has been driven primarily by employment growth
        associated with activities of sports clubs.

vii.    It is also the most specialised sector in Suffolk and is a strength of the county’s economy
        alongside business support, transport, construction and retail. The sector is almost two times
        more specialised than the national average in terms of employment.

viii.   The figure below demonstrates the size, scale and growth of the sector.

                                                    i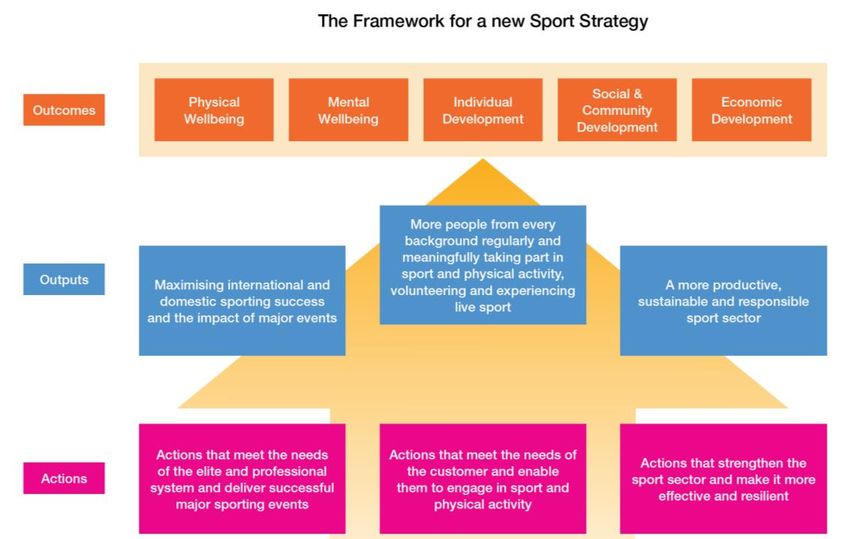
Headline Statistics
           SUFFOLK’S       SPORTS AND PHYSICAL ACTIVITY SECTOR

                     10,000                       700                      2 TIMES MORE
                                                                           SPECIALISED THAN
                     EMPLOYED                     BUSINESSES               ENGLAND

                     £190M SALARY                               £270M GROSS VALUE
                     GENERATED PER ANNUM                        ADDED PER ANNUM

                     +60% EMPLOYMENT                            25% OF ALL NET
                     GROWTH IN LAST 5 YEARS                     EMPLOYMENT GROWTH IN
                                                                SUFFOLK

                     55% OF EMPLOYMENT                          1 IN 4 BUSINESSES IN
                     IN SPORTS CLUBS AND                        SECTOR INVOLVED IN
                     FACILITIES                                 RACEHORSE ACTIVITIES

       Suffolk’s skill profile matches the needs of the sector, but there are several skills gaps…

ix.    Evidence demonstrates that Suffolk has a broad skills profile with a more even split of
       qualification levels when compared to the East of England and England as a whole. For example,
       a lower proportion of residents have a university level qualification compared to England (NVQ
       Level 4 or higher), but a higher proportion have NVQ Levels 3, 2 and 1 (i.e. GCSEs and A-Levels).

x.     This broad profile suits the needs of the sector well as it is made up of a wide range of roles that
       require different skill levels – from highly skilled technical roles to those than require fewer
       qualifications. If the sector continues to grow it should therefore provide employment
       opportunities to a range of different types of people across the county.

xi.    The sector is also supported by a range of education institutions and courses which helps
       support its development and evolution. Consultation, however, indicates that there are several
       skills gaps that will need to be filled in order for the sector to grow. Examples include:

       •      Leisure facility operation: relevant skills needed for operating leisure centres and sports
              facilities are lacking, with further and higher education placing a greater focus on more
              technical sports science skills for the sector. Transferable “people” skills and business
              management skills have been identified as desirable for employers in the sector. In
              addition, specific high skilled jobs in managing facilities is lacking in some areas (e.g. a
              shortage of pool engineers).
       •      Coaching and training: while a range of qualifications are available for sports coaching,
              consultation indicates that there is a shortage of participation due to the perception of
              low pay and lack of clarity on career progression.

       Participation is in line with regional and national averages, but sickness absences are high
       which has economic implications…

xii.   Our work shows that participation levels in Suffolk are in line with regional and national
       averages, but there is an opportunity to increase it across the county. While 67% of people aged

                                                    ii
19 or over regularly undertake the recommended level of physical activity, around a fifth of
        residents are classified as physically inactive. This has economic implications because physical
        activity delivers health benefits which can reduce expenditure on health services, increase the
        size of the available workforce, reduce the number of working days lost to sickness and,
        ultimately, increase productivity. This is particularly pertinent to Suffolk because the county has
        the highest proportion of days lost to sickness in the East of England. Just under 2% of all
        working days are lost to sickness absence compared to around 0.75% in Southend, Hertfordshire
        and Cambridgeshire.

        Opportunities
        There are a range of opportunities to grow and develop the sector which should help to
        stimulate economic activity and influence participation…

xiii.   The report sets out a number of opportunities that could contribute to the future growth and
        development of the sector in Suffolk. These are based on consultations and the baseline
        assessment of the sector. A brief summary of some of these can found in the table below. While
        this is not a comprehensive list of opportunities, it provides a useful overview of where the sector
        can continue to develop.

        Opportunities for the Sport and Physical Activity Sectors in Suffolk
        Improving participation The proportion of working days lost to sickness in Suffolk is c.50% higher
        and boosting              than the national average which equates to a loss of c.£424m a year in
        productivity              economic activity. If partners can work together to increase participation
                                  and health outcomes this could contribute to increased productivity and
                                  reduced spending on healthcare. High level modelling indicates that a 10%
                                  reduction in sickness rates could contribute an additional £42m to the
                                  county’s economy each year. There is also much evidence to demonstrate
                                  that increasing participation can deliver a range of other social and
                                  economic impacts (e.g. reduced health spend, improved psychological
                                  health and better educational attainment etc.).
        Sporting events           Even though Suffolk has a busy annual sporting calendar, there are a range
                                  of other events it could host to attract people from different parts of the
                                  country and stimulate the economic activity associated with this (i.e. via
                                  participant, visitor and organiser spend). The report identifies a range of
                                  events that could be introduced to Suffolk but focuses on three realistic and
                                  game-changing options: a major triathlon (e.g. Ironman), an accessible
                                  sporting event and a large-scale beach sports event.
        New sporting venue        The Suffolk Sports Facility Framework identifies a number of infrastructure
                                  opportunities in the county, including the delivery of a new sports venue
                                  with 8-12 badminton courts (also serving as an events venue for indoor
                                  sport) and a 50m swimming pool. If this is pursued (and incorporates a 150
                                  station health and fitness gym and 3 health and fitness studios), our high
                                  level modelling indicates that it could deliver a wide range of economic
                                  impacts for its locale, including: c.100 gross FTE jobs on site, c.10 gross FTE
                                  jobs through supply chains, c.£30m gross GVA on site over ten years, c.£3m
                                  gross GVA through supply chains over ten years and c.140 construction jobs
                                  per year over a two year build period.
        Future drivers of         Physical inactivity and obesity are widely recognised as global societal
        growth                    issues. Global life expectancy is increasing alongside this and many
                                  populations are ageing. These trends, alongside other factors, are
                                  contributing to significant growth in the Sport and Physical Activity sectors

                                                        iii
at global and national scales. This growth presents a number of
                                opportunities for development and innovation in the sector. The report
                                discusses some key trends that are likely to drive the future growth of the
                                sectors, including:
                                       •       Data is becoming a bigger part of the sectors (e.g. through
                                               wearable devices and the emergence of the quantified self)
                                       •       New technologies are becoming increasingly prominent
                                               accross the sector (e.g. Augmented and Virtual Reality)
                                       •       Technology is influencing sport consumption and
                                               participation
                                       •       Changing demographics and lifestyles are driving
                                               developments around nutrition and equipment

xiv.   As set out in the table below, many of these opportunities align with the strategic priorities of
       the New Anglia LEP. When this is set alongside the fact that the sector is the most specialised and
       fastest growing in the county, it is clear that the LEP, County Council and partners should view
       the sector as important and as part of future thinking.

       Relationship Between Opportunities and New Anglia LEP's Strategic Priorities
                Priority                      Relationship to Sport and Physical Activity Sector
       Life sciences and        Genetic profiling and data self
       biotech
       Technology and digital   Wearable devices, augmented reality, virtual reality
       creative
       Visitor economy          Sporting events (e.g. Ironman, fully-accessible sporting events, multi-
                                sport coastal event) and new sporting venue
       Construction and         New sporting venue and significant upgrades to existing leisure facilities
       development              (e.g. in Deben and Felixstowe)
       Advanced agriculture,    Sports nutrition
       food and drink
       Advanced                 Biomimetics and equipment manufacturing
       manufacturing and
       engineering

       Recommendations
       Partners need to work together to support and accelerate the sector’s positive trajectory…

xv.    The report sets out that partners should work together to help support the growth of the sector.
       Interventions will be most effective if led and driven by a range of different stakeholders from
       across the county. While Suffolk County Council and the Most Active County partnership have
       key facilitative and catalytic roles to play, growth and change will require buy-in and ownership
       from partners.

xvi.   Following consultation with stakeholders a broad set of recommendations have been put
       together to guide future activity. The following recommendation grouping have been identified
       to structure them:

       1)     Infrastructure

                                                     iv
2)     People, participation and productivity

        3)     Enterprise

        The recommendations have been set against each of these groupings with suggested leads and
        stakeholders. These will need to be worked up and developed into formal projects and a
        comprehensive action plan will need to be co-ordinated.

xvii.   To avoid unnecessary duplication, it is suggested the existing Most Active County Partnership
        governance arrangements are utilised to co-ordinate the recommendations. These have
        recently been refreshed to reflect a number of strategic changes at national and local scales –
        the structure now includes an overarching Strategic Group and three thematic Delivery Groups.
        As shown in the figure below, it is recommended that the three Delivery Groups take
        responsibility for the different recommendation groupings from this report. The attendee lists
        for each of these groups will need to be reviewed to take into account the key stakeholders
        identified for the relevant recommendations.

        Relationship between Most Active County Strategic Group and Delivery Groups and the
        recommendation groups emerging from this work

                                                   v
1. Introduction
1.1 Suffolk has an ambition to become the most active county in the country.
1.2 The County Council set up the Most Active County partnership in 2012 to achieve this and ensure
the London Olympic and Paralympic games had a legacy in the region.
1.3 The partnership involves key agencies and organisations collaborating to bring added value to
the work that many organisations across Suffolk are doing to address physical inactivity.
1.4 The programme has catalysed a range of projects across the county which have helped to
increase physical activity levels. It is reported that since it was launched:
• 9,500 more adults are active
• 27,500 more adults are participating in sport and active recreation at least three times a
week
• 29,000 more adults are walking for at least ten minutes at least five times a week
• 9,500 more adults are cycling at least once a week
1.5 The council state that Suffolk is now the 18th most active county in the country (out of 27)1.
1.6 To improve on their current standing, Suffolk County Council has identified a need to develop,
grow and encourage investment in the Sport and Physical Activity economic sectors. This will
require the Most Activity County partnership to engage with a broader range of projects and
stakeholders.
1.7 Hatch Regeneris has been commissioned to begin this work by undertaking a comprehensive
economic assessment of the Sport and Physical Activity sectors in the county. The four key aims
of the commission are to:
1) Provide a detailed overview of the Sport and Physical Activity sectors in Suffolk
2) Assess the value and position of the Sport and Physical Activity sectors in Suffolk
3) Identify major opportunities and future drivers of growth for the Sport and Physical
Activity sectors in Suffolk
4) Propose a series of recommendations to help grow and develop the sectors in Suffolk
The intention is to use the work to broker relationships with key stakeholders across the region
and to develop an appropriate action plan with associated governance structures.
1.8 The rationale for this piece of work is ensure that key organisations understand the role of the
sectors in the regional economy and to help them better support its growth and future direction.
Study Scope
1.9 This study provides a comprehensive overview of the Sport and Physical Activity sectors in
Suffolk. It begins by providing an analysis of the sectors and then considers the economic
opportunities that exist. This is followed by a series of recommendations for consideration. The
report is structured around the following themes:
1
Based on data from Sport England (2015)
1• Study Background
• Sector Analysis
• Economic Opportunities
• SWOT Assessment
• Recommendations
22. Study Background
2.1 This study has been informed by a review of relevant research, policy and strategy at regional
and national scales. This provides an overview of where Suffolk currently is, a platform on which
to build and a framework when considering future strategy. A summary of the most relevant
information is provided below.
Sport and Physical Activity
2.2 Sport and physical activity deliver a wide range of social and economic benefits.
2.3 In terms of social benefits, according to Public Health England (2016) regular physical activity2
can reduce an individual’s risk of:
• Dementia by up to 30%
• Hip fractures by up to 68%
• Depression by up to 30%
• Breast cancer by 20%
• Colon cancer by 30%
• Type 2 diabetes by up to 40%
• Cardiovascular disease by up to 35%
• All-cause mortality by 30%
When considered collectively these benefits can have wider societal impacts.
2.4 In terms of economic benefits, the Sport and Physical Activity sectors generate employment and
contribute to the economy via production, participation and consumption. Economic benefits
accrue through the:
• Production and purchase of sporting equipment
• Attendance at sporting events and fixtures
• Membership of sports and leisure clubs
• Production and purchase of sportswear
• Betting and gambling on sporting events and fixtures
2.5 According to Sport England’s Economic Value of Sport for England (2012), the sport sector
supports over 440,000 full time jobs and contributes £20.3 billion in GVA to the national
economy. Economic contributions by different types of activity are displayed in the table below.
2
Defined as at least 150 minutes of moderate intensity activity in bouts of ten minutes or more each week (for Adults 19-64)
3Table 2.1 Contribution of Different Sporting Activities to England's Economy (2010)
Participation
Sport Education / Voluntary Provision £4.9bn
Sport / Class Subscription Fees £4.4bn
Sports Equipment £1.2bn
Participation Sports £1.2bn
Sportswear (to play sport in) £0.08bn
Consumption
TV/Satellite Subscription £4.4bn
Sports Related Gaming and Betting £1.1bn
Spectator Sports £1.1bn
Sports Equipment (Leisure) £1.5bn
Sportswear (Leisure) £0.4bn
Source: Sport England - Economic Value of Sport for England (2012)
2.6 The social and wellbeing benefits of sports and leisure can also have broader positive economic
impacts. This is because improved health and wellbeing can reduce public expenditure on health
services, increase the size of the available workforce, reduce the number of working days lost to
sickness and, ultimately, increase productivity. Sport England’s Economic Value of Sport for
England (2012) reports that the health and wellbeing benefits of sport and physical activity is
worth £11.2 billion to the nation’s economy and participation in sport delivers £1.7 billion in
terms of savings to the NHS through reduced sickness.
Figure 2.1 Value of Sport and Physical Activity Sectors
2.7 Despite this, outside of funding for elite sport the general Sport and Physical Activity sectors have
not been supported in the same way as other parts of the economy by successive governments.
This is because the direct economic benefits are perceived to be lower value when compared
with other high-profile sectors (e.g. finance, science and technology) and the wider economic
benefits are not well understood and difficult to quantify. This is recognised in the government’s
Sporting Future Strategy (2015), which is discussed later.
Suffolk County Council Priorities
2.8 Suffolk County Council recently published its Our Priorities 2017-2021 report which sets out their
three main priorities:
41) Inclusive Growth: Improve the county’s economic productivity, build more homes and
increase levels of educational attainment.
2) Health, Care and Wellbeing: Care for Suffolk’s vulnerable residents and enable everyone
to live long, healthy and fulfilling lives.
3) Efficient and Effective Public Services: Change the way the council operates to meet
customers’ needs and expectations during a time of diminishing resources.
2.9 The Inclusive Growth priority discusses building on the council’s existing relationship with the
Local Enterprise Partnership (LEP) to support business growth and unlock potential for greater
economic growth in Suffolk. It also sets out an aspiration to continue working with business and
education providers to develop the skills needed for future growth, including expanding the
Apprenticeships Suffolk Network.
2.10 The Health, Care and Wellbeing priority sets out that while Suffolk is a comparatively healthy
place, the council want to improve mental and physical health and improve people’s ability to
live longer. The link between economic growth and health is recognised:
“Suffolk County Council understand that strong, productive and sustainable local economies
need strong healthy and empowered communities and vice versa. They support each other,
creating continuous inclusive growth”.
2.11 Improving participation in sport and physical activity and encouraging growth within the Sport
and Physical Activity sectors could directly contribute to both of these priorities due to the social
and economic benefits it can bring. This piece of work considers the value such action could
have on these priorities and the approaches that can be taken to support them.
Suffolk Public Health Context
Annual Public Health Report (2017)
2.12 Each year Suffolk County Council produces a Public Health Report, which provides a picture of
the county’s current health and wellbeing position and how this relates to the council’s
priorities.
2.13 The most recent report explicitly recognises the link between economic growth and wellbeing.
It states:
“Poverty can increase the chances of living in poor health. People living in more deprived
communities in Suffolk will, on average, live shorter lives and experience greater physical and
mental ill health than those in less deprived communities… Poor health can also drive poverty;
being in poor health makes it harder to find and stay in work”.
2.14 This message is conveyed via their ‘infinity cycle’ (see figure below), which is based on the
principles in the council’s Our Priorities 2017-2021 document.
2.15 As outlined in the table below, the 2017 report addresses a number of key questions related to
the council’s priorities. A number of messages are delivered to illustrate where the county
currently is and what needs to be done to improve its position. Some of the key messages that
are of relevance to this piece of work include:
• Wages in Suffolk are lower than average
• Suffolk has above average levels of people in lower paid professions
5• Educational attainment in Suffolk is relatively low
• The natural environment is one of Suffolk’s key strengths
• Suffolk has low levels of productivity
These messages are based on analysis of data from a range of sources.
2.16 This piece of work explicitly relates to the messages and priorities set out in the annual report as
it explores the role that the Sport and Physical Activity sectors could have in addressing a
number of these concerns and what recommendations and actions could be undertaken.
Figure 2.2 Inclusive Growth and Health and Care ‘Infinity Cycle’
Source: Suffolk Annual Public Health Report
6Table 2.2 Key Messages from the Annual Public Health Report (2017)
Who is working and what does Unemployment rates in Suffolk are lower than average but wages are lower than average
this mean for health? The proportion of working age residents is low
The non working-age population is likely to increase over the next twenty years and people are likely to live longer
Action Point: Create better quality jobs to reduce health inequality and ensure older people stay healthy, independent and productive
How is the economy structured Suffolk has a lower proportion than average of people working in the highest paid professions
and what does this mean for Suffolk has above average levels of people in lower paid occupations (e.g. process, plant and machinery and elementary
jobs and health? occupations)
Those in lower paid occupations often have much lower levels of skills and a higher prevalence of certain health risk behaviours
98.5% of businesses in Suffolk are SMEs and few employees in SMEs are focused on well-being and health
Action Point: Suffolk needs to work collaboratively to support the workplace health and the work-life balance of small and medium
size enterprises in Suffolk
Do people face health and care Good quality work improves health and wellbeing
related barriers to work in Workers in routine and manual roles are at risk of poor health because of the physical nature of their work
Suffolk, and what help does the Ethnic minorities and disabled people are more likely to experience poor working conditions including low pay
working population in Suffolk Action Point: Suffolk needs to improve the health of the working population, particularly for those in routine and manual labour
need to overcome them?
What education and skills do Educational attainment is relatively low
people have in Suffolk and Funding for education is relatively low
what does this mean for jobs Developing Suffolk Talent is a programme actively supporting economic and skills growth in the region
and health? Programmes are also required for older people to help get them back into work
Action Point: Improve education and provide the right support to develop skills to motivate, encourage and sustain a healthy
workforce
Is Suffolk an attractive place to The natural and historic environment is one of Suffolk’s key strengths and access to green and open space is important for health
live and work, and what does House prices are rising against a paucity of high paid employment
this mean for jobs and health? The availability of affordability of high quality homes can reduce the demand on social care and health services
Action Point: The environment needs to be maintained and enhanced as it plays a crucial role in both personal wellbeing and
inclusive growth
How productive is Suffolk and Suffolk’s productivity levels are low, which is likely to link to the low wage and skill profile
what does this mean for jobs Suffolk residents earn less that the Eastern region and Great Britain as a whole
and health? There is a clear link between health and productivity
Action Point: Raising productivity in Suffolk is vital in attracting investment as well as spending the Suffolk pound in Suffolk
6Suffolk in Twenty Years Time
2.17 Building on the Public Health Annual Report, Suffolk County Council recently undertook an
analysis of the county’s social and demographic profile and considered how it could change over
the next twenty years. The purpose was to provide intelligence to help council services plan their
activity over the short, medium and long term.
2.18 Structured around the council’s strategic priorities, the report outlines that Suffolk is currently
quite healthy – it has a higher life expectancy than the rest of the country and is within the least
deprived third of all local authorities3.
2.19 However, the document demonstrates that the total population is forecast to increase by 10%
over the next twenty years and that the proportion of older people (>65) will increase by 50% 4.
Using a range of data sources and assumptions it is reported that this could:
• Almost double the number of people living with dementia from 13,000 in 2015 to 24,300
by 2035
• Increase the number of hospital admissions by 33,000 over the next twenty years which
could require an additional 792 acute beds
• Increase the prevalence of depression by 6000 people between 2017-2037
2.20 One of the key recommendations of the report is to “prevent everything which is possible to
prevent”. This lends itself to this piece of work because, as previously set out, growing and
increasing participation in the Sport and Physical Activity sectors can improve health and reduce
reliance on health and social care.
2.21 Related to this, the report also highlights that adult skill levels are below national levels and that
this correlates with lower than average levels of weekly pay5. While the employment rate is
higher than average, productivity (GVA per worker) is low and the gap between the Suffolk and
national level is forecast to increase from £2.9bn in 2017 to £4.5bn in 20376. This is also relevant
to this piece of work as the role of increasing participation in Sport and Physical Activity on
worker productivity will be considered.
Suffolk County Sports Facilities Framework
2.22 In 2017 Suffolk County Council and Sport England commissioned Neil Allen Associates to
develop a Suffolk County Sports Facilities Framework. The work had a number of objectives, but
the primary three were:
• To provide coherence between individual local authority sports facilities strategies and
seek to add value to them by assessing them from a county perspective
3
Based on data from Public Health England
4
Based on ONS sub-national population projections (2014)
5
Based on Annual Population Survey (2015) and Annual Survey of Hours and Earnings (2016)
6
Based on East of England Forecasting Model (2016) and represents the difference in total GVA Suffolk would produce if
productivity per worker was at the UK average
7• To identify the district and cross boundary scope for project development, investment
and management opportunities for sports facilities that have a ‘greater than local’
significance
• To plan and provide facilities at all scales on a cross boundary basis
2.23 The research demonstrates that if local authority sports facility strategies are delivered in
isolation then it could result in the over provision of facilities in some areas and under provision
in others. It also found that fewer facilities may be needed to meet consumer demand in some
areas if a more joined up approach is taken.
2.24 It also found that national policy and consumer demand is increasingly focusing on a wider range
of facilities and the use of the natural environment for physical activity. Examples of emerging
activities that rely on less traditional facilities include dancing, walking, exercise classes,
climbing, parkour and skating.
2.25 A number of recommendations were made following the research. The two most relevant for this
piece of work are:
1) Provide a major indoor sports hall venue of at least 8-12 badminton courts scale to
meet community needs across local authority areas and serve as an events venue for
indoor sport
2) Provide a 50m swimming pool to meet community needs – its location should serve
more than one local authority area
The report emphasises that these two recommendations could be considered as one project.
2.26 This piece of work will recognise the findings and recommendations of the framework by
mapping the provision of different types of sport and leisure facilities and by considering the
potential economic impacts of a new major sporting venue that serves the needs of residents of
more than one local authority area.
Wider Context
Government Strategy
2.27 The government published their sports and physical activity strategy, Sporting Future: A New
Strategy for an Active Nation, in December 2015. The strategy presents the government’s
approach to tackling inactivity and sets out a framework for development.
2.28 The strategy aims to go beyond assessing how many people participate in sport and physical
activity. It sets out that funding decisions will be made based on the social good that proposals
can deliver. As the figure below illustrates, success is defined by five core outcomes: physical
wellbeing, mental wellbeing, individual development, social/community development and
economic development.
2.29 This approach resonates with this piece of work, which considers the role that the Sport and
Physical Activity sectors can play in economic development and increasing productivity through
things like improved physical and mental wellbeing.
2.30 The economic impact of sport is seen as a fundamental part of the new strategy and government
emphasise that they will ask organisations to not only consider how they contribute to the
nation’s health and/or wellbeing, but also to the local and national economy. The strategy says:
8“In the past, the economic value of sport has been looked at completely separately to the
other public benefits sport can deliver. A significant proportion of the £39bn sport contributes
to the UK’s GDP comes from grassroots sport, the millions of people who buy trainers, bikes,
gym memberships or pay match fees. The government’s investment of £10m in the Tour de
France Grand Départ in 2014 helped unlock a £125m contribution to GDP. So the UK’s
economic success is bound up with our sporting engagement, and vice versa. Sport also plays
a huge role in supporting the GREAT Britain campaign to promote the UK abroad and the UK
was ranked top in a recent analysis of global soft power”.
Figure 2.3 Government’s Sport Strategy Framework
Source: Sporting Future - A New Strategy for an Active Nation (2015)
Sport England Strategy
2.31 Sport England released its strategy, Sport England: Towards an Active Nation 2016-2021, in May
2016. It focuses on putting the government’s Sporting Future strategy into practice by making a
number of changes to their current approach:
• Focusing more money and resources on tackling inactivity because this is where the
gains for the individual and for society are greatest
• Investing more in children and young people from the age of five to build positive
attitudes to sport and activity as the foundations of an active life
• Helping those who are active now to carry on, but at lower cost to the public purse over
time
• Putting customers at the heart of what is done, responding to how they organise their
lives and helping the sector to be more welcoming and inclusive, especially of those
groups currently under-represented in sport
• Helping sport to keep pace with the digital expectations of customers
9• Working nationally where it makes sense to do so (for example on infrastructure and
workforce) but encouraging stronger local collaboration to deliver a more joined-up
experience of sport and activity for customers
• Working with a wider range of partners, including the private sector, using Sport
England’s expertise as well as their investment to help others align their resources
• Working with the sports sector to encourage innovation and share best practice
particularly through applying the principles and practical learning of behaviour change
2.32 As a key funder of sport and sporting infrastructure, it is important to note that a clear ‘line of
sight’ between each investment and the contribution it can make to the overarching outcomes
outlined in Sporting Future has been developed. KPIs directly related to the outcomes have been
created to ensure that investments make a wider social, economic and wellbeing impact. This
holistic approach is of relevance to the aspirations of this piece of work.
Most Active County Partnership
2.33 The Most Active County partnership is a collaboration of key agencies and organisations that
have committed to work together to bring added value to the work that many organisations
across Suffolk are doing to address physical inactivity.
2.34 The partnership estimate that the current level of inactivity is responsible for:
• 1,368 years of poor health being lived by the Suffolk population each year
• 244.6 premature deaths per 100,000 people per year
• An economic burden of £17.7m per 100,000 people
2.35 Launched in February 2012, the partnership recognises that the inactivity agenda is beyond the
scope of any single agency and that effective partnerships are fundamental to successfully
increasing activity. Those involved include county, district and borough councils, the county
sports partnership (Suffolk Sport), the voluntary and community sector, leisure trusts and health
agencies.
2.36 The broad themes of the Most Active County partnership are:
• Addressing inequalities in sport and physical activity participation
• Providing a universal offer for the community
• Maximising the economic impact for Suffolk from efforts to grow participation in sport
and physical activity
2.37 The partnership has recently undergone a review in order to respond to the recommendations
of the recently published Suffolk Physical Activity Needs Assessment. The new structure
specifically recognises the importance of economic development and infrastructure (amongst
other things) in addressing inactivity levels in the county going forward and includes a delivery
group providing a more formal basis for cross-agency collaboration in this area. This economic
assessment provides important foundations for this work going forward.
Norfolk and Suffolk Economic Strategy
2.38 The New Anglia LEP is a business-led collaboration between the private, public and education
sectors across Suffolk and Norfolk. They recently published their Economic Strategy, which
10examines the composition of the local economy, identifies themes and priority places for
investment and sets targets to measure future growth.
LEP Targets
• Creation of 88,000 new net jobs by 2036
• Delivery of 140,000 new homes by 2036
• £17.5 billion growth in the economy by 2036
• 30,000 new successful businesses by 2036
2.39 The LEP identify nine key sectors for future growth: energy; life sciences and biotech; ICT, tech
and digital creative; advanced agriculture, food and drink; visitor economy; financial services
and insurance; transport, freight and logistics; construction and development; and, advanced
manufacturing and engineering.
2.40 While the Sport and Physical Activity sectors are not explicitly identified, there are sub-sectors
and activities associated with them that link to the sectors outlined above. For example, as will
be discussed later in the report:
• Sporting events and activities relate to the visitor economy
• Developments in sports nutrition, energy drinks and alternative diet products relate to
advanced agriculture, food and drink
• The growth around wearable technology, virtual reality and augmented reality for sport
and physical activity presents opportunities for the ICT, tech and digital creative sectors
• New sporting venues can contribute to the growth of the construction and development
industries
2.41 Any discussions with the LEP will need to be cognisant of this and the four priority themes
outlined in the table below. Opportunities for growth within the Sports and Physical Activity
sectors are discussed later in this report and are considered with these sectors and priorities in
mind.
Table 2.3 New Anglia LEP's Priority Themes
Our offer to the world “Improving and communicating a clear, ambitious offer to the world is central to all
our ambitions and targets and to attracting the people, investors and businesses of
the future”.
Driving inclusion and “Our people, whether in traditional careers, micro businesses, arts and culture or
skills supporting others in the community, are central to all our ambitions and goals. We
want to raise and support aspiration across all ages. Good progress has been made in
raising skill levels, but we want to go further and faster, particularly for those already
in work. We will help our young people set their ambitions high and understand the
exciting local careers available to them”.
Collaborating to grow “The competition we face does not come from within Norfolk and Suffolk. Many of
the opportunities we have come from our proximity to Cambridge and London as
well as global markets. The new markets and investment opportunities we seek are
national and global”.
Competitive clusters close “Within our business sectors, Norfolk and Suffolk have a number of recognised
to global centres national and global clusters of business, with excellent access to national and global
markets and to London and Cambridge”.
Source: Norfolk and Suffolk Economic Strategy (2017)
112.42 It should also be recognised that the LEP has six priority locations for investment across the
region: Ipswich, Norwich and Greater Norwich, Norfolk and Suffolk Energy Coast, Cambridge-
Norwich Corridor, East-West Corridor and King’s Lynn. Any proposals and discussions with the
LEP would need to consider linkages with one or more of these locations.
123. Sector Analysis
Sector Definition
3.1 The Sport and Physical Activity sectors encompass a wide range of business and employment
activities that can be categorised by participation, consumption and production activities.
3.2 To define the sectors for this study Hatch Regeneris have used Standard Industrial Classification
(SIC) code definitions, specific descriptions used to describe a company’s planned activity. SIC
Codes are designated by the owner at company formation, using only the description of activity
stated to assign the best fit for the company.
3.3 Hatch Regeneris have considered SIC code definitions from the Department of Media, Culture
and Sport (DCMS), Sport England and the Office of National Statistics (ONS). The definition that
has been used for this piece of work draws on each of them (see table below), but certain
activities have been excluded where there is ambiguity over their contribution to the sector and
where they do not directly link to physical activity.
3.4 This definition has been used to undertake the statistical mapping of the Sports and Physical
Activity sectors and to inform supporting qualitative analysis. The rest of this chapter provides a
detailed overview of the sectors and the role they play in the regional economy.
Table 3.1 Definition of the Sport and Physical Activity Sectors
Sector Activities Sector Definitions
SIC Sport
Activity DCMS ONS Regeneris
Code England
85510 Sports and
✓ ✓ ✓
recreation education
93110 Operation of sports
✓ ✓ ✓ ✓
facilities
93120 Activities of sport
✓ ✓ ✓ ✓
Participation clubs
93130 Fitness facilities ✓ ✓ ✓ ✓
93191 Activities of
✓ ✓ ✓ ✓
racehorse owners
93199 Other sports
✓ ✓ ✓ ✓
activities
47640 Retail sale of
sporting equipment ✓ ✓ ✓
in specialised stores
77210 Renting and leasing
of recreational and ✓ ✓ ✓
sports goods
Consumption
60200 Television
programming and
✓
broadcasting
activities
92000 Gambling and
✓
betting activities
30120 Building of pleasure
✓ ✓
and sporting boats
Production
32300 Manufacture of
✓ ✓ ✓
sports goods
13Sport and Physical Activity in Suffolk
SUFFOLK’S SPORTS AND PHYSICAL ACTIVITY SECTOR
Figure 3.1 Headline Statistics
10,000 700 2 TIMES MORE
SPECIALISED THAN
EMPLOYED BUSINESSES ENGLAND
£190M SALARY £270M GROSS VALUE
GENERATED PER ANNUM ADDED PER ANNUM
+60% EMPLOYMENT 25% OF ALL NET
GROWTH IN LAST 5 YEARS EMPLOYMENT GROWTH IN
SUFFOLK
55% OF EMPLOYMENT 1 IN 4 BUSINESSES IN
IN SPORTS CLUBS AND SECTOR INVOLVED IN
FACILITIES RACEHORSE ACTIVITIES
The Sport and Physical Activity sector is better represented than in wider geographies and is
comparable in size to other key sectors…
3.5 The Sport and Physical Activity sector is made up of around 10,000 jobs in Suffolk, which
represents 3% of all employment. The sector is the tenth largest in Suffolk and is relatively small
compared to others.
3.6 That said, the proportion of Suffolk’s employment in the Sport and Physical Activity sector is
almost double the proportion at the national level and across the rest of the East of England (not
including Suffolk). It is one of only three sectors in Suffolk that accounts for a larger proportion
of employers than the wider geographies.
3.7 The sector is also similar in size to traditionally well established and high value sectors. For
example, employment in the sector is larger than the ICT & Digital and Creative sectors in Suffolk
and is comparable to the average proportion of Transport and Wholesale employment usually
found in the East of England and England.
14Figure 3.2 Proportion of Total Employment by Sector, 2016
Public Sector
Retail
Manufacturing
Finance and Professional
Business Support
Hospitality & Leisure
Construction
Transport
Wholesale
Sports and Physical Activity
ICT & Digital
Warehousing and Logistics
Other Services
Creative Sector
0% 5% 10% 15% 20% 25%
Source: BRES, ONS, 2017
Note: Agriculture & Mining and Utilities & Waste sectors not included
Employment in the sector has grown at a faster rate than all other sectors in Suffolk and faster
than the Sport and Physical Activity sector in wider geographies…
3.8 Employment in the Sport and Physical Activity sector has grown by nearly 60% over the last five
years, generating an additional 3,600 jobs for Suffolk’s economy. This accounts for around a
quarter of all employment growth in Suffolk over the last five years.
3.9 The sector has grown faster than all other sectors in Suffolk and at a higher rate than the average
for both the East of England and England. It is one of only two sectors in Suffolk’s economy that
has outperformed both comparator geographies in terms of proportional growth.
15Figure 3.3 Percentage Change in Total Employment by Sector, 2011-16
Sports and Physical Activity
Business Support
Transport
ICT & Digital
Warehousing and Logistics
Financial and Professional
Hospitality & Leisure
Construction
Retail
Creative
Other Services
Public Sector
Manufacturing
Wholesale
-20% -10% 0% 10% 20% 30% 40% 50% 60%
Source: BRES, ONS, 2016
The Sport and Physical Activity sector is the highest performing sector in Suffolk in terms of
specialisation and growth…
3.10 The composition and recent performance of Suffolk’s economy is displayed in the chart below.
It highlights absolute employment levels (the size of the bubble), recent growth (vertical axis)
and level of specialisation (i.e. share of total employment) vs England (horizontal axis).
3.11 Analysis highlights that the Sport and Physical Activity Sector has performed most strongly in
comparison to other sectors, with nearly two times the specialisation compared to England and
the highest rate of growth (as previously discussed).
3.12 Other key sectors in Suffolk’s economy include:
• Business Support: the sector has experienced a high rate of growth in recent years,
although is not highly specialised vs England
• Transport: the sector has experienced some growth in recent years and is highly
specialised vs England
• Retail: some specialisation and growth and the second largest sector in Suffolk’s
economy
• Public Sector: despite a decline in employment in recent years and no specialisation vs
England, the sector is still the largest in Suffolk’s economy
16Figure 3.4 Sector Performance in Suffolk
60%
50% Sports and
Business Physical Activity
Support
40%
Employment Growth 2011-16
30%
20% Hospitality
Finance and & Accom Transport
10% Professional
Construction
Retail
0%
Public Sector Manufacturing
-10%
Wholesale
-20%
0.0 0.5 1.0 1.5 2.0
Employment Specialisation vs England
Source: BRES, ONS, 2017. Note: Largest ten sector shown only.
Bubble Size: denotes absolute employment; Largest ten sectors only.
Employment Specialisation: numbers show the specialisation (location quotient) of the sub-sector in an area relative to England.
A score above 1 shows higher specialisation of activity in the sub-sector compared to the average in England.
3.13 The table below summarises the employment data used in the graph above and business data.
17Table 3.2 Suffolk’s Sport and Physical Activity Sector Sub-Sector Breakdown
Employment Business
Sub Sector Change Change
No. Spec* No. Spec*
11-16^ 12-17^
Public Sector 75,320 0.9 -5% 1,890 1.0 26%
Retail 40,150 1.2 2% 3,020 1.1 2%
Manufacturing 32,240 1.3 -6% 1,620 1.1 -1%
Finance and Professional 31,970 0.7 13% 5,080 0.8 21%
Business Support 30,200 1.1 44% 1,970 0.8 31%
Hospitality & Accommodation 27,090 1.0 9% 2,020 1.1 7%
Construction 17,710 1.2 7% 3,980 1.1 14%
Transport 17,140 1.7 15% 1,170 1.3 35%
Wholesale 11,970 0.9 -15% 1,180 1.0 -5%
Sport and Physical Activity 9,900 1.8 56% 690 1.8 12%
ICT & Digital 7,790 0.7 14% 1,340 0.6 10%
Warehousing and Logistics 5,910 1.0 13% 300 0.8 28%
Other Services 5,680 1.0 -4% 1,180 1.2 7%
Creative 4,030 0.5 -3% 1,200 0.7 9%
Grand Total 322,530 - - 29,330 - -
Source: BRES, ONS, 2017; UK Business Count, ONS, 2018. Note: Agriculture & Mining and Utilities not included.
*Spec. (Specialisation): numbers show the specialisation (location quotient) of the sector relative to England. A score above 1
shows higher specialisation of activity in the sector compared to the average in England – these are highlighted in blue.
^ % change: percentage growth estimates from small sample sizes are more prone to methodological outliers and should be
used with caution. Cells highlighted blue have employment growth of greater than 50% over the last five years.
There is a diversity of sport and physical related activities in Suffolk, although a large
proportion of employment involves sports clubs and facilities…
3.14 There are a range of sub-sectors within the Sports and Physical Activity sector in Suffolk,
including those associated with clubs, facilities, retail and manufacturing.
3.15 Employment is dominated by activities associated with sports clubs and the operation of sports
facilities – the former supports around 3,000 jobs and the latter 2,500. While employment in both
has grown since 2011, employment associated with sports clubs has outpaced sports facilities
and has overtaken it as the most prominent employment activity within the sector. Research
indicates that a large proportion of growth in sports clubs is driven by employment growth
within Ipswich Town Football Club.
3.16 Whilst activities of sports clubs and the operation of sports facilities are likely interconnected, a
clear distinction exists – the operation of sports facilities provides a service in a fixed premises
or location, whereas the operation of sports clubs are facilitating an activity not necessarily fixed
to a specific premises or location. There is likely to be some ambiguity given that SIC Code
definitions are defined by individual business owners.
3.17 Employment in “other sports activities” is the third largest subsector and has experienced the
second highest growth (+150%) of all subsectors. There is a level of ambiguity on what the
subsector includes as it captures other sports activities not elsewhere classified. Data shows the
majority of employment is located in a small area around Newmarket Races – given that the
subsector definition of “activities of racehorse owners” is specific to owners, it’s likely that other
racehorse businesses will define themselves under this subsector. This suggests employment
related to racehorse activities is captured within “other sports activities” and is therefore
significantly higher than the levels presented below.
18Figure 3.5 Total Sport and Physical Activity employment, 2011 - 2016
Activities of sport clubs 3,000
Operation of sports facilities 2,500
Other sports activities 1,500
Retail sale of sporting equipment 800
Sports and recreation education 700
Fitness facilities 500
Renting/leasing of rec. & sports goods 400
Manufacture of sports goods 230
Activities of racehorse owners 180 2016
Building of pleasure & sporting boats 100 2011
0 1,000 2,000 3,000 4,000
Source: BRES, ONS, 2017; UKBC, ONS, 2018
3.18 Renting and leasing of recreation and sports goods has also experienced high proportion growth,
driven by new rental businesses in the South East of the county and near Dedham Vale. Renting
and leasing for recreational sport is important to support sporting activities using natural assets
(such as canoeing) and to capture additional spend from large sporting events (such as cycling).
3.19 Business number across all other activities has increased or remain static since 2012.
3.20 As the Table 3.3 below shows, Suffolk is specialised for all these sub-sectors in terms of
businesses vs England and for many of them in terms of employment.
Table 3.3 Sport and Physical Activity Sector Sub-Sector Breakdown
Employment Business
Sub Sector No. Change No. Change
Spec* Spec*
(2016) 11-16^ (2017) 12-17^
Activities of sport clubs 3,000 0.8 +70% 150 1.7 -14%
Operation of sports facilities 2,500 4.1 +10% 60 1.1 0%
Other sports activities 1,500 0.9 +148% 120 2.0 +71%
Retail sale of sporting equipment 800 4.1 +59% 70 1.2 0%
Sports and recreation education 700 3.4 +55% 50 1.3 +25%
Fitness facilities 500 1.5 +66% 40 1.3 +100%
Renting/leasing of rec. & sports goods 400 2.0 +430% 20 1.2 +50%
Manufacture of sports goods 230 1.0 +49% 20 1.7 +50%
Activities of racehorse owners 180 11.5 +16% 170 5.3 +6%
Building of pleasure & sporting boats 100 3.6 +32% 10 1.7 0%
Total 9,900 1.8 +56% 690 1.8 +12%
Source: BRES, 2017; UKBC, 2018
*Spec. (Specialisation): numbers show the specialisation (location quotient) of the sub-sector relative to England. A score above
1 shows higher specialisation of activity in the sub-sector compared to the average in England – these are highlighted in blue.
^ % change: percentage growth estimates from small sample sizes are more prone to methodological outliers and should be
used with caution. Cells highlighted blue have employment growth of greater than 50% over the last five years.
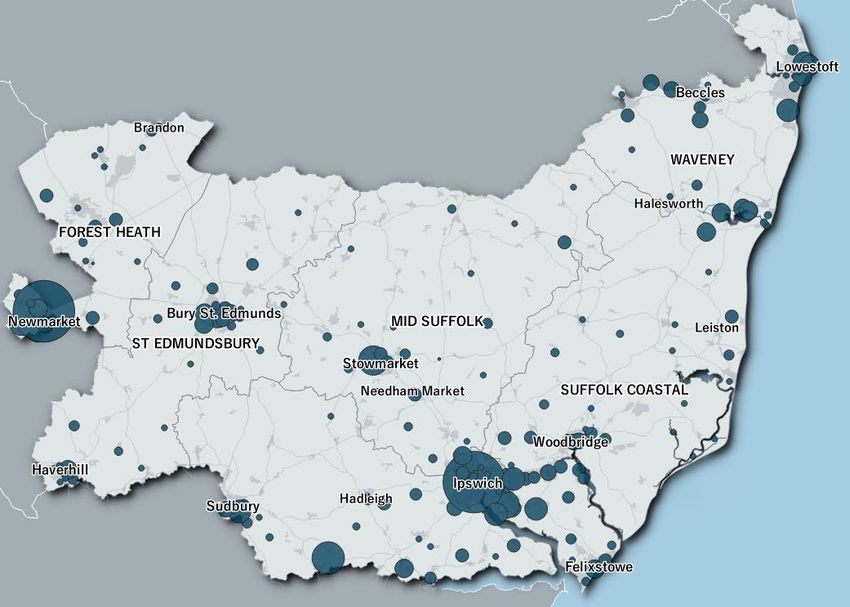
19Most Sport and Physical Activity employment is concentrated in a small number of districts…
3.21 Sport and Physical Activity employment is spread across the county, but the majority is
concentrated in the districts of Forest Heath (24%), Ipswich (22%) and, to a lesser extent, Suffolk
Coastal (15%). Mid Suffolk has the smallest proportion of sector employment (7%) despite being
home to 12% of the working age population.
3.22 All districts have experienced growth in the sector in the last five years, with the majority growing
by over 50%. Employment in Babergh has nearly doubled in the last five years, with an additional
540 jobs in the district.
Figure 3.6 Total Employment in Sport and Physical Activity Sector by district, 2016
Forest Heath 2,340
Ipswich 2,120
Suffolk Coastal 1,420
Babergh 1,140
St Edmundsbury 1,040
Waveney 1,030 2016
Mid Suffolk 2011
680
0 500 1,000 1,500 2,000 2,500
Source: BRES, ONS, 2017
Sector activity is distributed across the county, with strong clusters of activity in and around
the main town centres…
3.23 At the county level sector activity is dispersed, but mainly concentrates around main town
centres (see Figure 3.7). Sport and physical activities are also found in more rural areas, although
there remain large pockets with little or no representation (for example, towards the north west
of Babergh district and in northern areas of Mid Suffolk district).
3.24 Other clusters of sports and physical activity employment include: a large corridor of sports and
physical activity employment along the A14 from Bury St Edmunds to Ipswich; a corridor heading
eastward from Ipswich along the A1214; a concentration east of Halesworth in the Suffolk Coast
National Nature Reserve; and a large concentration around Newmarket racehorses.
3.25 Further mapping undertaken as part of this research shows that there are several spatial trends
related to the sub-sectors previously discussed:
• Activity related to racehorse activities is concentrated in Newmarket which is home to
the Newmarket Racecourses
• Employment associated with sports clubs is greatest in Ipswich but is also prominent in
several other towns (e.g. Newmarket, Bury St Edmunds and Sudbury)
• Most employment associated with the manufacture of sporting goods is in Lowestoft
which is home to Harrod Sport
20You can also read