Supplement of Aerosol characteristics at the Southern Great Plains site during the HI-SCALE campaign
←
→
Page content transcription
If your browser does not render page correctly, please read the page content below
Supplement of Atmos. Chem. Phys., 21, 5101–5116, 2021
https://doi.org/10.5194/acp-21-5101-2021-supplement
© Author(s) 2021. CC BY 4.0 License.

Supplement of
Aerosol characteristics at the Southern Great Plains site during
the HI-SCALE campaign
Jiumeng Liu et al.

Correspondence to: John E. Shilling (john.shilling@pnnl.gov)

The copyright of individual parts of the supplement might differ from the article licence.
Aerosol acidity estimated using ISORROPIA II

To estimate aerosol pH during spring and summer IOPs, ISORROPIA II was run with hourly-
averaged data (including concentrations of aerosol-phase species, ambient temperature and
relative humidity) as input. Hourly-averaged data were deployed considering that equilibrium
states are typically achieved within 30 minutes under ambient conditions for submicron aerosols
(Fountoukis et al., 2009). To simplify the simulations, ISORROPIA-II was run assuming particles
are “metastable”. It is also assumed that the particles are internally mixed and that pH does not
vary with particle size (so that bulk properties represent the overall aerosol pH).

Because of limitations in input data, e.g., no gas phase NH3 data available on site, and SO2 only
available for spring IOP, the calculation was done in an “iteration” way. We use the measured
aerosol-phase data as initial input, run ISORROPIA in the “forward” mode to predict gas-phase
concentrations of NH3, HNO3 and HCl, and use the sum of predicted gas-phase and measured
aerosol-phase concentrations as the input for next round. After ~ 20 rounds of iteration, the
differences of predicted gas-phase concentrations from adjacent rounds, and differences between
predicted and measured aerosol-phase concentrations, were limited within 10%, i.e., comparable
with measurement uncertainties. The results were further constrained with the NH3 levels from
nearby sites in the AMON network (Atmospheric Ammonia Network,
http://nadp.slh.wisc.edu/amon/).
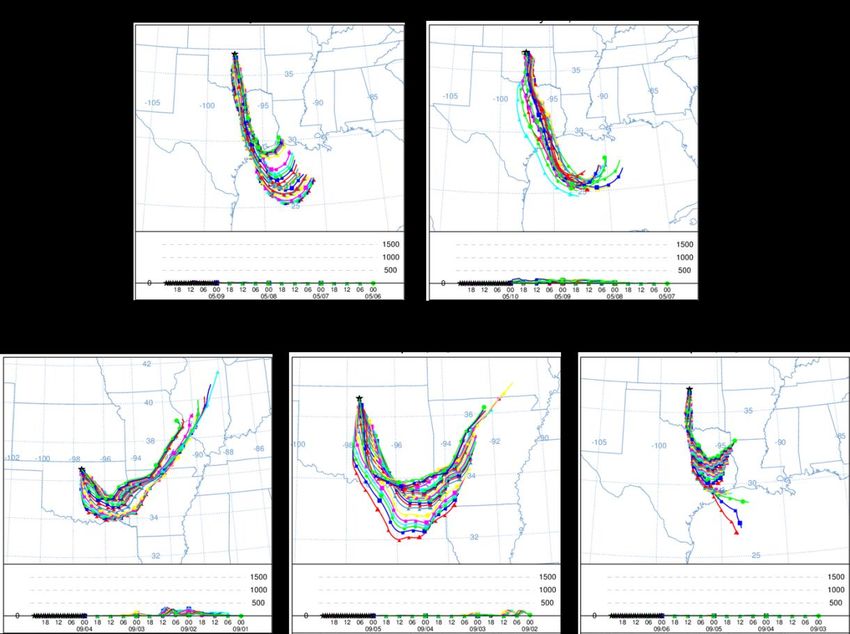
Figure S1. Map of the SGP site (green dot) and surrounding area. The plot is from the webpage of
ARM SGP site (https://www.arm.gov/tour/sgp-overview.html).
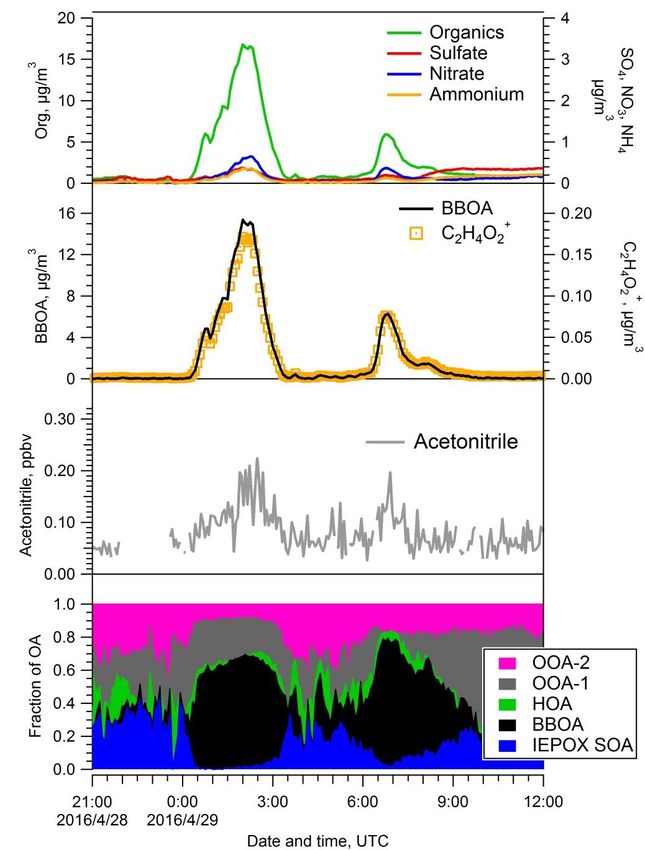
Figure S2. Ion balance for both the spring- (left) and summer- (right) IOPs. Cation equivalence is
 4 2• 4 3
calculated as , anion equivalence is calculated as + + . The grey line indicates
 18 96 62 35.5

full neutralization.
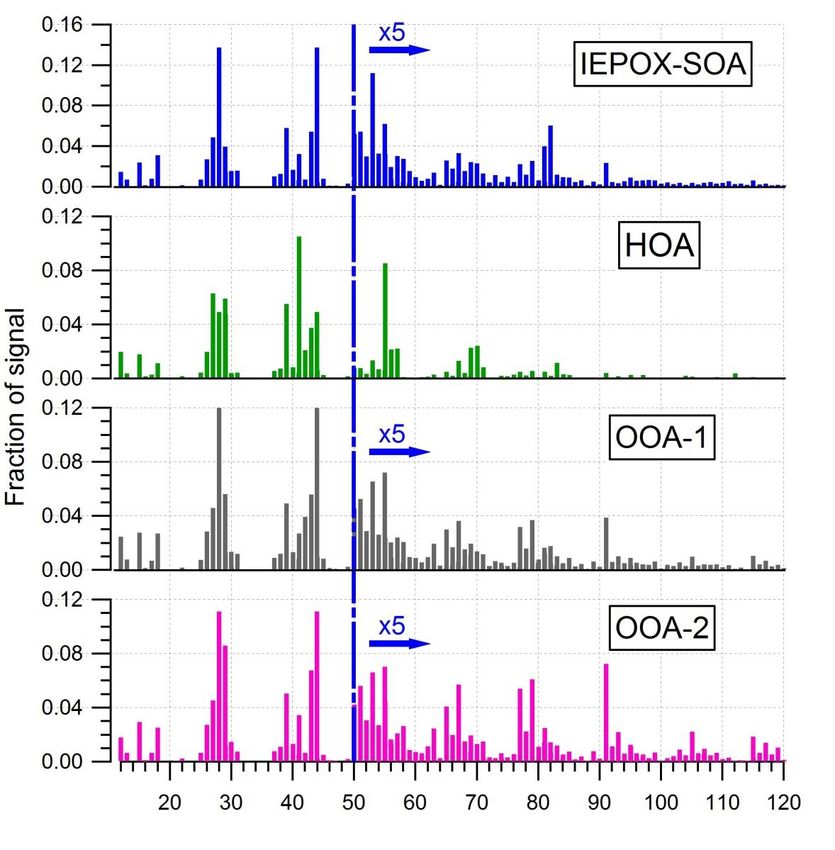
Figure S3. 72-h HYSPLIT trajectory analyses of air arriving at the SGP site for the indicated days
during the summer IOP. During these days, high concentrations of biogenic and anthropogenic
VOC precursors were observed.
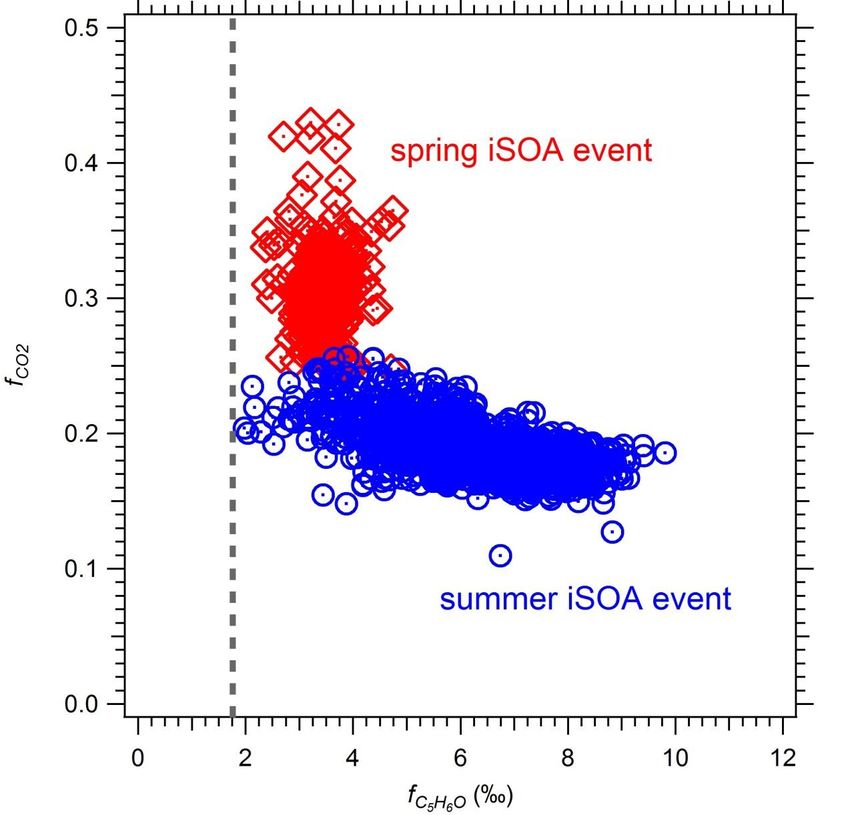
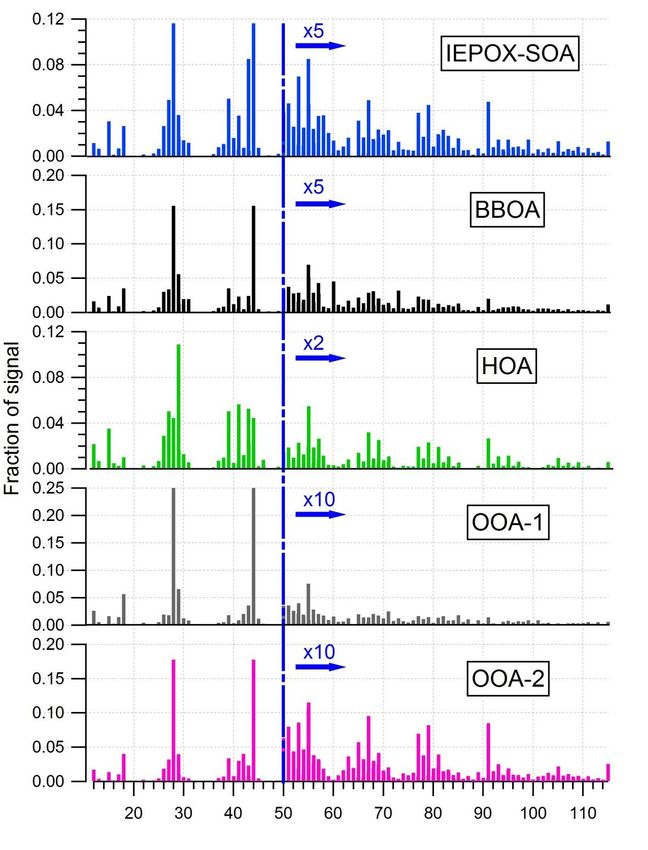
Figure S4. Mass spectral profiles of the 5-factor PMF solution chosen for the spring IOP data.
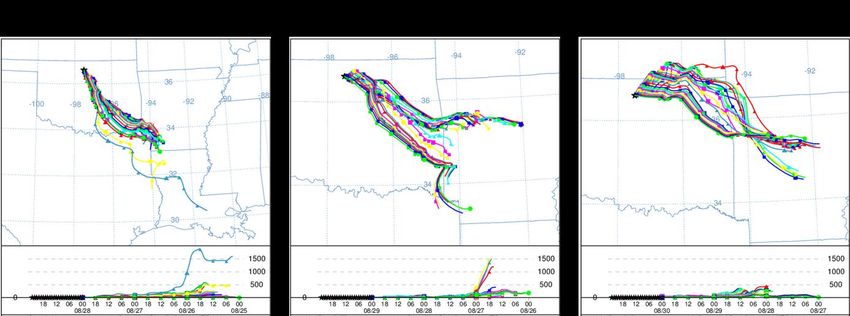
Figure S5. Time-series of BBOA, HOA and CO for the spring IOP.
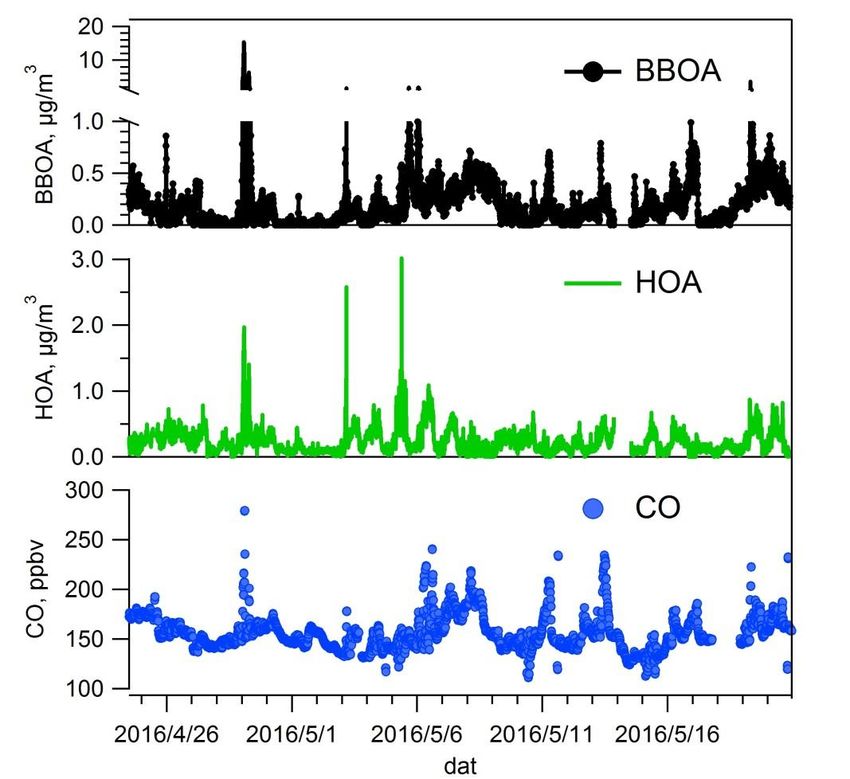
Figure S6. Mass spectral profiles of the 4-factor PMF solution chosen for the summer IOP data.
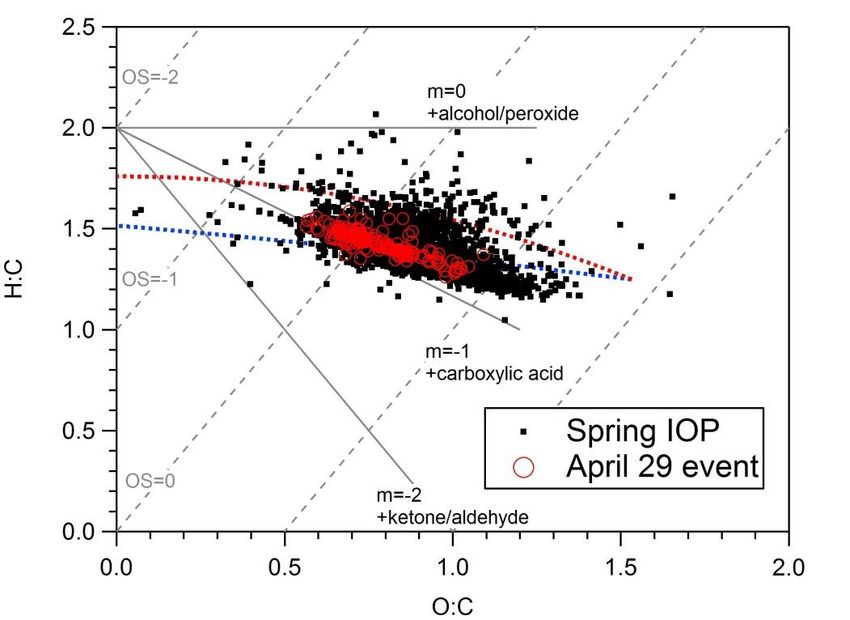
Figure S7. 72-h HYSPLIT trajectory analyses for air arriving at the SGP site during the spring
and summer IEPOX SOA events. The top panel shows the back trajectory for the days covering
the spring iSOA event, while the bottom figures are for the summer iSOA event.
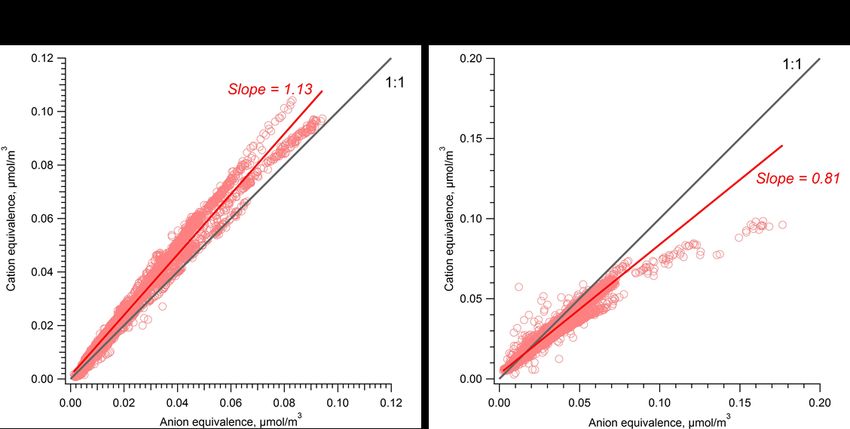
Figure S8. Scatter plot of fCO2 and fC5H6O during the spring iSOA and summer iSOA events. The
grey line represents background levels (quoted from Figure 5 in Hu et al., 2015).
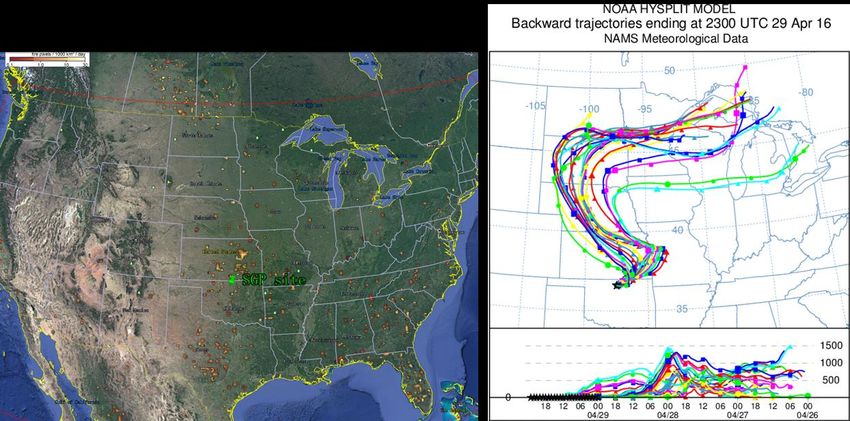
Figure S9. Fire map retrieved from Terra/MODIS satellite observations for April 22-29, 2016
(left, created using © Google Earth), and NOAA HYSPLIT back trajectory paths for the biomass
burning events observed at the SGP site on April 29, 2016 (right).
Figure S10. Van Krevelen plot of bulk organic aerosols for the spring IOP (black dots), and
during the biomass burning event on April 29, 2016 (red circles).
Figure S11. Temporal evolution of AMS-reported chemical species, BBOA (resolved by PMF
analyses), C2H4O2+, acetonitrile, and the mass fraction of all PMF-resolved factors during the
April 29 biomass burning event.
References
Fountoukis, C., Nenes, A., Sullivan, A., Weber, R., Van Reken, T., Fischer, M., Matías, E., Moya,
 M., Farmer, D., and Cohen, R. C.: Thermodynamic characterization of Mexico City
 aerosol during MILAGRO 2006, Atmos. Chem. Phys., 9, 2141-2156, 10.5194/acp-9-
 2141-2009, 2009.
You can also read