Performance evaluation of low-cost PM sensors deployed in Pittsburgh, PA - EPA
←
→
Page content transcription
If your browser does not render page correctly, please read the page content below
Performance evaluation of low-cost
PM sensors deployed in Pittsburgh, PA
                     R Subramanian subu@cmu.edu
                Carl Malings cmalings@andrew.cmu.edu
              Albert Presto, Rebecca Tanzer, Allen Robinson
   Center for Atmospheric Particle Studies, Carnegie Mellon University

              Presented at the Air Sensors 2018 workshop
      Session 6. PM Focus: Perspectives on Data Quality Objectives
                            US EPA, RTP, NC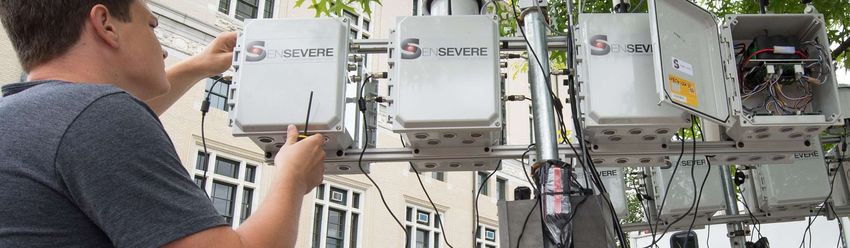
Acknowledgments
• CAPS:
   • Naomi Zimmerman (now faculty at University of British Columbia)
   • RAs: Aliaksei Hauryliuk, Srini Kumar
• Funding:
   • US EPA STAR RD83628601 and RD83587301
   • Heinz Endowments
• Allegheny County Health Department
   • Operate the local regulatory network used to test the PM sensors

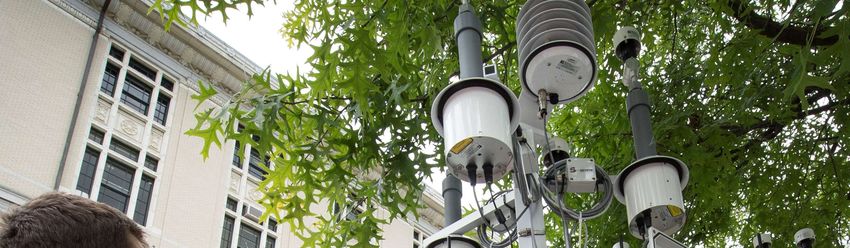
Real-time Affordable Multi-Pollutant (RAMP) monitor
• Measures CO, O3, NO2, SO2
• Fine particulate mass, PM2.5
   • PurpleAir, $200/unit
      • Two Plantower 5003 sensors
   • Met-One NPM, $2000/unit
   • AlphaSense OPC-N2, $400/unit
      • Tested, but not deployed

• Tested by collocation with
  reference monitors
                                                 3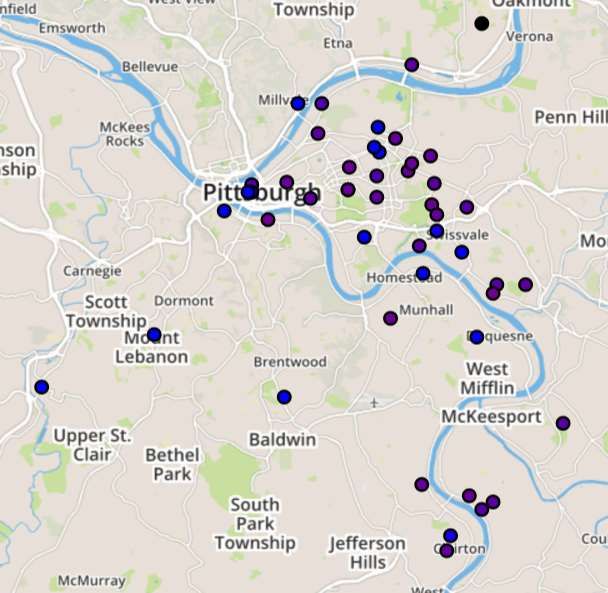
Use cases for low-cost sensors
• Community awareness and citizen science
   • Rapid dissemination, trends
• Hot spot detection in urban areas
   • Regulatory monitors are sparse and often in urban background
• Spatial and temporal variability in air quality across an urban area
   • Annual averages across ACHD network vary by
Community awareness and citizen science
• Trends, plumes, spatial variability…?
• Official data often 3-4 hours behind
• Inversions build up overnight, is it clear again? (Mark Dixon, @inversion_doc)
• Fog and high humidity interference can create false positives/show
levels up to two times higher than regulatory-equivalent
• check RH levels and characterize sensor response
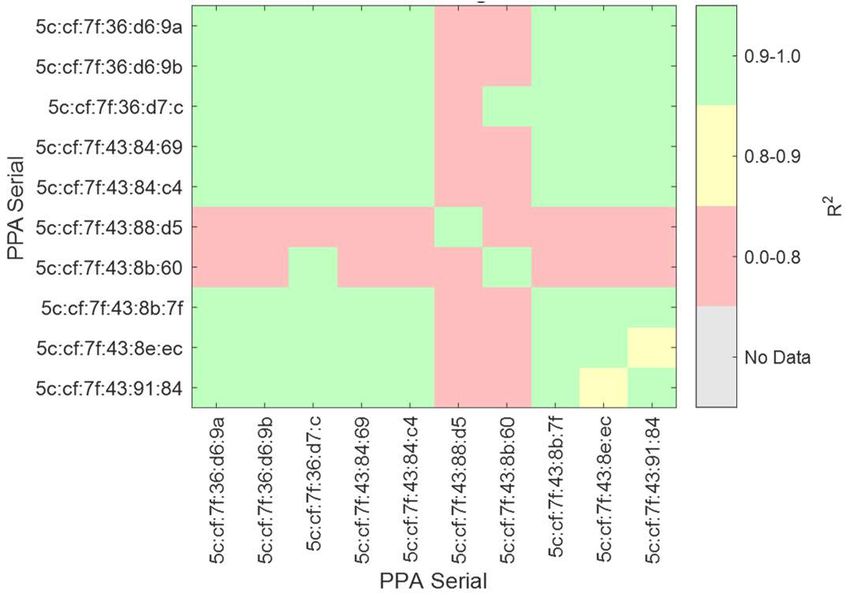
• Sensor error should not be interpreted as differences in PM levels
• Collocated testing of PM sensors necessary
• Manufacturer-tested sensors may still read erroneously. Dual sensors useful
for in-use QA.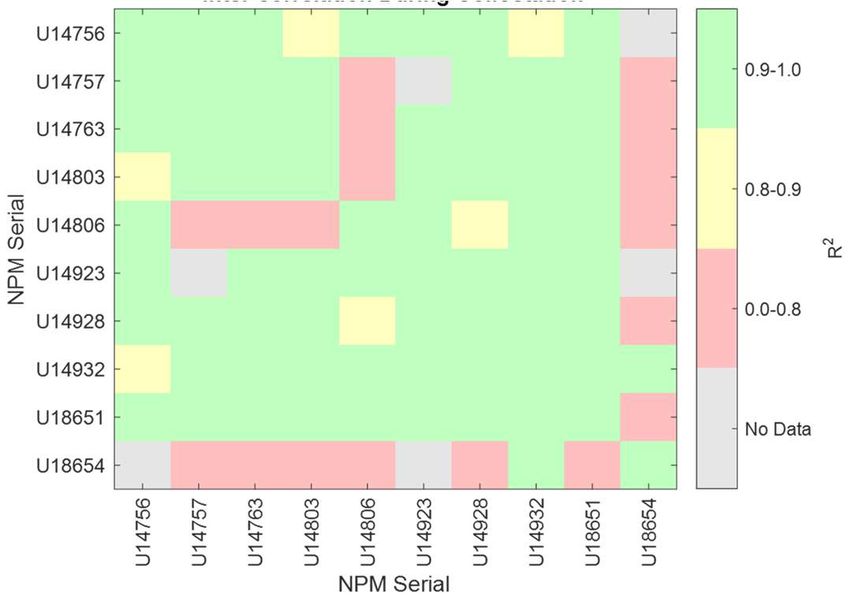
Met-One NPM                   PurpleAir PM

                                             >0.9
               >0.9
                                             >0.8
               >0.8
RAMP deployments in                         East Liberty

Allegheny County, PA             Downtown

• 50 RAMPs currently
  deployed across Pittsburgh,
                                                            Braddock
  Clairton, and Braddock
• Inter-RAMP distance ~1 km
• Collaboration with Albert
  Presto and Allen Robinson
• Risk perception: Julie Downs

                                                           Clairton
                                                              7
Hot spot detection

• Data from PM monitors across
  Pittsburgh – one site stands out
• As-reported data good enough?

Scientific objectives

• Can well-characterized sensors detect
  changes of
Weekly statistics: NPMs at ACHD sites

                              Lawrenceville
                              Lincoln
Summary/for discussion • Collocation testing is important for all use cases • Collocation with regulatory monitors across the expected range of concentrations and environmental conditions can be very helpful • Correction factors can be relatively simple with scientific guidance • Data quality assessment: • EPA “precision error” and “bias error” metrics are a bit mystifying • Pearson r or correlation coefficient (r2) evaluates precision • Mean Absolute Error (MAE) or CvMAE bounds depend on the use case • Performance and corrections can depend on PM concentrations
Session Questions
• Provide your views on data quality objectives, data quality indicators,
  and target values that would be relevant to determining future
  performance targets for PM.
• Which technical parameters would constitute the DQOs/DQIs? And
  what values or range of values would they comprise?
You can also read