Monitoring the Etna 2021 eruption using EO optical data
←
→
Page content transcription
If your browser does not render page correctly, please read the page content below
Monitoring the Etna 2021 eruption using EO optical data
Since 16 February, 2021 Etna experienced 11 paroxysmal episodes at the South East Crater (SEC) with lava fountains over
1000 m high, small pyroclastic flows, fast lava flows, sustained eruptive columns reaching more than 10 km elevation a.s.l.
Monitoring the Etna 2021 eruption using EO optical data

 Contributors:
 G. Ganci, E. De Beni, G. Bilotta, C. Proietti, A. Cappello – INGV Catania
 S. Corradini, L. Merucci, D. Stelitano, L. Guerrieri – INGV Roma

 Contact: gaetana.ganci@ingv.it
MAST (Multimission Acquisition SysTem)
                   INGV – Rome [Stelitano et al., 2020]
               D. Stelitano, L. Guerrieri, L. Merucci, S. Corradini
             Near Real Time processing of MSG-SEVIRI data
       with temporal resolution of 15 minutes (96 images per day)

    Exploiting the TIR channels centered @
               8.7, 11 and 12 mm
                                                  Monitoring during both
                                                     day and night

Volcanic Cloud Detection (SO2, Ash, Ice)                              Volcano Monitoring (DPC), Air flight Safety
Volcanic Height Retrievals (Column and Cloud)                         (VAAC), Airport Security, Inputs for Volcanic Ash
Volcanic SO2 (Mass), Ash (Mass, AOD, Re),                             Transport and Dispersal Models (VATDM),
                 Ice (Mass, AOD, Re) retrievals                       Impact on environment and climate

            All the 10 February-March Etna events have been detected and processed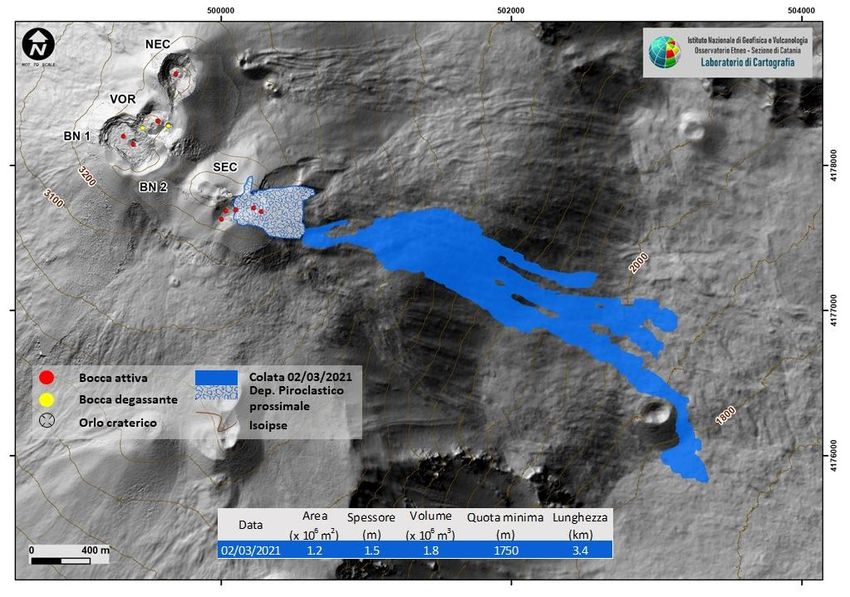
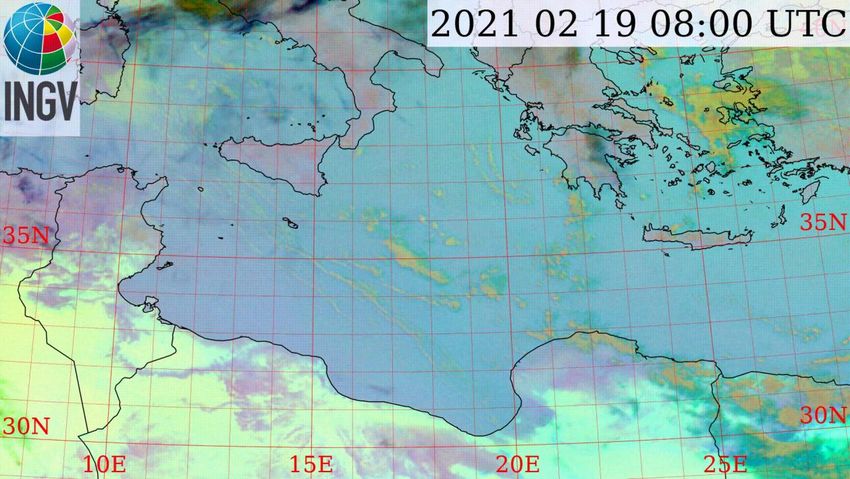
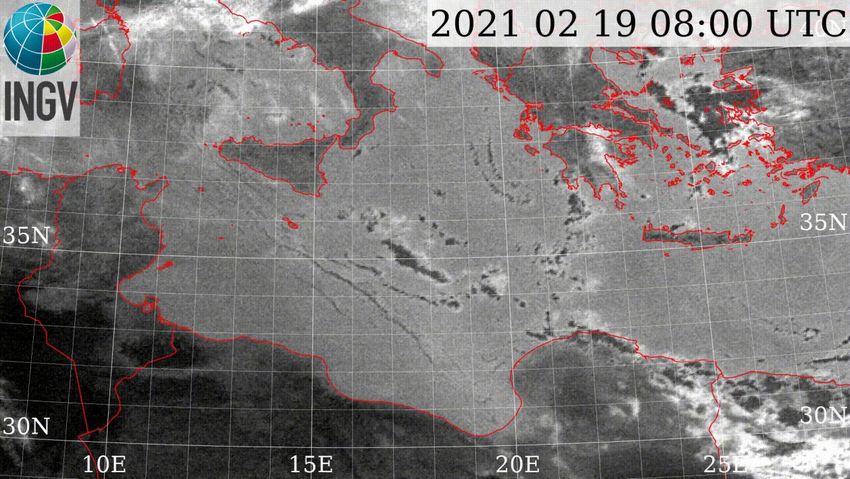
RGB combination                       19 February 2021          BTD (Tb (11 μm) – Tb (12 μm))
(channels: 8.7, 11 e 12 μm)                                                 BTD < 0: Ash Cloud
Red Cloud: high Ash content         Volcanic Cloud Detection                 BTD > 0: Ice cloud
Green Cloud: high SO2 content

                        Volcanic Column
                             Height
                                          Volcanic Height        Volcanic
                                            Retrievals         Cloud Height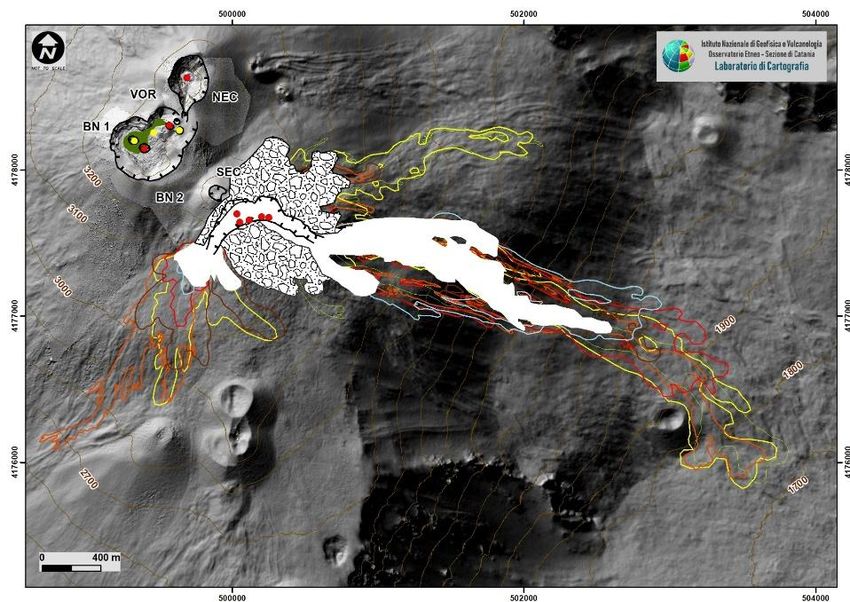
Volcanic Cloud Retrievals   Ash

SO2

      Ice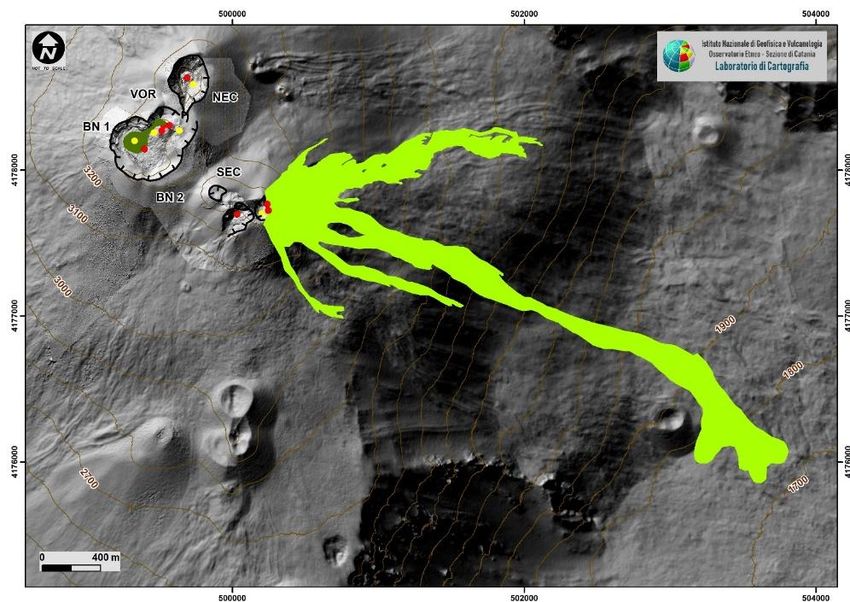
HOTSAT- Satellite Volcano Monitoring System
   INPUT DATA                     PRODUCTS
HOTSAT- Satellite Volcano Monitoring System
         INPUT DATA                       PRODUCTS

                                    1. Hotspot Detection

                                    2. Radiant Heat Flux

e.g. MSG-SEVIRI, EOS- MODIS,        3. Effusion Rate &
NPP-VIIRS, etc                      Volumes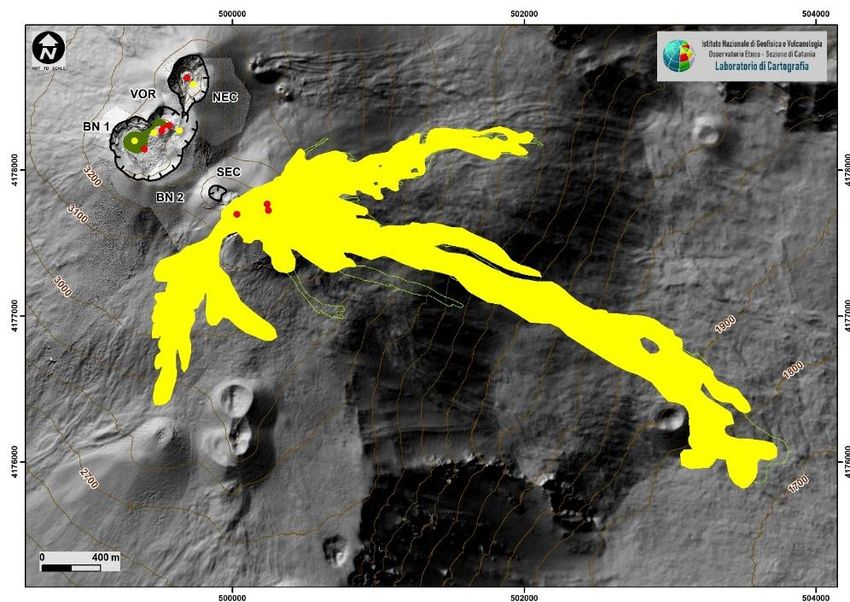
Mt Etna 2021: Radiant Heat Flux from SEVIRI & MODIS
                                                            Ten Paroxysmal
                                                 F9   F10   Events
                   F3        F5
              F2
                                                            1. 16/02/21
         F1                                                 2. 18/02/21
                        F4             F7                   3. 19/02/21
                                  F6
                                                            4. 21/02/21
                                            F8              5. 22/02/21
                                                            6. 24/02/21
                                                            7. 28/02/21
                                                            8. 02/03/21
                                                            9. 04/03/21
                                                            10.07/03/21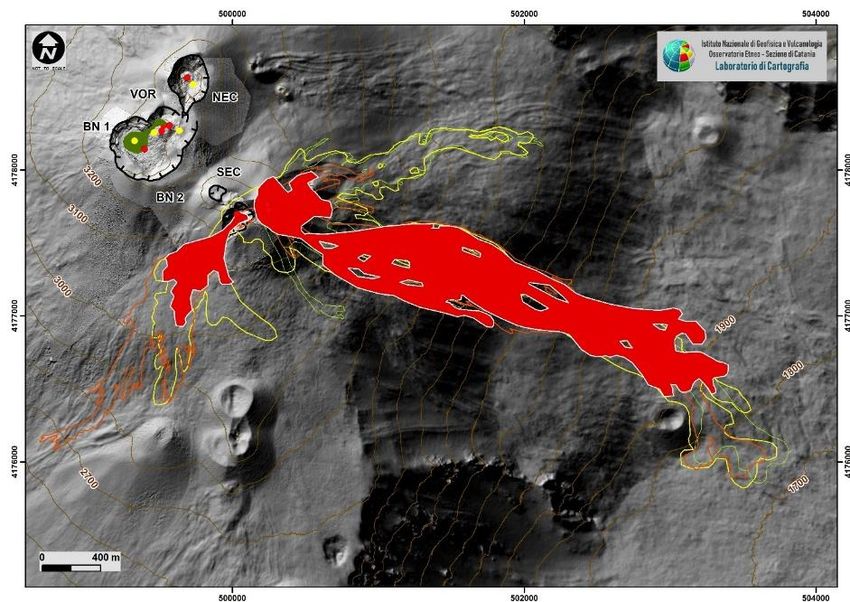
Volumes from cooling curves

                                                                   2011July,
                                                          2011 January,
                                                                  2011  12-
                                                              November,
                                                                 13 19 15

 PHASE I: Continuous (slow or sharp)                        2011
                                                          2011
                                                         2011     July, 19
                                                               November,
                                                              January,      15
                                                                        12-13
 increasing in the radiative power.                         Cooling Curve
                                                             CoolingCurve
                                                           Cooling   Curve
 PHASE II: Discontinuous behavior often
 due to ash emission and saturation.
 PHASE III: Continuous decreasing in the
 radiative power due to the cooling.
                                           Ganci et al., 2012 GRL doi:10.1029/2012GL051026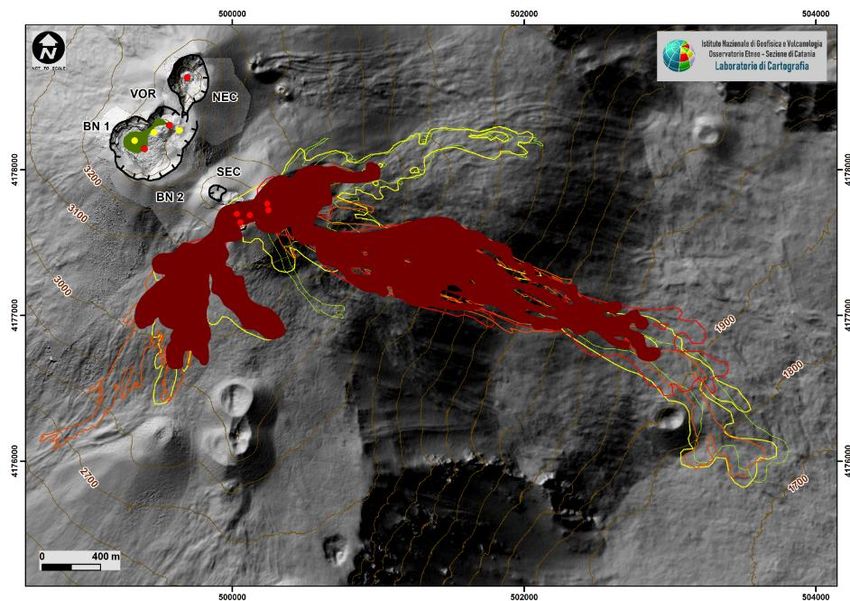
Etna 2021: Volumes from cooling curves
                                         Lava flow volume per event ranges
                                         between 1.5 and 3 million of cubic
                                         meters.
                                         A cumulative value of 25 million of cubic
                                         meters has been estimated for the ten
                                         eruptive events.
HOTSAT- Satellite Volcano Monitoring System
HOTSAT
Low Temporal
High Spatial
Resolution
Multispectral
Images 4. Active Lava Flow Area
e.g. Landsat 8 – OLI ,
Sentinel 2 MSI, EOS – ASTEREtna 2021: Lava Flow Field from satellite imagery
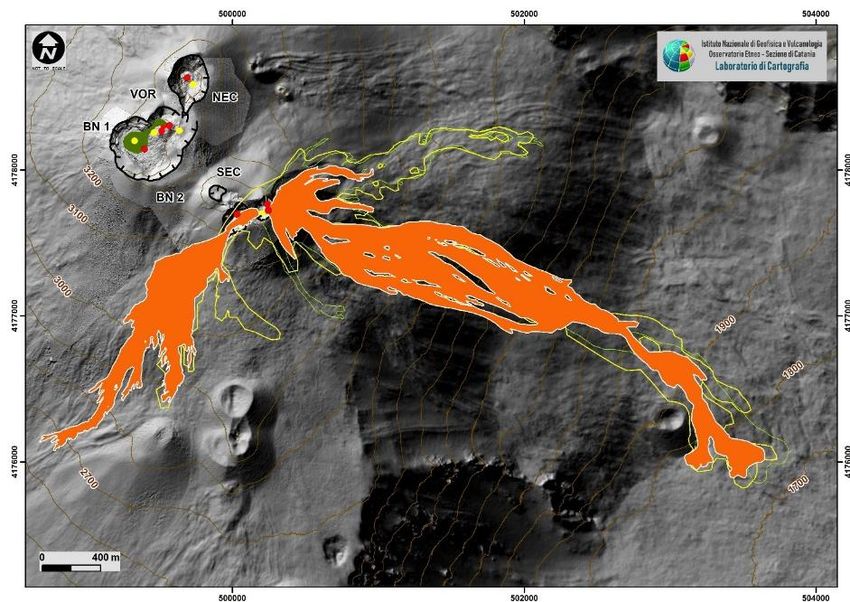
Mapping of lava flow field is performed by using: Landsat 8, Sentinel
2, Aster, Planetscope, Skysat imagery, together with ground-based
fixed thermal camera data
Aster
Skysat
1. 16/02/21
Sentinel-2
Landsat 8 2. 18/02/21Etna 2021: Lava Flow Field from satellite imagery Skysat Sentinel 2 Planetscope 3. 19/02/21 Sentinel 2 4. 21/02/21 Skysat 5. 22/02/21 Landsat 8 Planetscope 6. 24/02/21 Sentinel 2 7. 28/02/21 Sentinel 2 8. 02/03/21
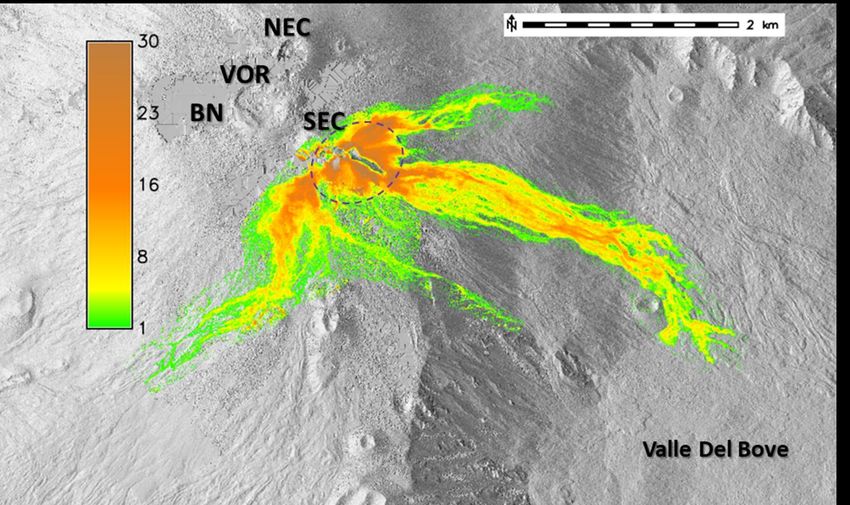
Etna 2021: Lava Flow Area and Average Thickness
HOTSAT- Satellite Volcano Monitoring System
               INPUT DATA                 PRODUCTS

e.g. Pleiades, SkySat,
WorldView3, EOS - ASTER
High Spatial
Resolution                           5. Digital
   Optical
 Images in                           Elevation
   Stereo-                            Model
  Tristereo
Pléiades Imagery at Mt Etna 2021
A cloud-free Pléiades triplet was acquired over Mt Etna on February 26, 2021. The 3D processing of the tri-
stereo Pléiades imagery is performed using the free and open source MicMac (Multi-images
Correspondances, Méthodes Automatiques de Corrélation) photogrammetric library developed by the French
IGN (Institut Géographique National).
A 1-meter spatial resolution digital elevation model was producedPléiades Imagery at Mt Etna: February 2021 vs August 2020
By subtracting the August 2020 DEM to the 2021 DEM the volume of erupted materials 12 Paroxysmal events:
can be quantified [Ganci et. al 2018]. The two DEMs were aligned by using Nuth and Kääb 1. 13 Dec 2020
[2011] co-registration algorithm. 2. 14 Dec 2020
3. 21 Dec 2020
4. 22 Dec 2020
5. 18 Jan 2021
6. 20 Jan 2021
7. 16 Feb 2021
8. 18 Feb 2021
9. 19 Feb 2021
10. 21 Feb 2021
11. 22 Feb 2021
12. 24 Feb 2021
Total Volume: 24.5E6 m3
Total Area 3.7E6 m3
Lava Flow:18.1E6 m3
SEC collapse: 9.1E4 m3 SEC growth: 6.4E6 m3Satellites and sensors for Etna Volcano Monitoring
Satellite Sensor Spatial Resolution Revisit Time Derived Product
Radiant Heat Flux, TADR, Plume Height,
MSG-SEVIRI 3 km 15 minutes
Ash/SO2 retrievals
Radiant Heat Flux, TADR, Plume Height,
EOS-MODIS 1 km 12 h
Ash/SO2 retrievals
Radiant Heat Flux, TADR, Plume Height,
Sentinel 3-SLSTR 1 km 12 h
Ash retrievals
Radiant Heat Flux, TADR, Plume Height,
NPP/JPSS-VIIRS 375 - 750 m 12 h
Ash/SO2 retrievals
Landsat 8- OLI 15 - 30 m 7-14 days Lava flow thermal map
Sentinel 2- MSI 10 - 60 m 2-3 days Lava flow thermal map
DEM, Lava flow area/thickness, Plume
EOS-ASTER 15 - 90 m On demand
Height, SO2 retrievals
Pleiades-1A, -1B 0.5 - 2 m On demand DEM, Lava flow area/thickness
Doves-PlanetScope 3.7 m ~1 day DEM, Lava flow area/thickness
SkySat 0.7 - 1 m On demand DEM, Lava flow area/thicknessYou can also read