Supplement of Seismic noise variability as an indicator of urban mobility during the COVID-19 pandemic in the Santiago metropolitan region, Chile
←
→
Page content transcription
If your browser does not render page correctly, please read the page content below
Supplement of Solid Earth, 12, 1075–1085, 2021
https://doi.org/10.5194/se-12-1075-2021-supplement
© Author(s) 2021. CC BY 4.0 License.

Supplement of
Seismic noise variability as an indicator of urban mobility during the
COVID-19 pandemic in the Santiago metropolitan region, Chile
Javier Ojeda and Sergio Ruiz

Correspondence to: Javier Ojeda (jojeda@dgf.uchile.cl)

The copyright of individual parts of the supplement might differ from the article licence.
1   Additional information

This supplemental file contains Tables S1 and S2, and Figures S1, S2, S3, S4, and S5, mentioned in the manuscript.

                                                             1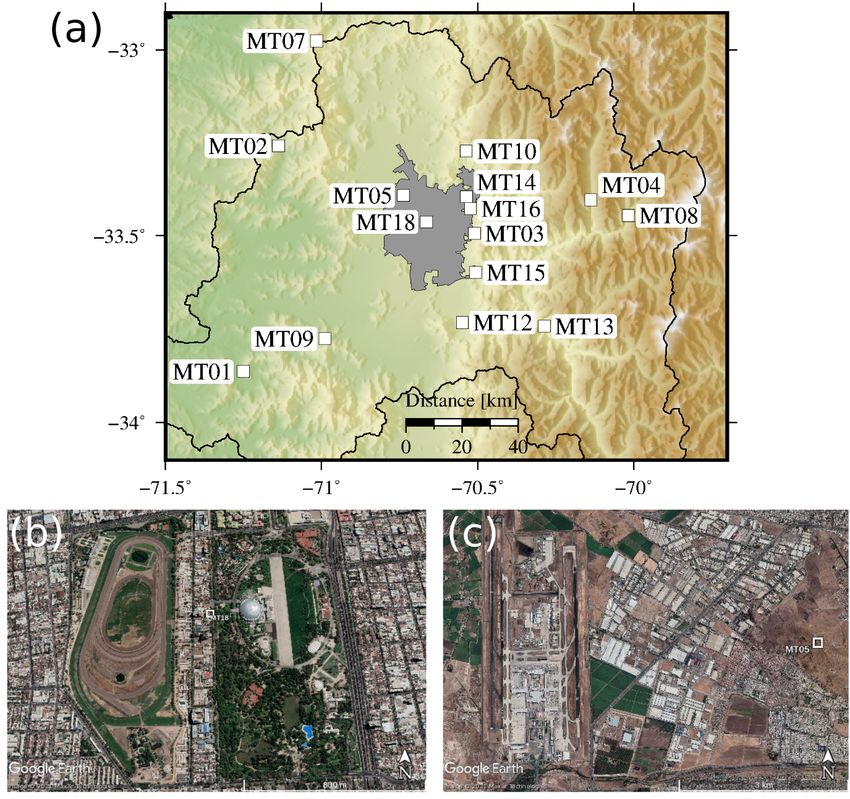
Table S1. Step by step gradual reopening of the country, presented as a public health policy to mitigate the virus spreading. Applicable only
from 19 July 2020.

      Step                  Name                             Brief description
      Phase 1               Quarantine                       Full Lockdown. Only essential business allowed.
      Phase 2               Transition                       Lockdown is maintained on weekends and holidays. Opening of shops and going to
                                                             work is allowed. Indoor gathering of up to five persons are permitted.
      Phase 3               Preparation                      Open full week. Altough is not possible to transit to go to a quarantined place. Meet-
                                                             ings and events allowed for a max. of 25 people indoor and 50 people outdoor.
                                                             Restaurant and cafés allowed to work in open spaces but keeping social distance.
      Phase 4               Initial opening                  Open full week. Cinema, theatres and similar may operate at 25% of their capacity.
                                                             School classes may return.
      Phase 5               Advanced opening                 Open full week. Pubs, discotheques, gyms and similar may open up to 50% of their
                                                             capacity.

    During the period analysed (1 Dec 2019 - 1 Oct 2020), none of the cities presented in this study advanced to Phase 4 or 5.

Table S2. Seismic stations used in this work, we added the information about location and dates when lockdown (LD) or other phases were
implemented during the period analysed (1 Dec 2019 - 1 Oct 2020).

                            Station      City                                    LD1         end LD1           LD2         Phase 2   Phase 3
                            MT01         Daracena - Melipilla                   12 Jun           -              -          10 Aug       -
                            MT02         Curacaví                               12 Jun           -              -          10 Aug       -
                            MT03         UAI - Peñalolén                         8 May           -              -          24 Aug    28 Sep
                            MT04         Olivares                               12 Jun           -              -          24 Aug     2 Sep
                            MT05         Cerro Colorado - Renca                  8 May           -              -             -         -
                            MT07         Cerro El Roble                         12 Jun           -              -           28 Jul   28 Sep
                            MT08         Bocatoma Colorado                      12 Jun           -              -          24 Aug     2 Sep
                            MT09         Talagante                              26 Jun           -              -          31 Aug    28 Sep
                            MT10         Hacienda Santa Martina                 15 May           -              -           28 Jul      -
                            MT12         Pirque                                    -             -              -             -         -
                            MT13         San Alfonso                            12 Jun           -              -          24 Aug     2 Sep
                            MT14         Cerro Calán - Las Condes               26 Mar        16 Apr         15 May         28 Jul    2 Sep
                            MT15         Las Vizcachas                           8 May           -              -          28 Sep       -
                            MT16         CCHEN - Las Condes                     26 Mar        16 Apr         15 May         28 Jul    2 Sep
                            MT18         Casona - Santiago                      26 Mar        13 Apr          5 May         17 Jul   28 Sep
                            TA02         Iquique                                15 May           -              -             -         -
                            CO05         La Serena                               29 Jul          -              -          28 Sep       -
                            VA01         Valparaíso                             12 Jun           -              -             -         -
                            CCSP         San Pedro - Concepción                  6 Apr        16 Apr         11 Sep           -         -
                            MG01         Puerto Williams                        25 Mar        6 Apr             -             -         -

                          -: Not applicable dates during the period analysed.

                                                                                       2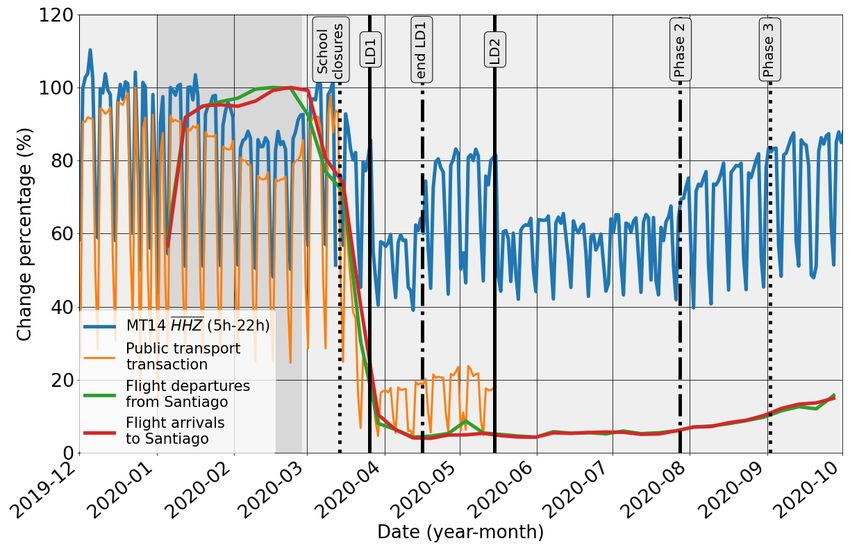
Figure S1. (a) Map of the Metropolitan region with 15 stations analysed in this study. Note that only stations MT05, MT18, MT14, MT16,
MT03, and MT15 are stations in the Santiago city urban area (grey surface). (b) Close view to vicinity of MT18, in which we can see the
hippodrome ”Club Hípico de Santiago” on the left and the O’Higgins Park on the right. (c) Close view to the vicinity of MT05, in which we
can see the Airport on the left. Photos from ©Google Earth.

                                                                   3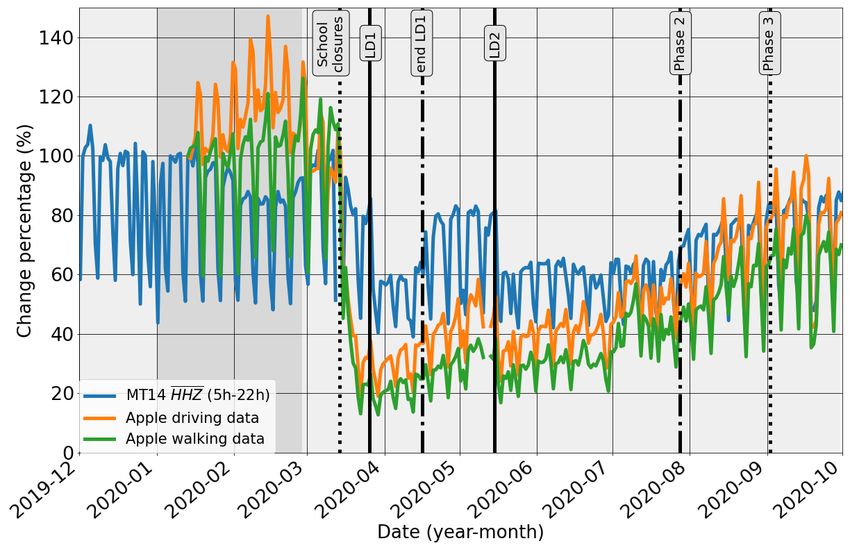
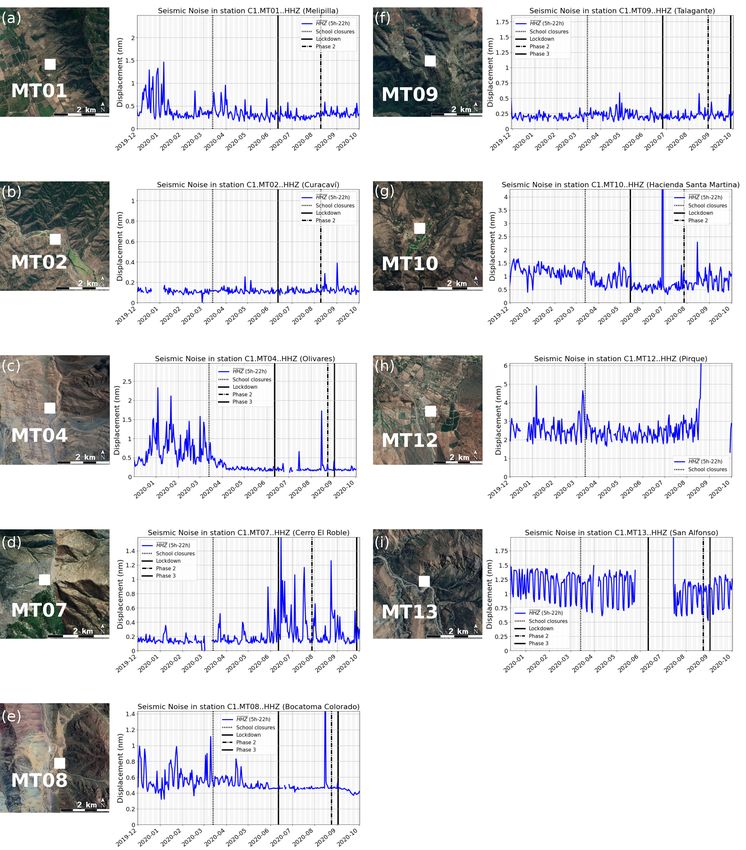
Figure S2. Changes in high-frequency seismic ambient noise amplitudes at stations (a) MT01, (b) MT02, (c) MT04, (d) MT07, (e) MT08, (f)
MT09, (g) MT10, (h) MT12, and (i) MT13. The vertical black lines indicate the time of public restrictions implemented in the Metropolitan
region. Each municipality inside the region had different lockdown periods or phases despite the proximity between them (see Table S2).
Photos from ©Google Earth.
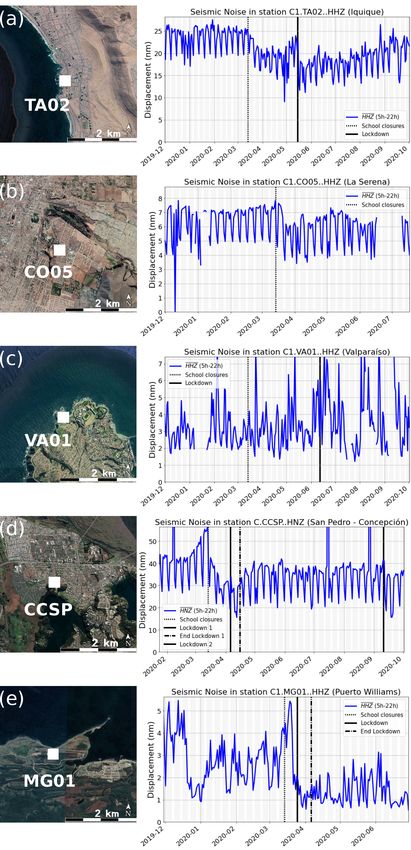
4Figure S3. Changes in high-frequency seismic ambient noise amplitudes at stations (a) TA02, Iquique, (b) CO05, La Serena, (c) VA01,
Valparaíso, (d) CCSP, San Pedro Concepción, and (e) MG01, Puerto Williams. The vertical black lines indicate the time of public restrictions
implemented in each region. Photos from ©Google Earth.
5Figure S4. Comparison between noise evolution of station MT14 (blue line) and the Apple mobility data, specifically driving (orange
line) and walking data (green line). The vertical black lines indicate the time of public restrictions implemented in Las Condes. The ASN
amplitudes and Apple mobility data are normalised by a baseline value of the 13 January 2020. The grey background between January and
March corresponds to the Summer holiday season in Chile.
6Figure S5. Comparison between noise evolution of station MT14 (blue line) and other mobility data, specifically public transport transactions
(orange line), flight departures from Santiago (green line), and flight arrivals to Santiago (red line). The vertical black lines indicate the time
of public restrictions implemented in Las Condes. The grey background between January and March corresponds to the Summer holiday
season in Chile.
7You can also read