Supply and demand: the EU's role in the global shark trade
←
→
Page content transcription
If your browser does not render page correctly, please read the page content below

supply and demand:
the EU’s role in the
global shark trade
contents
2 vision & mission conclusions &
recommendations
3 index 26 conclusions
27 recommendations
5 executive summary
acknowledgements,
introduction references & end notes
8 visual data overview of EU’s role 30 acknowledgements
in shark fin and meat trade 31 references
10 introduction 31 end notes
Photo: Melanie Mahoney
methods
14 methods
findings
18 shark fin-related imports
vision:
from the EU
20 shark fin-related exports
animals and people to the EU
thriving together.
21 shark meat-related imports
from the EU
22 shark meat-related exports
to the EU
24 data discrepancies: comparing
import data from Asian trade
hubs against EU export data
about IFAW
For over a decade, IFAW has been working with
governments around the world to support better
Photo: © IFAW
management for sharks and rays. From the development
of shark identification materials for fisheries, customs
and enforcement officers, to raising awareness on the
conservation needs of shark species, and building
the capacity of governments to meet their obligations
mission:
under international conventions such as the Convention
on International Trade in Endangered Species of
Wild Fauna and Flora (CITES) and the Convention
fresh thinking
on the Conservation of Migratory Species of Wild
Animals (CMS). IFAW also provides technical support
and bold action for
for governments looking to enact progressive and
precautionary management for shark catch limits, or
prohibitions when warranted, at a national level.
animals, people and Published by: International Fund for Animal Welfare,
the place we call
2022
home.
Citation: Shea, S., Slee, B., O’Toole, M. (2022) Supply
and Demand: the EU’s role in the global shark trade.
Stichting IFAW (International Fund for Animal Welfare),
The Hague, The Netherlands. 36pp.
Cover photo: © Shane Gross
A bonnethead shark.
2 International Fund for Animal Welfare 3 Supply and Demand: The EU’s role in the global shark trade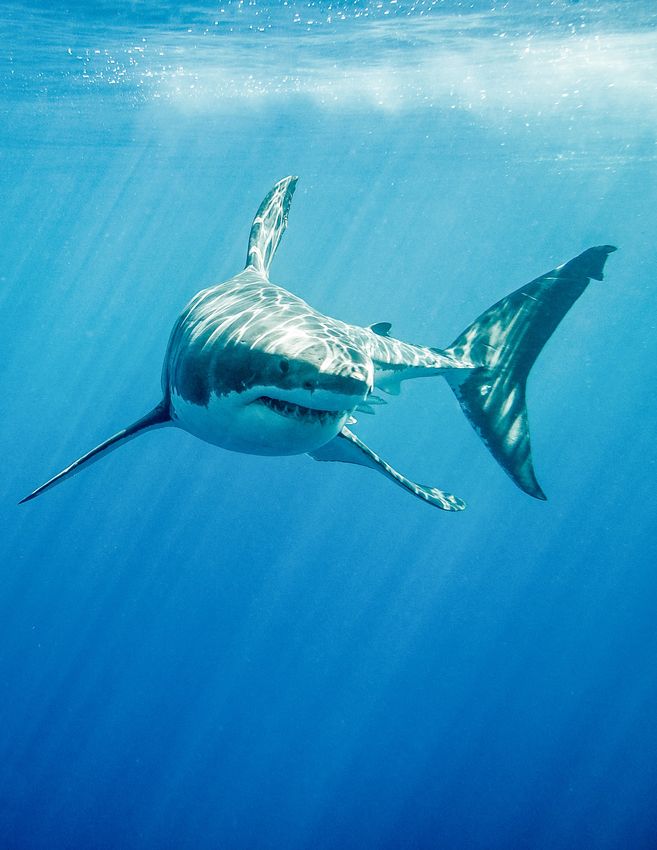
executive summary
Since the early 2010s, global shark IFAW developed this study to examine the Conservation of Migratory Species of Wild
conservation work has come a long way. At role of the European Union (EU) in the global Animals (CMS), but with only 25% of the
that time, sharks were considered a side item shark trade and steps needed to ensure that global trade currently subject to sustainable
in conservation conversations; even an the EU becomes a positive player ceasing its trade limits and populations in rapid decline,
afterthought and almost no management contribution to the decline of shark species, clearly additional steps must be taken. Other
existed. Today, shark management issues are as well as providing recommendations for the similarly resourced governments, such as
a core component of many conservation way forward. Previous studies have examined Canada and the United Kingdom, have taken
conversations, especially relating to their the EU’s role as a leading shark catcher (Okes strong precautionary action in recent years to
catch, trade and contributions to global & Sant, 2019), as well as a major supplier for ban their trade in (detached) shark fins due to
marine biodiversity health. In the span of just the global shark meat trade based on well-reasoned sustainability concerns. If the
10 years, the beginning of a global framework graph theory 1 (Niedermüller et al., 2021). EU is to adhere to its biodiversity and
to monitor and manage shark populations has This current study provides the first sustainability ambitions while remaining one
started to emerge. comprehensive picture of the EU’s role as of the largest traders of shark products, it
reflected in official raw customs data from must once again step into a leadership role
However, while the world has made Hong Kong Special Administrative Region and set the global tone for trade management
significant progress in its management of (referred to as Hong Kong SAR hereafter), and reform needed to improve the tracking of
sharks and rays in recent years, the actions Singapore and Taiwan province, China shark products traded internationally; and to
taken have not been enough. Shark (referred to as Taiwan province hereafter), prevent the widespread extinction of sharks.
populations continue to decline rapidly covering both fin and meat import, re-export
worldwide. More than 50% of shark species and export data compiled over an extensive Given its significant role, action by the EU to
are threatened or near threatened with period (2003–2020). This has allowed us to better monitor and track the trade of shark
extinction, and pelagic sharks (species of examine up-to-date trade routes between the products, as well as to advocate for
sharks found on the high seas) have declined EU and major shark fin hubs, identify sustainable trade limits via CITES Appendix II
more than 70% in only a 50-year period. discrepancies in reporting and suggest listings, would shift global markets towards a
Adding to the concern, a recent study found improvements from both a traceability and better, sustainable future for sharks.
that shark populations were functionally management perspective.
extinct on 20% of reefs surveyed globally. Co-author Barbara Slee, IFAW’s EU Manager,
This study found that despite known Marine Conservation
Small or large, coastal or high seas—sharks population declines, the EU continues to be a
are disappearing, with the piecemeal significant player in the global export of shark
management efforts to date failing to stop fins, with EU Member States supplying on
Scalloped hammerhead sharks are
their decline. average 28% of the shark fin-related imports particularly threatened by the global
into Hong Kong SAR, Singapore and Taiwan shark fin trade and currently listed
in CITES Appendix II.
Global shark declines are driven by province and even up to 45% in 2020.
international demand for shark fins and meat,
coupled with widespread lack of Every country participating in the global
management for both the catch and trade of shark trade must take actions, both at a
shark species. While many place the burden national and international level. Historically,
of change on the consumptive countries, the EU has championed shark and ray trade
primarily in Asia, equally responsible for these management measures at conventions such
declines are countries with internationally as the Convention on International Trade in
operating fishing fleets and trade in shark Endangered Species of Wild Fauna and Flora
products. (CITES) or the Convention on the
Photo: Shmulik Blum
4 International Fund for Animal Welfare © Scott Anger x IFAW 5 Supply and Demand: The EU’s role in the global shark trade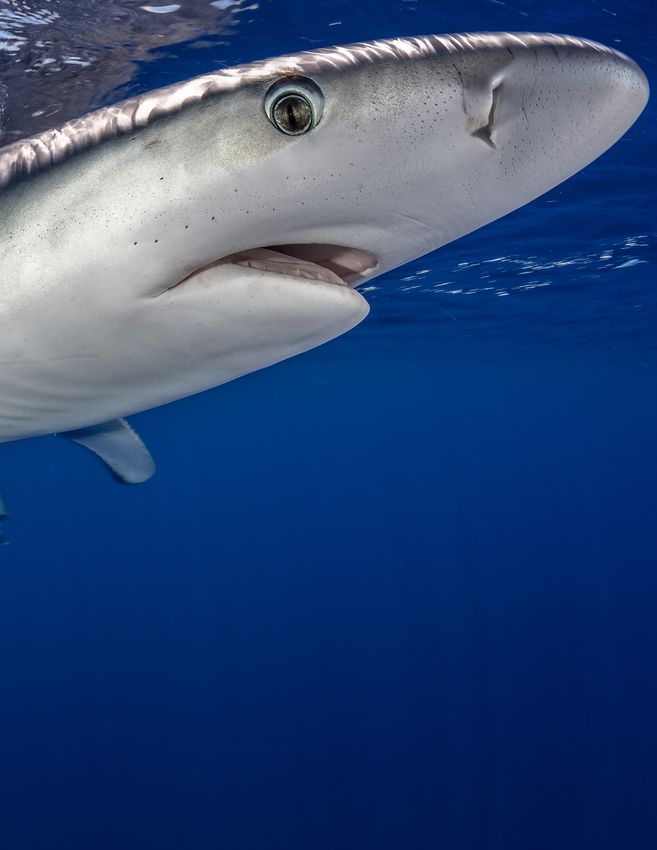
Section 1

                                                                   introduction
Photo: © Ramon Carretero

6                          International Fund for Animal Welfare   7    Supply and Demand: The EU’s role in the global shark trade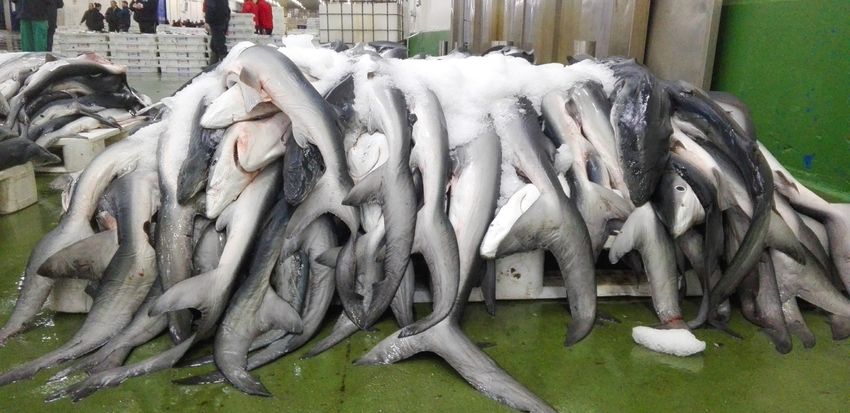
visual data overview of EU’s
role in shark fin and meat trade
study period 2003-2020
Fin imports
from the EU top five EU member
state sources for shark
28% 45%
Others
fin imports
into Hong Kong SAR, Singapore and Taiwan province
6,689 t
Reported sources Total reported trade (2.5%) of 267,345.33 metric tons of shark meat were
(metric tons)
top five sources
exported to the EU. The comparatively low export of
2003 -2020 2020 meat to the EU is not unexpected as most of the shark
of shark fin imports
1st Spain 51795 meat-related products are exported to South America
188,368 t
and South Korea where they are consumed locally.
2nd Portugal 642
3rd Netherlands 621 into Hong Kong SAR, Singapore and Taiwan province
(metric tons) of shark fin products were imported into Hong Kong SAR,
top five destinations
Singapore and Taiwan province combined, with the EU responsible for 4th France 295
Reported sources Total reported trade
almost a third of this import (on average 28.35%, 53,407.49 metric tons).
5th Italy 25 (metric tons)
of shark meat exports
From 2017 onwards the EU’s role increases and accounts for almost half
of the shark fin imports in 2020 (45.42% in 2020).
1st Spain 51795
2nd Singapore
Figure 2. Total shark fin-related imports into Hong Kong
SAR, Singapore and Taiwan province (aggregated) from 17006 out of Hong Kong SAR, Singapore and Taiwan province
the EU & EU-associated sources 2003-2020
3rd Taiwan province 12823
4th Indonesia 11386 Reported Total reported trade
EU
5000 destinations (metric tons)
EU-associated
5th United Arab Emirates 5680
1st Uruguay 69444
4000 2nd Brazil 60361
3rd Mexico 25006
3000
EU fin exports 4th Korea 23744
© Robert Marc Lehmann
Metric tons
worldwide 5th Vietnam 17373
3500
2000 Hong Kong,
3000 Singapore,
Metric tons
Taiwan fin
2500 imports
top five EU member
1000
from the EU
2000
0
1500
state destinations
of shark meat exports
2016
2019
2007
2010
2013
2015
2018
2004
2006
2017
2020
2008
2009
2012
2011
2014
2003
2005
EU is one of
1000
500
the top sources out of Hong Kong SAR, Singapore and Taiwan province
proportion of export by EU
0
2016 2017 2018 2019 2020
of shark fin-related products for the global
Reported Total reported trade
member states has increased
trade hubs of Hong Kong SAR, Singapore and
destinations (metric tons)
data discrepancies
Taiwan province, where an estimated more
than 50% of global shark fin trade passes.
1st Italy 4245
Given this key role in the supply chain, whereas global shark fin-related exports to Hong Kong SAR, Singapore, Taiwan
the EU has a responsibility to ensure that province have been declining. A decrease in the number of shark fins traded between import data from Hong Kong SAR, Taiwan province and 2nd Spain 680
its participation in the global trade of each year is most likely attributable to global shark population declines, Singapore compared to the EU export data: the aggregated import
shark-related products is not driving these and making shark species more difficult to catch and therefore trade in such data consistently displayed a considerably higher import figure than 3rd Greece 674
species towards extinction. high numbers. the corresponding total export data from the EU (to all countries).
The discrepancy between the two datasets ranges from 1,650.08 4th Bulgaria 560
metric tons to 2,318.18 metric tons, suggesting a concerning case
* ‘shark meat’ covers all data from shark meat-related customs codes
of potential misreporting in the shark fin-related trade.
5th Cyprus 91
‘shark fin’ covers all data from shark fin-related customs codes
8 International Fund for Animal Welfare 9 Supply and Demand: The EU’s role in the global shark trade
introduction
                                                                       Shark fin and shark meat are two of the most              records. As more than 50% of the global trade     threatened with extinction due to overfishing
                                                                       commonly internationally traded forms of                  in shark fins moves through Hong Kong SAR,        (Dulvy et al., 2021). Signs of decline in the
                                                                       shark products. A landmark global catch                   Singapore and Taiwan province, examining          shark fin trade should therefore be taken as a
                                                                       assessment estimated that every year at least             trade data at these hubs can yield a              warning sign that widespread global shark
                                                                       100 million sharks are caught in fisheries                comprehensive and reliable picture of the         population declines are occurring. It is
                                                                       driven by the demand for these items (Worm                global trade and networks (Clarke, 2004).         therefore even more important that
                                                                       et al., 2013). While the demand for shark fin is                                                            countries/territories with significant catch
                                                                       mostly accounted for by Asian markets such                Studies of Hong Kong SAR’s trade data have        and trade levels act on data that shows them
                                                                       as Hong Kong SAR, Singapore (both                         found reduced shark fin imports with a sharp      as contributors to the global problem.
                                                                       important consumer markets and trade hubs                 drop after 2011, despite starting to rise again
                                                                       for shark fin), and Chinese mainland, the                 in 2014. Similar declines have since also been    Using available official trade data from these
                                                                       scale of the trade is global. More than 128               observed in Taiwan province and Chinese           ports, we examined the levels of imports and
                                                                       countries/territories around the world have               mainland (Shea & To, 2017). While an              exports of both shark fin and shark meat to
                                                                       participated in the trade of shark fins,                  optimistic interpretation of this reduction may   and from the EU. In doing so, this study
                                                                       historically or to the present day (Shea & To,            point to decreased demand, which is               presents a more comprehensive picture of
                                                                       2017), as exporters, re-exporters or                      possible for some markets, a more cautionary      the EU’s role in the international shark
                                                                       importers. Latest research has also shown                 interpretation is urged. Declines in the trade    product trade through key Asian hubs. This
                                                                       that, despite gaining less attention than the             may simply be attributed to dwindling shark       information can therefore be used to
                                                                       fin trade, the shark meat trade is no less                populations, leading to declines in catches       determine what next steps the EU must take
                                                                       global in scale, with demand not only in Asian            and trade volumes (FAO, 2010). While the          to ensure its actions are not driving global
                                                                       markets, but also in Europe, South America,               declines may also have been influenced by         shark populations to extinction.
                                                                       Australia and Africa (Niedermüller et al.,                tightened regulations (e.g. fishing quotas) for
                                                                       2021).                                                    shark fisheries at source, this explanation is
Photo: © Robert Marc Lehmann

                                                                                                                                 unlikely a driving factor, given widespread
                                                                                                                                                                                         View of the caudal fins of a stack

                                                                       The global scale of the trade and complexity              lack of management in most of the world’s               of blue sharks (Prionace glauca).
                                                                       of trade networks has made it challenging to              shark-related fisheries (Fischer et al., 2012;          Covered with ice and sold at the Port
                                                                                                                                                                                         of Vigo, Galicia, Spain.
                                                                       trace trade routes, volumes or product details            Davidson et al., 2016). Notably, while global
                                                                       even for key players to show exactly how                  assessments in 2014 found that 24% of shark             A blue shark swims in the ocean.


                                                                       countries/territories are involved, particularly          species were threatened, only seven years
                                                                       for places where there are no strong trade                later, that number had increased to one third
                                                                       regulations or policies to ensure clear                   of chondrichthyan species assessed as

10                             International Fund for Animal Welfare   11       Supply and Demand: The EU’s role in the global shark trade
Section 2

                                                                 methods
Photo: © Steve De Neef

12                       International Fund for Animal Welfare   13   Supply and Demand: The EU’s role in the global shark trade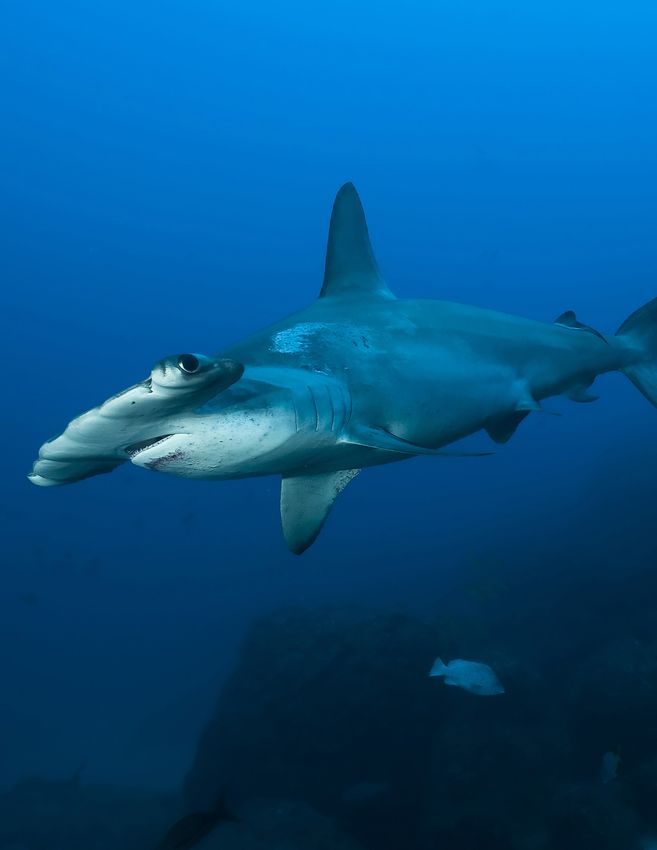
Photo: © Stan Shea // BLOOM HK
                                                                                     methods
                                                                                     This study uses the official trade data from             statistics for Singapore’s trades). It is also    Member States are compared against the
                                                                                     key players in the global shark fin and meat             noted that the global database of the Food        EU’s total export data. Trade data from the EU
                                                                                     trade to trace trade routes and conduct cross            and Agriculture Organization of the United        was collected from the official online portal
                                                                                     comparisons using Harmonized System (HS)                 Nations (FAO) aggregates national figures for     for EU trade statistics (Access2Market, 2021).
                                                                                     commodity codes. Trade data under all HS                 the shark fin-related trade. However, while       Note that in that section, the trade data for
                                                                                     codes related to shark fin and meat products             providing a broader perspective of the trade,     the EU’s exports are included for all global
                                                                                     was collected from three key trade hubs in               it potentially oversimplifies product             exports (not only exports to Hong Kong SAR,
                                                                                     the international shark fin trade, including             categories (Clarke, 2004). FAO data is            Taiwan province and Singapore).
                                                                                     Hong Kong SAR, Taiwan province and                       therefore not included in this study.
                                                                                     Singapore, for the years where trade data is                                                               Further information on datasets and
                                                                                     available; that is from 2003 through to 2020.            All countries/territories found in each dataset   methodology will be available in the full
                                                                                                                                              were grouped under one of the three               report as authored by BLOOM Association
                                                                                     All three studied datasets were collected                following categories in the analysis: “EU”,       Hong Kong, and IFAW (the International Fund
                                                                                     from their respective official data sources to           including all 27 Member States of the EU2 and     for Animal Welfare) to be published in
                                                                                     ensure that the original data is used for the            its nine outermost regions (ORs); EU Overseas     mid-2022.
                                                                                     study. From Hong Kong SAR, the data was                  Countries and Territories (OCTs), British
                                                                                     collected from the Census and Statistics                 Indian Ocean Territories (BIOT), and any
Photo: © 2021 Ilan Elgrably / Shutterstock

                                                                                     Department (CSD) of the Government of                    countries/territories located in Europe but not
                                                                                                                                                                                                       hark dorsal and/or pectoral fins
                                                                                                                                                                                                       S
                                                                                     Hong Kong SAR. From Taiwan province, it was              a part of the EU are categorised as “EU-                 of all shapes and sizes drying out
                                                                                     obtained through the Directorate General of              associated”; while “Non-EU” comprises all                on the rooftop of an industrial
                                                                                                                                                                                                       building in Kennedy Town, Sai Wan,
                                                                                     Customs Headquarters in Taipei and the                   other countries/territories found in the trade           Hong Kong SAR.
                                                                                     Customs Administration, Ministry of Finance’s            data.
                                                                                                                                                                                                      A dusky shark (Carcharhinus obscurus)

                                                                                     online trade statistics search engine. From                                                                      swims in the Mediterranean Sea.
                                                                                     Singapore, the datasets were purchased from              In the final section, Hong Kong SAR, Taiwan
                                                                                     IE STATLINK service (the official source of              province and Singapore’s imports from EU

14                                           International Fund for Animal Welfare   15      Supply and Demand: The EU’s role in the global shark trade
Section 3

                                                               findings
Photo: Jim Abernethy

16                     International Fund for Animal Welfare   17   Supply and Demand: The EU’s role in the global shark trade
shark fin-related imports
from the EU Figure 1. Total shark fin-re
SAR, Singapore and Taiw
2003
EU
During the period of 2003–2020, the EU was found to be 15000
a significant, and at times the largest source of shark- EU-associated
related products for shark fin trade hubs Hong Kong SAR, Non-EU
12000
Singapore and Taiwan province.
Metric tons
From all sources, a grand total of 188,369.3 metric tons of 9000
shark-fin related products were reported in imports into
Hong Kong SAR, Singapore and Taiwan province
6000
combined, with an annual average of 10,464.96 metric
tons.3 EU Member States contributed 53,407.49,
averaging 28.35% of the total reported imports over the 3000
studied period. The percentage of imports from EU
Member States fluctuated between 18.54% and 45.42%.
0
From 2017 the percentage increased steadily from 28.34%
2016
2019
2007
2010
2013
2015
2018
2004
2006
2017
2020
2008
2009
2012
2011
2014
2003
2005
to more than 45% in 2020 (see Figure 1). While global
shark fin-related exports to Hong Kong SAR have
Figure 1. Total shark fin-related imports into Hong Kong SAR,
decreased globally, the EU continues to catch and export Singapore and Taiwan province (aggregated) 2003-2020
shark fins in large numbers (Figure 2). If this trend
Figure 2. Total shark fin-re
SAR, Singapore and Taiwan
the EU & EU-associa
continues, the EU could easily become the majority
source of shark fins for the three largest trading hubs for
EU
shark products. 5000
EU-associated
Of all the reported imports from EU Member States, Spain
4000
was the largest reported source of imports, with a total of
51,795.32 metric tons recorded and an annual average of
Metric tons
2,877.52 metric tons. 3000
Portugal accounted for the second highest volume of
2000
imports with a total of 642.23 metric tons and an average
of 35.68 metric tons per annum recorded. This was
followed by the Netherlands, responsible for a total 1000
of 620.70 metric tons. It is worth noting that the reported
imports from the Netherlands originate from a single
0
shipment in 2013 and have had no further records since.
2016
2019
2007
2010
2013
2015
2018
2004
2006
2017
2020
2008
2009
2012
2011
2014
2003
2005
Reported source Total reported trade Figure 2. Total shark fin-related imports into Hong Kong
of imports (metric tons) SAR, Singapore and Taiwan province (aggregated) from the
EU and EU-associated sources 2003-2020
1st Spain 51,795.32
2nd Portugal 642.22
pinner shark with fishing line caught
S
3rd Netherlands 620.70 in mouth.
4th France 294.57
5th Italy 24.88
Photo: © Vanessa Mignon
Table 1. Top Five reported EU Member State sources of
the total shark fin-related imports into Hong Kong SAR,
Singapore and Taiwan province 2003-2020
A total of 667.30 metric tons were reportedly imported
from EU-associated countries/territories, accounting for
approximately 0.35% of the grand total of reported
imports.
18 International Fund for Animal Welfare 19 Supply and Demand: The EU’s role in the global shark tradeshark meat-related imports
from the EU Figure 3. Total shark meat
Kong SAR, Singapore and Ta
from the EU and EU-asso
EU
Using trade records from Hong Kong SAR, Singapore and 1200
Taiwan province, the EU was once a significant source of EU-associated
shark meat for these three locations, but that has 1000
changed in recent years. From the aggregated import
data, a total of 3,980.7 metric tons of meat were 800
Metric tons
reportedly imported from EU Member States, with an
average of 221.15 metric tons per year, amounting to 600
approximately 4% of the grand total of reported imports
during the studied time period. The majority of the
400
reported imports from EU Member States were dated
between 2008 and 2011. After the peak of 1,172 metric
200
tons in 2011, reported imports dropped sharply and
remained low, and since 2016 no further reported imports
0
from EU Member States were recorded.
2016
2019
2007
2010
2013
2015
2018
2004
2006
2017
2020
2008
2009
2012
2011
2014
2003
2005
Spain was responsible for a total of 3,929.95 metric tons,
Figure 3. Total shark meat-related imports into Hong Kong SAR,
with an average of 218.33 metric tons, making it the Singapore and Taiwan province (aggregated) from the EU and
highest reported source of imports among all EU Member EU-associated sources 2003-2020
States. Slovenia was the second highest, with a total of
50.71 metric tons.
22%
A total of 429.30 metric tons were reportedly imported
from EU-associated countries/territories, with the peak in
2019 with 93.69 metric tons.
This is not unexpected, as Hong Kong SAR, Singapore,
3,981 t of the world’s shark meat
shark fin-related exports
identified the EU as a supplier in
and Taiwan province are not regarded as big consumers
a recent study (Niedermüller et
of meat were reportedly
of shark meat, which is most often consumed al., 2021)
imported from EU Member States
domestically within the EU or in South America and South
to the EU
Korea. In light of the recent study identifying the EU as a
supplier of 22% of the world’s shark meat (Niedermüller et
al., 2021), it is likely that the drop in meat imports from the
Sharks sold on ice at market.
429 t
EU is related to shifts in trade routes.
Unlike import records, the majority of the aggregated Reported destinations Total reported trade Reported source Total reported trade
total fin-related exports and re-exports from Hong Kong (metric tons) were reportedly imported
of imports (metric tons) from EU-associated countries/
SAR, Singapore and Taiwan province were outbound to 1st Spain 20.93 territories
1st Spain 3,929.953
non-EU destinations, underlining the EU’s status as a 2nd Netherlands 3.38
2nd Slovenia 50.705
supplying nation, but not necessarily a consumer of shark
3rd Italy 0.63
fin-related products. 3rd France 0.03
4th Portugal 0.02
4th Germany 0.01
Only 0.02% (approximately a total of 24.99 metric tons) of 5th Cyprus 0.02
the aggregated total exports and re-exports were Table 3. Top Five reported EU Member State sources of
the total shark-meat related imports into Hong Kong
reportedly outbound to EU Member States from 2003– Table 2. Top Five reported EU Member State destinations
SAR, Singapore and Taiwan province 2003-2020
of the total shark fin-related exports from Hong Kong
2020. Furthermore, there were no reported exports to any SAR, Singapore and Taiwan province 2003-2020
EU member state in 2014–2015 or 2017–2020.
However, for the exports that did occur, Spain once again As for the EU-associated destinations, a total of 9.28
ranked highest here among EU member state destinations metric tons were recorded.
for total exports. A total of 20.93 metric tons were
recorded.
20 International Fund for Animal Welfare 21 Supply and Demand: The EU’s role in the global shark tradeshark meat-related exports
to the EU
Similar to imports into Hong Kong SAR, Singapore and 3000
Taiwan province, the proportion of shark meat-related EU
exports and re-exports from these destinations to the EU 2500 EU-associated
and EU-associated destinations were comparably low. A
total of 6,688.85 metric tons, with an annual average of 2000
Metric tons
371.6 metric tons were reported for EU Member States
destinations. 1500
Italy received the highest volume among all EU Member 1000
States, with a total of 4,245.31 metric tons recorded and
an average of 235.85 per annum. Despite being the 500
largest reported destination in the EU, there were no
further reported exports/re-exports to Italy from 2017 0
2016
2019
2007
2010
2013
2015
2018
2004
2006
2017
2020
2008
2009
2012
2011
2014
2003
2005
onwards.
Spain ranked second highest, with 680.47 metric tons Figure 4. Total shark meat-related exports from Hong Kong
SAR, Singapore and Taiwan province (aggregated) to the EU and
recorded and an average of 37.80 metric tons. Greece EU-associated destinations
ranked third, with 674.25 metric tons and an average of
37.46 metric tons, and Bulgaria followed with a total of
559.99 metric tons. It is worth noting that no further
A blue shark.
exports/re-exports to either Spain or Greece were
reported in 2020.
Reported destinations Total reported trade
(metric tons)
1st Italy 4,245.31
2nd Spain 680.47
3rd Greece 674.25
4th Bulgaria 559.99
5th Cyprus 90.83
Table 4. Top Five reported EU Member State destinations
of total shark meat-related exports
A total of 1,565.034 metric tons were reportedly destined
for EU-associated countries/territories. There were no
further exports/re-exports reported after 2018.
Photo: © Robert Marc Lehmann
22 International Fund for Animal Welfare 23 Supply and Demand: The EU’s role in the global shark tradeUsing the compatible commodity codes, a further EU
breakdown of the comparison was conducted. Results Hong Kong,
showed that for frozen fins, reported imports in the 3500 Singapore, Taiwan
aggregated data are relatively higher than the reported EU
3000
exports. While such a discrepancy is worth further
2500
investigation, it should also be noted that discrepancies in
data related to frozen fin products can also be due to 2000
Metric tons
whether or not reported weights have taken into account the
1500
product water content, which has been found to be able to
1000
increase the product’s weight to up to four times the actual
weight. In the current comparison, it is not clear whether any 500
of the datasets may have adjusted their data accordingly to
0
account for water content, which can lead to discrepancies if 2016 2017 2018 2019 2020
other countries/territories under comparison have not done
Figure 5. Total shark fin-related exports to all countries according to
the same. EU trade data vs. imports from the EU as recorded by Hong Kong SAR,
Singapore and Taiwan province (aggregated)
Apart from the marked differences observed in the reported
trade for frozen fin products, the EU export data for the dried EU
fin trade and fresh fin trade combined in 2016 and 2017 were
Hong Kong,
also found to be consistently lower than the reported imports Singapore, Taiwan
from the EU in Hong Kong SAR, Singapore and Taiwan 3000
province’s aggregated data. Discrepancies of up to 620.40
tonnes were found, which potentially indicates another case 2500
of misreporting at either end of the trade. Interestingly, the
Metric tons
trade data appeared to closely match after 2018. In 2000
particular, the datasets matched most closely in 2019 and
2020, suggesting that the majority of the dried and fresh 1500
shark fins exported from EU Member States were sent
directly to the destinations of Hong Kong SAR, Singapore 1000
and Taiwan province. The high level of correspondence
Photo: © Vanessa Mignon
between the aggregated import data and the EU export data 500
furthermore suggests that Hong Kong SAR, Singapore and
Taiwan province are the top destinations for shark fin exports 0
from EU Member States in those years. 2016 2017 2018 2019 2020
Figure 6. Total frozen shark fin exports to all countries according to
Once again, it should be noted that while in the EU trade data EU trade data vs. imports from the EU as recorded by Hong Kong SAR,
Singapore and Taiwan province (aggregated)
commodity codes separate products into fresh, dried and
data discrepancies: comparing
frozen fin products, the differentiation between dried and
fresh products is not made in Singapore’s trade data.
Therefore, data for dried and fresh fin products were EU
import data from Asian trade
1200
combined for this comparison. This again demonstrates the Hong Kong,
importance of compatible systems for recording the trade Singapore, Taiwan
1000
and in assigning commodity codes between trading partners
hubs against EU export data
Metric tons
to achieve greater traceability and transparency.
800
Such discrepancies should be investigated immediately and 600
steps taken to improve the accuracy of recording, as the EU
may not be aware of the significant role it is playing in global 400
Hong Kong SAR, Singapore and Taiwan province’s import aggregated import data consistently displayed a shark catch and subsequent population declines based on
data from EU Member States was aggregated (referred to considerably higher import figure than the corresponding EU export data alone. 200
in this section as the “aggregated import data”) and export data from the EU. There is a discrepancy between
compared against the total reported export data (to all the two datasets which ranges from 1,650.08 tons to 0
countries) from EU trade statistics between 2016 and 2,318.18 tons; this suggests a concerning case of potential 2016 2017 2018 2019 2020
2020 to observe compatibility in the results and identify misreporting in the shark fin-related trade, and may be
Figure 7. Total dried and fresh shark fin exports to all countries
data discrepancies. While the aggregated import data worth further investigating by the relevant governing
according to EU trade data vs. imports from the EU into Hong Kong
and EU export data showed a matching general trend, the bodies.4 SAR, Singapore and Taiwan province (aggregated)
A white shark.
24 International Fund for Animal Welfare 25 Supply and Demand: The EU’s role in the global shark tradeSection 4
conclusions &
recommendations
Photo: © Avi Klapfer
26 International Fund for Animal Welfare 27 Supply and Demand: The EU’s role in the global shark tradeconclusions
By examining the recorded trade data in the key hubs of leadership role would undoubtedly influence other
Hong Kong SAR, Singapore and Taiwan province, we have players to do so as well. While there are numerous
been able to shed light on yet another piece of the puzzle fisheries management measures in place for shark
regarding patterns in the global trade of sharks and shark catches within the EU and in bilateral/multilateral
products. initiatives (e.g. RFMOs) (European Commission, 2021),
regarding international trade, the EU can and should do
This study’s findings demonstrate that, although the core more to bring the entire trade in shark products under
demand of the shark fin-related market is in Asia, the EU is sustainable management and to understand and monitor
a significant player in the global shark fin trade as a core its portion of the trade. Such efforts are imperative if
supplier to Asian markets. Global trade in shark products shark trade is to continue on a commercial scale.
plays a significant role in the collapse of the world’s shark Furthermore, existing regulations are limited only to the
populations, indicating better regulation and most endangered and threatened species. Global shark
enforcement of the trade is necessary. fin exports are declining, while the EU proportion of the
trade continues to rise - it is undoubtedly the species
The EU is one of the top sources of shark fin-related without management that continue to be caught and
products for the global trade hubs of Hong Kong SAR, traded, despite widespread declines noted across many
Singapore and Taiwan province, where it is estimated species in trade.
more than 50% of the global shark trade passes. Providing
45% of shark fins to key consumer hubs in Asia in 2020, There is now not only an opportunity, but a responsibility,
as well as 22% of global shark meat supply (Niedermüller for the EU to track, manage and sustainably limit the
et al., 2021), the EU has a responsibility to ensure that its export of numerous species currently threatened or
participation in the global trade of shark-related products commercially exported and likely to become threatened
is not driving these species towards extinction. without trade management.
The EU, as a key player in the global shark markets, also
has an important responsibility to ensure the accuracy
Photo: © Tom Burns
Catsharks at Olhão Fish Market, Portugal.
of trade records and the enactment of sustainability
ceanic whitetip shark, one of the most
O
requirements of sharks in trade. Taking on such a
threatened sharks and listed on Appendix II
of CITES.
28 International Fund for Animal Welfare 29 Supply and Demand: The EU’s role in the global shark traderecommendations
Given the continued and increasingly rapid 2. Ensure that any shark species maintains long-term monitoring efforts for
declines in global shark populations, every found in the international shark the EU’s own trade activities (particularly
country participating in their catch and trade product trade is listed in CITES in relation to threatened or CITES-listed
must accurately track trade levels and Appendix II species).
manage shark populations in trade to ensure
adequate protections are in place. The EU is Species whose unmanaged trade is
no exception. contributing to population declines meet 4. P
rioritise the use of trade data
the CITES Criteria for Appendix II (CITES, to combat illegal wildlife trade
The recommendations made below provide 2021). When listed, international trade may in sharks and shark products
ways to move towards a more holistically only continue with the appropriate permits
managed trade system, where data collected issued by national authorities, to ensure Analysis of trade data can provide an
can also enable a more accurate that trade levels are limited to sustainable additional source of information or lead to
understanding of what is being traded levels. Given that shark populations are investigations into potentially illegally
through the EU’s ports, and the extent to dwindling rapidly and comprehensive traded shipments and trade routes. It is
which the trade is contributing to the revision of HS codes can take years to also recommended that trade data is
endangerment of species already facing complete, the EU must act to ensure any shared in cross-national platforms to
threats to survival. sharks that are commercially traded are enable the better coordination of
listed onto CITES Appendix II. This step is intelligence between border checkpoints
IFAW’s recommendations on next steps for no longer precautionary, but necessary at the international level, at least with
the EU to better manage its role in the global given widespread evidence of shark relevant key trading partners.
shark trade are: declines due to unmanaged catch and
trade. In addition to the sharing of trade
1. Improve recording of data and datasets, the EU should establish a
trade records via a review of the There are two additional benefits of such a database for successful seizures
Harmonized System (HS) permitting system. Firstly, where it is conducted by governments, and make
commodity codes for shark properly implemented, there is the ability this accessible to trading partners. Such a
products and standardise code to collect detailed information on how database can enable further
use with key trading partners threatened shark species are traded by understanding of the scale, key players,
countries/territories. Secondly, increased trade routes and patterns in the illegal
The EU must take the lead to initiate and traceability would lead to better data on trade. On the topic of international
form collaborations with its key trading the implementation and effectiveness of collaborations, it was found in this study
partners in shark-related products to any enacted sustainable fishing limits for that apart from EU Member States and
review HS codes used, and reach highly traded species, leading to better outermost regions, the Overseas
consensus on updating codes for the most enforcement as needed. Countries and Territories (OCTs)
traded products to provide higher associated with the EU are also involved in
resolution on products traded, as well as the trade, and where resources are less
increasing traceability by using compatible 3. Build domestic capacity for available, the EU is in a position to provide
codes. In particular, species-specific long-term trade monitoring assistance in regulating trades (Andersson
information should be reflected in the through trade data analysis et al., 2021).
codes for at least CITES-listed species and
species threatened with extinction. It is recommended that the EU improves
its capacity for long-term and detailed
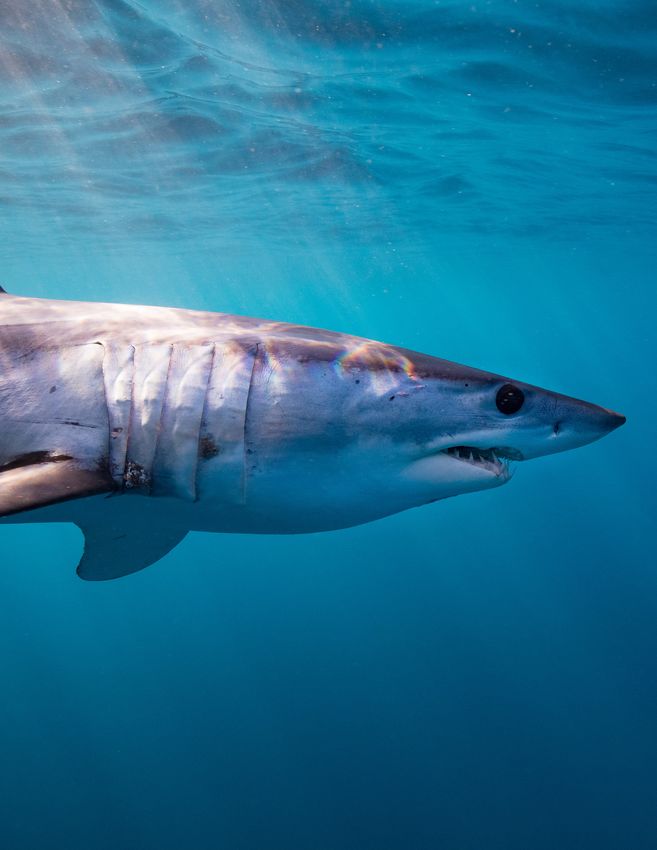
Mako shark.
With increased traceability and monitoring of its shark-related trade,
transparency, analyses of trade datasets through trade data analysis and research,
can inform the creation of policies for identifying key trading partners, and
sourcing countries/territories on fisheries specialised training of frontline staff to
management, and strengthen enforcement more effectively detect illegal trading of
and monitoring capacity in trading CITES-listed species. Alongside
Photo: © Steve De Neef
countries/territories to help meet broader recommendation 1 of making quality data
conservation targets, such as the Aichi more accessible, this recommendation
Biodiversity targets (Clarke, 2004), while encourages the use of such data in
more effectively managing trade at meaningful analyses to obtain information
sustainable levels. about the EU’s shark-related trade, and
30 International Fund for Animal Welfare 31 Supply and Demand: The EU’s role in the global shark tradeSection 5
acknowledgements,
references &
end notes
Robert
xxx
Photo: © Marc Lehmann
/ © IFAW
32 International Fund for Animal Welfare 33 Supply and Demand: The EU’s role in the global shark tradereferences
Andersson, A., Tilley, H., Lau, W., Dudgeon, Dulvy, N., Pacoureau, N., Riby, C., Pollom, R., Niedermüller, S., Ainsworth, G., de Juan, S.,
D., Bonebrake, T. & Dingle, C. (2021) CITES Jabado, R., Ebert, D., Finucci, B., Pollock, C., Garcia, R., Ospina-Alvarez, A., Pita, P. &
and beyond: Illuminating 20 years of global, Cheok, J., Derrick, D., Herman, K., Sherman, Villasante, S. (2021) The Shark and Ray Meat
legal wildlife trade Global Ecology and C., VanderWright, W., Lawson, J., Walls, R., Network: A Deep dive into a global affair 2021
Conservation: 26 e01455 Carlson, J., Charvet, P., Bineesh, K., Fernando, WWF MMI, Rome, Italy Retrieved from:
D., Ralph, G., Matsushiba, J., Hilton-Taylor, C., https://wwfeu.awsassets.panda.org/
Access2Markets (2021) EU trade statistics Fordham, S. & Simpfendorfer, C. (2021) downloads/a4_shark_2021_low.pdf on 4th
(excluding United Kingdom) Retrieved from: Overfishing drives over one-third of all sharks November 2021
https://trade.ec.europa.eu/access-to- and rays toward a global extinction crisis
markets/en/statistics on 28th of December, Current Biology: 31(21) pp. 4773 – 4787 Okes, N. and Sant, G. (2019) An overview of
2021. major shark traders, catchers and species
European Commission (2021) Retrieved from: TRAFFIC, Cambridge, UK
Census & Statistics Department (C&SD) https://ec.europa.eu/oceans-and-fisheries/
(2021) Hong Kong SAR Merchandise Trade ocean/marine-biodiversity/sharks_en on 4th Shea, K. & To, A. (2017) From boat to bowl:
Statistics Imports Retrieved from: https:// November 2021 Patterns and dynamics of shark fin trade in
www.statistics.gov.hk/pub/ Hong Kong SAR - implications for monitoring
B10200012011MM12B0100.pdf on 15th European Commission (2022) Retrieved from: and management Marine Policy: 81 pp. 330
September 2021 https://trade.ec.europa.eu/access-to- – 339
Clarke, S. (2004) markets/en/statistics on 18th January 2022
Worm, B., Davis, B., Kettermer, L., Ward-Paige,
Understanding pressures on fishery resources FAO (2010) The state of the world fisheries and C., Chapman, D., Heithaus, M., Kessel, S.
through trade statistics: a pilot study of four aquaculture Food and Agriculture Gruber, S. (2013) Global catches, exploitation
products in the Chinese dried seafood market Organization of the United Nations, Rome, rates, and rebuilding options for sharks Marine
Fish and Fisheries: Italy, 2010, pp. 218 Policy: 40 pp. 194–204
5 pp. 53 – 74
Fischer, J., Erikstein, K., D’Offay, B., Barone,
Davidson, L., Krawchuk, M., Dulvy, N. (2016) M., Guggisberg, S. (2012) Review of the
Why have global shark and ray landings Implementation of the International Plan of
declined: improved management or Action for the Conservation and Management
overfishing? Fish & Fisheries: 17 (2) pp. 438 of Sharks Food and Agriculture Organization
– 458 of the United Nations, Rome, 125 pp.
endnotes
1
Graph theory is the mathematical study origin (CO)” and “country of consignment the products were exported from EU
of a network of interacting elements. This (CC)”. In the following sections unless Member States as the origin, or only as an
acknowledgements
approach provides a quantitative but otherwise specified, CO data is used for intermediate stop.
simplified view of the multiple factors import data, while CC data is used for
involved in the connection (edges) among export/re-export data. The distinction In addition, available commodity codes
elements (nodes) contained in a network is not made for Singapore or Taiwan in the EU export data currently only
(Niedermüller et al., 2021). province’s data. describe fresh, dried and frozen fin
products. To achieve comparable datasets,
The development of this summary document was made Support for this report was provided by Oceans 5 (a 2
The ‘EU’ customs data covers trade data 4
A few things to note when reviewing all categories under other descriptions
possible by the data compilation and comprehensive sponsored project of Rockefeller Philanthropy Advisors), of 27 Member States and excludes the this initial analysis: only country of (such as canned products, preserved
report drafting done by BLOOM Association Hong Kong Stichting The Flotilla Charitable Foundation and Vulcan United Kingdom to illustrate the role of consignment data was used for Hong or prepared, or descriptions suggesting
the EU in its current composition. The Kong SAR’s dataset for this comparison products were in an airtight container)
(to be published mid-2022). LCC.
customs data from the United Kingdom is section, meaning that the data showed were omitted from the aggregated import
however covered within the EU-associated shipments transported directly from the data in this comparison analysis. This
A number of individuals have provided support, category. ports of EU Member States to Hong Kong furthermore highlights the importance of
information and reviewed this document and are SAR without further intermediate stops. assigning commodity codes that allow for
tore with dried products showing the head
S
acknowledged with thanks: Matt Collis, Jianguo He, This differentiation between country detailed descriptions of products, such as
of two shortfin mako sharks (Isurus oxyrinchus), 3
In this summary report, trade data
of origin and country of consignment in the product forms, which if provided in
Caroline Kube, Renee Lam, Chenyue Ma, Cong Peng, a hammerhead shark (Sphyrna) specimen and a collected from Hong Kong SAR, Singapore
shark mandible. is not available in Taiwan province and the EU export data would make possible
Rebecca Regnery (Humane Society International), Clare and Taiwan province are combined to
Singapore’s datasets. Furthermore, this more detailed and accurate trade data
provide an “aggregated” dataset. It should
Sterling, Kayla Venckauskas and Luke Warwick (Wildlife distinction is also not made in the EU comparisons.
also be noted that trade data from Hong
Conservation Society). Kong SAR is separated into “country of data, therefore it is not known whether
34 International Fund for Animal Welfare 35 Supply and Demand: The EU’s role in the global shark tradeInternational Fund Stichting IFAW (IFAW Nederland) Australia
for Animal Welfare Javastraat 56 Belgium
2585 AR Den Haag Canada
Supply and Demand: The EU’s Nederland China
role in the global shark trade United Arab Emirates
Report +31 (70) 33 55 011 France
info-nl@ifaw.org Germany
Kenya
Malawi
International Fund for Animal Welfare, Netherlands
European Union Office South Africa
Boulevard Charlemagne 1, Bte. 72 United Kingdom
B-1041, Brussels Unites States
Belgium Zambia
Zimbabwe
+32 (0)2 230 97 17
info-eu@ifaw.org
EU Transparency Register ID Number:
22644632329-52You can also read


