Sustainability assessment of urine concentration technologies - Matilda Gunnarsson
←
→
Page content transcription
If your browser does not render page correctly, please read the page content below

W 21030

                       Examensarbete 30 hp
                                 Juni 2021

Sustainability assessment of
urine concentration technologies

Matilda Gunnarsson
Abstract
Sustainability assessment of urine concentration technologies
Matilda Gunnarsson
The majority of the nutrients in household wastewater are found in the urine and in order
to facilitate the use the nutrients in the urine as fertilizer, the urine can be can be concen-
trated. To extract the nutrients from the urine, various technologies for urine concentra-
tion are being developed today. As the technologies are relatively new, urine concentration
systems have not been installed on a larger scale. In this study, sustainability of three
different urine concentration technologies was evaluated through a fictional case study
for 2100 people that took inspiration from a planned residential area in Malmö, Sweden,
where technology for urine concentration will be implemented in at least one of the build-
ings. The technologies were evaluated through a multi-criteria assessment (MCA), where
different criteria within sustainability categories environment, technical, economic and
health were determined based on the Sustainable Development Goals (SDGs). The tech-
nologies examined were alkaline dehydration, nitrification-distillation and ion-exchange
using a pre-step of struvite precipitation. For the alkaline dehydration technology, fresh
urine is added to an alkaline medium, in order to prevent nitrogen losses, and then dried.
In the nitrification-distillation technology, stored urine is treated by first being stabilized
by a partial nitrification and then distilled in order to reduce the volume. For the ion-
exchange and struvite precipitation system, phosphorus is first precipitated from stored
urine and nitrogen is then extracted through ion-exchange. The urine concentration tech-
nologies were assumed to be installed in semi-centralized treatment plants in basements
in the residential area. The other household wastewater was assumed to be treated in the
local wastewater treatment plant (WWTP). The results showed that all three urine con-
centration technologies may contribute to a significant increase in nitrogen recovery from
the household sewer. However, this may come at the expense of increased annual costs
for the population. Before it is possible to determine whether urine concentration can
be an alternative as a complement to the existing wastewater treatment, further studies
of the urine concentration technologies and their sustainability are required. However,
this study indicated that urine concentration technologies perform well in many of the
sustainability criteria examined and therefore have potential to contribute to the SDGs,
especially regarding nitrogen recovery. This study can therefore be an incentive for further
studies, where the sustainability of an implementation of urine concentration in Sweden
is addressed.
Keywords: Wastewater treatment, urine concentration, alkaline dehydration,
nitrification-distillation, ion-exchange, struvite precipitation, MCA

Department of Energy and Technology, Swedish University of Agricultural Sciences, Lennart
Hjelms väg 9, SE-75651 Uppsala. ISSN 1401-5765

                                               I
Referat
Hållbarhetsanalys av urinkoncentreringsteknik
Matilda Gunnarsson
Majoriteten av näringen i hushållsavloppsvattnet finns i urinen och för att underlätta
användningen av växtnäringsämnena i urinen som gödningsmedel kan den koncentreras.
För att utvinna näringen ur urinen utvecklas idag olika tekniker för urinkoncentrering.
Då teknikerna är relativt nya har system för urinkoncentrering inte installerats i en
större skala. Därför utvärderades hållbarheten för tre olika urinkoncentreringsmetoder
genom en fiktiv fallstudie som innefattade 2100 personer. Fallstudien fick inspiration
från ett planerat bostadsområde i Malmö, Sverige, där teknik för urinkoncentrering ska
implementeras i minst en av byggnaderna. Teknikerna utvärderades genom en multi-
kriterieanalys (MKA), där kriterier inom hållbarhetskategorierna miljö, teknik, ekonomi
och hälsa valdes utifrån de Globala målen. De tekniker som utvärderades var alkalisk
urintorkning, nitrifikations-destillering och jonbyte där struvitutfällning tillämpades som
förbehandling. För den alkaliska urintorkningen tillförs färsk urin till ett alkaliskt medium,
för att förhindra kväveförluster, och torkas sedan. I nitrifikations-destillerings tekniken
behandlas lagrat urin genom att det först stabiliseras genom en partiell nitrifikation för
att sedan destilleras för att reducera volymen. För systemet med jonbyte och struvit-
fällning, fälls först fosfor från lagrat urin ut och sedan utvinns kvävet genom jonbyte.
Urinkoncentreringsteknikerna antogs anläggas i semi-centraliserade reningsverk i källare
i bostadsområdet. Övrigt hushållsvatten antogs renas i det lokala avloppsreningsverket.
Resultatet visade att samtliga av de tre teknikerna för urinkoncentrering kan bidra till
en betydande ökning kväveåtervinning från hushållsavloppet. Dock kan detta komma på
bekostnad av ökade årliga kostnader för de boende i området. Innan det är möjligt att
avgöra om urinkoncentrering kan vara ett alternativ som ett komplement till den befintliga
avloppsreningen i Sege Park krävs vidare studier av urinkoncentreringsteknikerna och de-
ras hållbarhet. Däremot visade denna studie att urinkoncentreringsteknikerna presterar
bra i många av de undersökta hållbarhetskriterierna och har därför potential att bidra
till de Globala målen, främst när det gäller kväveåtervinning. Denna studie kan därför
vara ett incitament för vidare studier som behandlar hållbarheten av en implementering
av urinkoncentrering i Sverige.
Nyckelord: Avloppsvattenrening, urinkoncentrering, alkalisk urintorkning, nitrifikations-
destillering, jonbyte, struvitfällning, MKA

Institutionen för energi och teknik, Sveriges lantbruksuniversitet (SLU), Lennart Hjelms
väg 9, SE-75651 Uppsala. ISSN 1401-5765

                                              II
Preface
This master thesis comprises 30 credits and concludes my studies at the Master’s Pro-
gramme in Environmental and Water Engineering at Uppsala University and the Swedish
University of Agricultural Sciences (SLU). The supervisor was Jennifer McConville and
the subject reviewer was Cecilia Lalander, Department of Energy and Technology, SLU.
The examiner was Rickard Pettersson, Department of Earth Sciences, Uppsala University.
First I want to say thank you to my supervisor Jennifer for all the help and support
throughout this thesis, and for always taking your time to answer my many questions.
Then I also want to thank my subject reviewer Cecilia for valuable input and support
in the writing and before the presentation of this thesis. Thank you to Jenna Senecal,
Prithvi Simha and Chinmoy Kanti Deb in the Environmental Engineering Research Group
at SLU as well for providing information regarding the alkaline dehydration technology.
Finally, thank you to my family and friends for being there for me during this thesis and
throughout my studies. I could not have done this without you.

Matilda Gunnarsson
Uppsala, June 2021

Copyright © Matilda Gunnarsson and Department of Energy and Technology, Swedish
University of Agricultural Sciences.
UPTEC W 21030, ISSN 1401-5765
Digitally published in DiVA, 2021, through the Department of Earth Sciences, Uppsala
University. (http://www.diva-portal.org/).

                                           III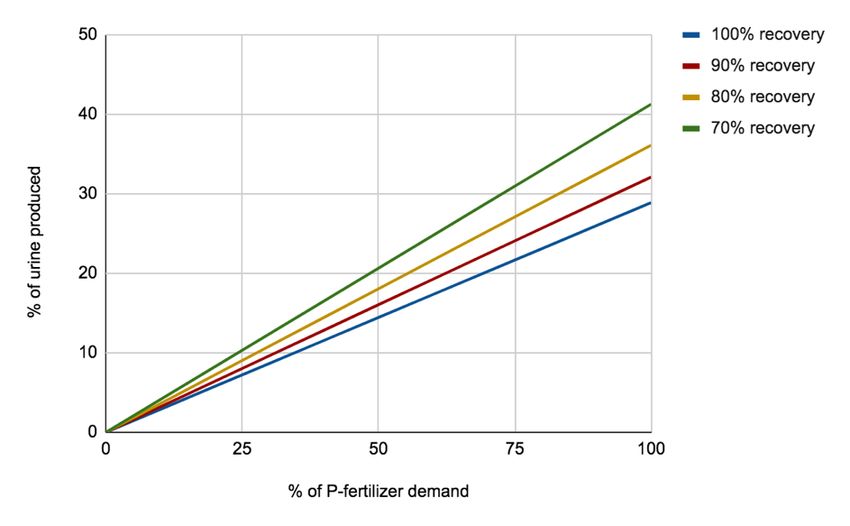
Populärvetenskaplig sammanfattning
Hållbarhetsanalys av urinkoncentreringsteknik
Matilda Gunnarsson
Grödor förses med gödsel innehållandes näringsämnen som kväve och fosfor för att få en
bra tillväxt. Grödorna konsumeras sedan av oss människor för att sedan, via toalettstolen,
transporteras till ett reningsverk där det sker en rening av kväve och fosfor för att minska
utsläppen av dessa växtnäringsämnen. En viss koncentration av kväve och fosfor finns
dock kvar i det behandlade avloppsvattnet som släpps ut till närliggande vattendrag,
vilket bidrar till övergödning. Genom att utvinna näringen från hushållsavloppet och
använda den som gödsel kan det bidra till ett mer cirkulärt samhälle samtidigt som den
negativa påverkan på miljön minskar.
Slam från reningsverk i Sverige kan vara certifierat och tillåts spridas på åkermark om
det uppfyller vissa kvalitetskrav. Halten fosfor i slammet är hög, men enbart en liten
del av kvävet hamnar i slammet. I Sverige har ett förslag om förbud mot spridning av
avloppsslam förts fram av regeringen som potentiellt kan förbjuda användningen av slam
som gödsel. Ett av förslagen förespråkar ett totalförbud, men ett annat förslag inkluderar
undantag som kan skapa en öppning för innovativa tekniker för näringsutvinning från
avloppsvattnet.
Den del av avloppet från hushåll som innehåller mest näringsämnen är urin som innehåller
80-90% av kvävet och 50-80% av den fosfor som finns i toalettavloppsvattnet. Urin in-
nehåller samtidigt mycket vatten som gör att koncentrationen av kväve och fosfor i urin
är låg. Genom att koncentrera urinen kan transport och användning av urin som göd-
sel förenklas. Detta kan ske antingen genom att vatten förs bort från urinen eller att
näringsämnen utvinns från urinen. Olika tekniker har utvecklats för urinkoncentrering,
men teknikerna är under utveckling och ännu inte optimerade.
Hållbarheten med avseende på olika hållbarhetskriterier för tre olika metoder för urinkon-
centrering utvärderades i en fiktiv fallstudie för Sege Park, ett område i Malmö där 700 nya
bostäder ska byggas. Studien antogs omfatta 2100 personer. Metoderna som utvärder-
ades var alkaisk urintorkning, nitrifikations-destillering och struvitfällning efterföljt av
jonbyte. Alkalisk urintorkning är en metod där färsk urin tillsätts till ett basiskt medium
för att stabiliseras och därmed undvika kväveförluster vid den efterföljande torkningen.
Vid nitrifikations-destillering stabiliseras lagrat urin genom en nitrifikationsprocess för att
sedan koncentreras genom destillering. Vid struvitfällning tillsätts magnesium till lagrat
urin för att fälla ut fosfor från urinen och jonbyte används för att utvinna kvävet. Den
kväve och fosforfria lösningen efter struvitutfällningen behöver sedan vidare behandling
och antogs i denna studie behandlas i avloppsreningsverket. Gemensamt för alla metoder
var att kväveåtervinningen var markant högre jämfört med det konventionella systemet.
Däremot bidrog alla system till ökade årliga kostnader för de boende i området.
För skalan som omfattas i studien hade inte urinkoncentrering en effekt på koncentratio-
nen av kväve och fosfor i utsläppen från avloppsreningsverket. Därför undersöktes även en
uppskalning av installationen av urinkoncentreringstekniker, vilken visade på att urinsep-
arering kan bidra till minskade utsläpp, främst av kväve. Det undersöktes även hur mycket
av det urin som produceras i Malmö som behöver behandlas med urinkoncentrering för
att täcka gödselbehovet för åkermarken där. Resultatet visade att redan om hälften av
urinen behandlas med urinkoncentrering kan majoriteten av gödselbehovet täckas.

                                              IV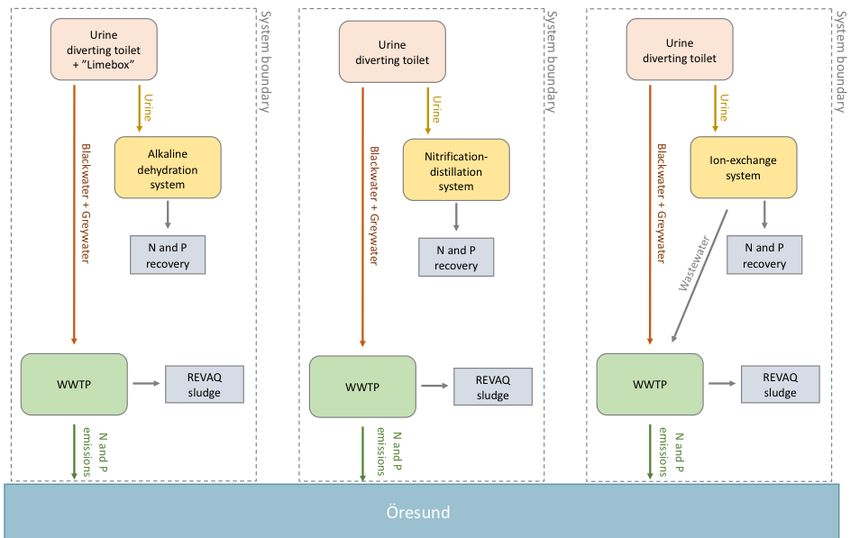
Acronyms and abbreviations
Cd - Cadmium
K - Potassium
MCA - Multi-Criteria Analysis
N - Nitrogen
NFS 2016:6 - Regulations on treatment and control of discharges of wastewater from
urban areas
P - Phosphorus
SDG - Sustainable Development Goal
SuSanA - Sustainable Sanitation Alliance
WHO - World Health Organization
WWTP - Wastewater Treatment Plant

                                           V
Contents
1 Introduction 1
1.1 Aim . . . . . . . . . . . . . . . . . . . . . . . . . . . . . . . . . . . . . . . 1
1.2 Research question . . . . . . . . . . . . . . . . . . . . . . . . . . . . . . . . 2
1.3 Scope . . . . . . . . . . . . . . . . . . . . . . . . . . . . . . . . . . . . . . 2
2 Background 2
2.1 SDGs and Sustainable sanitation . . . . . . . . . . . . . . . . . . . . . . . 2
2.2 Household wastewater . . . . . . . . . . . . . . . . . . . . . . . . . . . . . 2
2.3 Urine diversion . . . . . . . . . . . . . . . . . . . . . . . . . . . . . . . . . 3
2.3.1 Urine storage . . . . . . . . . . . . . . . . . . . . . . . . . . . . . . 3
2.3.2 Urea hydrolysis . . . . . . . . . . . . . . . . . . . . . . . . . . . . . 4
2.4 Urine concentrating technologies . . . . . . . . . . . . . . . . . . . . . . . . 4
2.4.1 Alkaline dehydration . . . . . . . . . . . . . . . . . . . . . . . . . . 4
2.4.2 Nitrification-distillation . . . . . . . . . . . . . . . . . . . . . . . . . 5
2.4.3 Ion-exchange and struvite precipitation . . . . . . . . . . . . . . . . 6
3 Method 8
3.1 Sege Park . . . . . . . . . . . . . . . . . . . . . . . . . . . . . . . . . . . . 8
3.2 Systems and system boundary . . . . . . . . . . . . . . . . . . . . . . . . . 8
3.3 Multi-criteria assessment . . . . . . . . . . . . . . . . . . . . . . . . . . . . 10
3.3.1 Performance . . . . . . . . . . . . . . . . . . . . . . . . . . . . . . . 12
3.3.2 Eutrophying emissions . . . . . . . . . . . . . . . . . . . . . . . . . 12
3.3.3 Nutrient recovery . . . . . . . . . . . . . . . . . . . . . . . . . . . . 14
3.3.4 Energy demand . . . . . . . . . . . . . . . . . . . . . . . . . . . . . 15
3.3.5 Space efficiency . . . . . . . . . . . . . . . . . . . . . . . . . . . . . 16
3.3.6 Cost and affordability . . . . . . . . . . . . . . . . . . . . . . . . . 17
3.3.7 Working environment . . . . . . . . . . . . . . . . . . . . . . . . . . 18
3.4 Wider implementation . . . . . . . . . . . . . . . . . . . . . . . . . . . . . 20
4 Results and discussion 21
4.1 Eutrophying emissions . . . . . . . . . . . . . . . . . . . . . . . . . . . . . 21
4.2 Nutrient recovery . . . . . . . . . . . . . . . . . . . . . . . . . . . . . . . . 21
4.3 Energy demand . . . . . . . . . . . . . . . . . . . . . . . . . . . . . . . . . 22
4.4 Space efficiency . . . . . . . . . . . . . . . . . . . . . . . . . . . . . . . . . 23
4.5 Cost and affordability . . . . . . . . . . . . . . . . . . . . . . . . . . . . . . 24
4.6 Working environment . . . . . . . . . . . . . . . . . . . . . . . . . . . . . . 25
4.7 Performance matrix . . . . . . . . . . . . . . . . . . . . . . . . . . . . . . . 30
4.8 Wider implementation . . . . . . . . . . . . . . . . . . . . . . . . . . . . . 32
5 Conclusions 35
6 References 37
A Assumptions for Environment category 44
B Assumptions for Economic category 46
C Basis risk assessment 52
VI1 Introduction
The population is growing and cities are expanding, which generates larger streams of
wastewater. In turn, this increases the load of wastewater, both volume and pollutants
such as nutrients, to the wastewater treatment plants (WWTP). Nitrogen and phosphorus
are eutrophying nutrients and therefore there are limit values for the emissions of these
nutrients (Swedish EPA 2016). Nitrogen and phosphorus are partially removed from the
wastewater at the WWTP. The remaining nitrogen and phosphorus are discharged to
the recipient. The eutrophying emissions are likely to increase when cities are growing,
which can have negative effects on the recipient and thus on the Sustainable Development
Goal (SDG) 14 (Life below water). In order to avoid an increase or to even decrease the
concentration of nutrients in the effluent from the WWTP, more energy can be needed
for the process (Åmand et al. 2016). At the same time, nitrogen and phosphorus are
nutrients that are used in agriculture, where crops are supplied with N and P rich com-
mercial fertilizers (The Swedish Board of Agriculture 2021). The nutrients are taken up
by plants and then removed from the fields during harvest, which in turn is compensated
for by applying more commercial fertilizer. The crops are consumed by humans and the
containing nutrients are then excreted and sent to a WWTP plant. This linear system
also leads to soil nutrient stripping (Harder et al. 2019). Further, according to Steffen et
al. (2015) both the biogeochemical flows phosphorus and nitrogen are outside the plane-
tary boundaries as well as the safe operating space. The soil nutrient stripping and the
overshoot of the planetary boundaries can argue that it is important to expand the use
of human excreta as fertilizer to enable a more closed loop society in line with SDG 12
(Responsible consumption and production).
The majority of the nutrients found in toilet wastewater comes from human excreta and
particularly from the urine fraction (Fumasoli et al. 2016). Approximately 80-90% of the
nitrogen, 50-80% of the phosphorus and 80-90% of the potassium in human excreta can
be found in the urine (Vinnerås 2001). Still, the nutrient concentration in urine can be
considered low. About 95% of urine is water and less than 1% is nitrogen (Vinnerås et
al. 2006). This can be compared to urea and ammonia nitrate that are commonly used
fertilizers and contain 46 and 35% nitrogen, respectively. By removing the water or ex-
tracting the nutrients, the volume is reduced, facilitating transport and the nutrient reuse,
for example by enabling the use of the same machinery as what is used for commercial
fertilizer (Senecal 2020).
One way of dealing with the low nutrient concentration in urine, and facilitating the
collection and transportation, is to concentrate the nutrients in the urine. Today new
technologies are under development for urine concentration, where the focus is to recover
the nutrients from the urine (Etter et al. 2015, Simha et al. 2020a, Tarpeh et al. 2017).
However, it is uncertain if the nutrient recovery may be at the expense of other factors of
sustainability and therefore this study aimed to assess the sustainability of three different
urine concentration technologies.
1.1 Aim
The aim of this study was to investigate the sustainability of three different technologies for
urine concentration from a Swedish perspective, by performing a multi-criteria assessment
(MCA), with the intention to evaluate if urine concentration can be a future wastewater
1management that can contribute to reaching the SDGs connected to the different criteria
investigated.
1.2 Research question
In terms of the examined criteria, what are the advantages and the disadvantages of the
different urine concentration technologies and can urine concentration be a sustainable
alternative as a complement to existing wastewater management from a Swedish perspec-
tive?
1.3 Scope
In this study, the evaluation of urine concentration technologies from a Swedish perspec-
tive was the main focus and, in order to have a complete wastewater treatment system,
they were evaluated as add-ons to the existing wastewater treatment in Malmö. Three
different options for urine concentration were evaluated, where blackwater and greywater
were assumed to be transported to the WWTP and the urine was assumed to be diverted
and transported to semi-centralized treatment plants within the residential area. In order
to define a baseline for the assessment, a conventional system, where all the household
wastewater was assumed to be treated at a WWTP, was also included. Nutrient recov-
ery was aimed at nitrogen and phosphorus recovery, excluding other important nutrients
such as potassium and micronutrients. In addition, the method for the assessment was a
MCA, where criteria within the categories environment, technical, economic and health
are evaluated. The social aspects were not addressed.
2 Background
2.1 SDGs and Sustainable sanitation
The Sustainable Development Goals (SDGs) are a part of the 2030 Agenda for Sustainable
Development that was adopted in 2015. The SDGs consist of 17 goals for a sustainable
present and future, where SDG 6 directly targets sanitation. However, according to the
Sustainable Sanitation Alliance, SuSanA (2017), sustainable sanitation can have a consid-
erable impact on the other SDGs as well because their definition of sustainable sanitation
is reflected in several SDGs. Their definition of a sustainable sanitation system does not
only include protecting human health, but also the environment. Further, sustainable
sanitation also has to be economically viable, socially acceptable as well as technically and
institutionally appropriate (SuSanA 2017).
2.2 Household wastewater
Household wastewater consists of greywater and blackwater and contains nutrients, such
as nitrogen, phosphorus and potassium, as well as metals and pathogens (Swedish EPA
1995). Greywater is the wastewater from the kitchen, laundry and bathroom. It also
constitutes the largest part of the household wastewater (Vinnerås 2001). However, the
wastewater from the toilet is not included in the greywater and is instead denoted as
blackwater. The blackwater consists of urine, faeces and flush water and is the most nu-
trient dense fraction of the wastewater (Vinnerås 2001, Swedish EPA 1995). Generally in
2Sweden, the conventional toilet has one bowl and one pipe in which human excreta, toilet
paper and flushwater are collected and transported. The household wastewater (black-
and greywater) are mixed and transported to a wastewater treatment plant (WWTP)
where it is treated.
In Sweden, an average person excretes about 550 kg urine and 51 kg faeces, consumes
about 36500 kg greywater and 9 kg toilet paper each year (Vinnerås et al. 2006). Ac-
cording to Svenskt Vatten (2017), the amount of flush water used per person and day
is 30 L, which adds up to about 11000 kg each year. For the nitrogen, phosphorus and
potassium content of the different fractions, Swedish design values have been suggested
in a study by Vinnerås et al. (2006) (Table 1). Based on the numbers presented in Table
1, the household wastewater consists of solely one percent urine. At the same time, the
majority of nutrients in the household wastewater can be found in this fraction.
Table 1: Produced wet mass of wastewater per person and year for the different fractions
(Vinnerås et al. 2006, Svenskt Vatten 2017).
Wet mass N P K
Urine (kg/year) 550 4.0 0.4 1.0
Faeces (kg/year) 51 0.6 0.2 0.4
Toilet paper (kg/year) 9 - - -
Greywater (kg/year) 36500 0.5 0.2 0.4
Flushwater (kg/year) 11000 - - -
2.3 Urine diversion
Urine can be diverted at source using a urine diverting toilet. Urine diversion is used to
collect the urine separately from the faeces that have a high concentration of pathogens
(Vinnerås 2001). In a Urine-Diverting Flush Toilet water is used to flush both faeces and
urine (Tilley et al. 2014). Urine diverting toilets are designed to minimize the dilution of
the urine with flushwater (Gundlach et al. 2021, Tilley et al. 2014). This system requires
different piping for the collection and transporting of urine to a storage tank, while the
blackwater, containing faeces and flushwater is transported to treatment such as WWTP
(Tilley et al. 2014). According to Gundlach et al. (2021), installation of urine diverting
NoMix toilets has been limited because of the designs. It was found in a study by Lienert
& Larsen (2010) that the NoMix toilets required further development since the design
caused problems for 60% of the users. A new design for NoMix toilets has since been
developed, where the teapot effect (that relates the attachment of a fluid to a surface to
different parameters) is used (Gundlach et al. 2021). Urine is collected with a minimal
amount of water without requiring a user behavior change.
2.3.1 Urine storage
There are some aspects that have to be taken in consideration when designing a urine
storage tank. To avoid leakage of urine to the groundwater and vice versa, the material
should be watertight (von Münch & Winker 2011). In the case of constructing a permanent
storage tank, either plastic or concrete can be used (Tilley et al. 2014). In order to
calculate the required storage volume, Equation 1 can be used (von Münch & Winker
2011).
3Vstorage = Nusers · purine · tstorage · ftimef raction (1)
where, Nusers is the number of people using the system, purine is the volume urine produced
per person and day, tstorage is the storage time and ftimef raction is the proportion of the
day that the urine diverting toilet is used.
2.3.2 Urea hydrolysis
Urea hydrolysis is the process in which the urea in the urine is degraded to ammonium
and ammonia by the enzyme urease, which also leads to an increase of the pH (Chipako &
Randall 2020, Udert et al. 2003). Urea is hydrolysed in the pipes and in the storage tank
(Senecal 2020, Udert et al. 2003). Most of the urease is in the pipes due to formation of
biofilm and fecal cross contamination (Senecal 2020). The extent of the urea hydrolysis
during pipe transport depends on the length of the pipe and the effectiveness of the biofilm
that is built up in the pipe (Senecal, personal communication). Extended storage time
enables complete urea hydrolysis (Tarpeh et al. 2017). According to Udert et al. (2003)
complete urea hydrolysis can be performed within a few days in the urine storage tank.
2.4 Urine concentrating technologies
There are mainly two categories for urine concentration (Harder et al. 2019). The first
involves concentrating the nutrients by removing the liquids to obtain concentrated liq-
uids, slurries or powders that can be used as fertilizers. In the other category, selected
nutrients are recovered from the urine and result in a concentrate of the selected nutrient.
However, using technologies from this category, waste products are also generated that
have to be treated. This thesis focuses on three different systems for urine concentration.
2.4.1 Alkaline dehydration
Alkaline dehydration belongs to the first category of urine concentration. The method of
drying fresh urine in an alkaline medium is investigated by researchers at SLU. The urine
is collected from urine diverting toilets or urinals and has a potential of being treated at a
household level (Senecal & Vinnerås 2017) or to be semi-centralized if a so called limebox,
that adds MgO to the urine, is installed in the toilet (Senecal, personal communication).
According to Simha et al. (2021) the MgO addition prohibits the urea hydrolysis during
the pipe transport.
The fresh urine is added to an alkaline media with a pH above 10 to prevent hydrolysis
of urea and dried. The mass reduction of the urine is over 90%, leaving a concentrate
of nutrients in the alkaline media (Simha et al. 2020a). The nutrient recovery from the
urine is complete, except for nitrogen. However, it has been demonstrated that over 90%
of the nitrogen in the urine can be recovered when dried at 60 C and at high drying rates
(Simha et al. 2020b). From laboratory pilot set-ups it has been demonstrated that the
system generates a dry and nutrient dense powder (Simha et al. 2020a). The powder has,
after a four days storage at 20 C, a sufficient pathogen inactivation to use as a fertilizer
in Sweden (Senecal et al. 2018). The system has a medium energy consumption of 1
kWh/L urine (Senecal, personal communication).
4A pilot field testing was performed in 2019 by Simha et al. (2020c). The system for
the field test was designed to dehydrate 30 L urine per day and consisted of three closed
plastic boxes, containing an alkaline media (Figure 1). Urine was supplied to the first
and third drying box (and to the middle box at an overflow since the drying boxes were
interconnected). Hot air was supplied by fans placed on the boxes and the humid air
was removed using a dehumidifier. The field test set-up was optimised only for a high
dehydration rate, which resulted in a high energy consumption.
Figure 1: Schematic representation of the alkaline dehydration set-up for the pilot field
study.
2.4.2 Nitrification-distillation
The nitrification-distillation method is another example of the first category where the
liquid is removed from the urine (Etter et al. 2015). This method of urine concentration
was developed by researchers at Eawag and in the VUNA Project that aimed to recover
nutrients from urine. In the nitrification-distillation system, urine is diverted in urine
diverting toilets or urinals and collected in a storage tank (Etter & Udert 2015). From
the storage tank the urine is pumped to a nitrification column (Figure 2). Nitrification
is used to stabilize the nitrogen in the urine to avoid the loss of nitrogen as well as
malodor. Researchers have found that the nitrification rate (the amount of ammonium
converted to nitrate) varies from 100-800 mg/L reactor volume and day (Etter & Udert
2015). To obtain an optimal nitrification, a steady supply of urine and a pH within the
range 5.8-6.5 are essential for process stability (Etter et al. 2015, Fumasoli et al. 2016).
This is because an overloading of urine can generate an accumulation of nitrite and an
underloading of urine can generate a dangerous low pH for the bacteria performing the
nitrification. According to Etter et al. (2015) careful process control can enable a stable
urine supply and pH. From the nitrification columns the urine is transported, via a sealed
intermediate storage tank, to the distiller (Etter & Udert 2015). Distillation is used to
5evaporate the water from the urine and is performed by a vacuum distiller (Etter &
Udert 2015). The distillation process fulfills the pasteurisation requirements and results
in complete pathogen inactivation according to Etter et al. (2015). The urine can be
treated locally at a treatment plant, but theoretically the technology may also be applied
at household level (McConville et al. 2020).
Figure 2: Schematic representation of the nitrification distillation set-up.
According to Etter et al. (2015), the nitrification-distillation method recovers 99% of the
nitrogen and has a complete recovery of all the other nutrients in the urine. Furthermore,
it removes 97% of the water (Etter et al. 2015). The average energy consumption for
one liter of urine is about 150 Wh (Etter & Udert 2015). The final products are distilled
water and a concentrated liquid containing a high amount of nutrients, which makes it
suitable to use as a fertilizer (Fumasoli et al. 2016). In 2018, the Swiss Federal office of
Agriculture licensed the concentrate nutrient solution for use on all crops and the fertilizer
goes under the name Aurin (McConville et al. 2020).
2.4.3 Ion-exchange and struvite precipitation
The ion-exchange method as well as the struvite precipitation method recovers selected
nutrients (nitrogen for ion-exchange and mainly phosphorus for the struvite precipitation)
and therefore they belong to the second category of urine concentration technologies (Etter
& Udert 2015, Tarpeh et al. 2017). Urine is diverted and collected separately and stored
in sealed containers to keep the urine composition constant by preventing nitrogen losses
due to ammonia volatilisation (Tarpeh et al. 2018a). During storage, urea is converted by
hydrolysis to ammonium that has a positive charge. Ammonium adsorb to the negatively
charged ion-exchange resins (Tarpeh et al. 2017). When exhausted, the resin can be used
as a fertilizer as demonstrated in a study by Beler-Baykal et al. (2011) where clinoptilolite
was used and the old resin was changed and used as a fertilizer. However, depending on
the resin, it can also be regenerated and thereby used again. In a later study performed
by Tarpeh et al. (2018a), Dowex Mac 3 that has an adsorption density of around 4 mmol
N/g, was used as resin and was regenerated using sulfuric acid. The result from the study
showed resin generation efficiencies over 90% that were consistent over ten cycles. With
this setup, a total nitrogen recovery of over 99% has been achieved in laboratory trials by
Tarpeh et al. (2018b).
6In this thesis, the method using Dowex Mac 3 as resin was evaluated. The suggested im-
plementation of the ion exchange technology is a continuous flow column set-up according
to Tarpeh et al. (2017). The energy consumption for the process is low and mainly de-
pends on the energy demand of the pumps (Kavvada et al. 2017). During the process only
nitrogen is captured from the urine, leaving other important nutrients such as phosphorus
in the residuals streams. For phosphorus recovery and disinfection, additional steps are
needed according to Tarpeh et al. (2018a). To enable phosphorus recovery, a treatment
step with struvite precipitation can be applied and the residual streams could be treated
in a WWTP (Tarpeh et al. 2017) (Figure 3).
Struvite (MgNH4 PO4 · 6 H2 O) is precipitated from urine by adding a magnesium source
and separated from the liquid by filtering (Antonini 2013, Etter & Udert 2015). The
dried product is a powder that may be used as a fertilizer (McConville et al. 2020).
Studies have shown that with struvite precipitation, over 90% of the phosphorus in the
urine could be removed (Antonini 2013, Etter & Udert 2015). Furthermore, Antonini
(2013) performed a study on nutrient recovery with struvite precipitation combined with
ammonia striping. It was found that less than 1 kWh per 50 L urine was used for struvite
precipitation. For the pathogen inactivation from the struvite fertilizer product, drying
at a low relative humidity and at temperatures above 35 C is recommended; the drying
temperature should however be under 40-55 C to avoid struvite decomposing (Decrey et
al. 2011). According to Decrey et al. (2011), urine and struvite storage could also result
in pathogen inactivation.
Figure 3: Schematic representation of the ion-exchange system set-up with struvite pre-
precipitation.
73 Method
This study was structured as a fictional case study for Sege Park in Malmö, Sweden,
and investigated if applying urine concentration technologies could contribute to different
SDGs connected to the criteria investigated. In order to assess the different urine concen-
tration technologies, a MCA was used. Criteria for the MCA were assigned based on the
SDGs and the data available from previous studies concerning the urine concentration
technologies investigated. The study examined if the application of urine concentration
technologies could contribute to making Malmö a more sustainable city by recovering
nutrients from urine (SDG 6.3, 9 and 12) and reducing the nutrient emissions to Öresund
(SDG 14). The study also examined if the investigated urine concentration technologies
would be affordable for the habitants of Malmö (SDG 6.2), and if they would be space
(SDG 11) and energy efficient (SDG 9). Finally, in order to have a safe working en-
vironment, it is essential for the technologies and the concentrated product to be safe
to manage (SDG 3 and 8). Information and data for the different urine concentration
technologies were obtained from research articles, where the technologies and their per-
formance had been addressed. Data from the literature was used to perform calculations
in order to investigate the performance of the different urine concentration technologies
for the selected criteria in the MCA.
3.1 Sege Park
Sege Park is located in Malmö, Sweden, and is an area where 700 new homes will be con-
structed during the period 2021-2025 (Malmö Stad Stadsbyggnadskontoret 2017, Malmö
Stad 2021, 2015). The new homes will mainly be in apartment buildings, but also in
terraced houses, and both consist of newly built houses as well as renovated buildings.
The new buildings will be 2-6 floors, mostly between 3-5 floors (Malmö Stad Stadsbyg-
gnadskontoret 2017). The ambition for this area is to be a testbed for the installation
of urine diversion in at least one of the buildings, with the aim of recovering nutrients
and reducing nutrient emissions (Malmö Stad 2015). This thesis was inspired by the new
area Sege Park. However, the resulting impact of the implementation would be small and
therefore a fictional case study was examined, where it was assumed that urine concen-
tration technology was applied in all new buildings in Sege Park. In the study, it was
therefore assumed that urine concentration technologies would be installed in all 700 new
homes, and that the average household consisted of three persons (in total 2100 persons).
The assumed composition of the household wastewater from Sege Park is presented in
Table 1. The proportion of the time that would be spent at home was assumed to be
2/3 of the day because, according to von Münch & Winker (2011), it is a commonly used
design criteria. From this information the mass of faeces and urine produced, and the
corresponding mass of the nutrients, was multiplied with a factor of 2/3. However, it was
assumed the washing, dishing and showering was performed at home and therefore all of
the greywater produced by the population of Sege Park was assumed to be produced in
the residential area.
3.2 Systems and system boundary
The baseline in this study was a conventional system (Figure 4). The conventional system
included a standard toilet and the household wastewater (blackwater and greywater) was
8assumed to be transported to Sjölunda Wastewater Treatment Plant for treatment using
the conventional municipal wastewater grid. The sludge produced at Sjölunda WWTP is
REVAQ-certified and can therefore be used as fertilizer (VA SYD 2019). In this study,
all of the sludge produced at the WWTP was assumed to be applied as fertilizer.
Figure 4: A schematic illustration of the baseline system (the conventional system) where
a standard toilet is used and the household wastewater, including urine, is treated at
Sjölunda Wastewater Treatment Plant.
For the criteria energy demand, a system expansion was used in order to calculate the en-
ergy demand corresponding to commercial N and P fertilizer production that was assumed
to be replaced with the fertilizer produced by urine concentration (Figure 5).
Figure 5: A schematic illustration of the system expansion for the conventional system
where commercial fertilizer production is included.
The urine concentration technologies investigated were alkaline dehydration, nitrification-
distillation and ion-exchange with struvite pre-precipitation. For the urine concentrating
technologies, it was assumed that the urine was diverted by urine diverting toilets and
transported to a semi-centralized treatment plant in the residential area (Figure 6). The
alkaline dehydration system included a limebox in the toilet that added MgO to the urine
in order to prevent urea hydrolysis. The blackwater, urine excluded, was assumed to be
transported to Sjölunda WWTP for treatment using the conventional municipal wastew-
ater grid. For the ion-exchange system, the urine treatment generated a rest product that
was assumed to be transported to the WWTP as well. All urine concentration systems
included the nitrogen and phosphorus recovery from the urine concentration technologies
as well as the REVAQ sludge.
9Figure 6: A schematic illustration of the different urine concentration systems where a)
is the alkaline dehydration system, b) is the nitrification distillation system and c) is the
ion exchange system.
3.3 Multi-criteria assessment
Multi-criteria assessment (MCA) is a tool for evaluating the sustainability of different sys-
tems by investigating different criteria. The MCA can give perspectives of the systems and
shows advantages and disadvantages (Lennartsson et al. 2009). However, the method does
not give a complete assessment of the sustainability and are sometimes more suitable for
comparing different systems performing the same task rather than providing information
about the total anthropogenic impact (Hellström et al. 2000). Kvarnström et al. (2004)
divided criteria for sustainability assessment in five categories; health, environment, econ-
omy, technical function and socio-culture. In order to perform the assessment, different
criteria are decided within the categories. The criteria may be assessed quantitatively or
qualitative. Indicators are assigned to measure the investigated criteria (Hellström et al.
2000).
The categories investigated in the MCA in this study were environment, technical func-
tion, economic and health. In deciding the criteria for the MCA, inspiration was taken
from SuSanA (2017) and the SDGs and their targets (Figure 7).
10Figure 7: A schematic representation of the SDGs and the specific targets that the criteria
for the MCA were derived from in order to investigate the sustainability for the different
urine concentration technologies.
Based on the SDGs and their targets, the criteria in Table 2 were decided to be examined.
The assessment mainly focused on the environment, where three criteria were examined.
For the other categories one criteria each was investigated. Each criteria was assigned at
least one indicator.
11Table 2: The criteria and their respective indicators investigated the MCA.
Category Criteria SDG Analysis Indicator
Concentration of N
in WWTP emissions
Eutrophying (mg/L)
14 Quantitative
emissions Concentration of P
in WWTP emissions
Environment (mg/L)
% N-recovery from total
Nutrient 6, 9, household wastewater
Quantitative
recovery 11, 12 % P-recovery from total
household wastewater
% of annual apartment
Energy
9 Quantitative energy demand for
demand
urine concentration
Space required in
Space
Technical 11 Quantitative residential area
efficiency
(m2/household)
Cost and Annual cost per
Economic 6 Quantitative
affordability household (SEK/year)
Working Additional risk with
Health 3, 8 Semi-quantitative
environment urine concentration
3.3.1 Performance
The performance for each indicator was evaluated and then graded on a five-point scale,
where 5 represents very good and 1 very poor. The grading scale is presented per indicator.
The scale and its limits were decided based on relevant data such as threshold values or
other information that provides perspective on the indicator. The performance was also
given a corresponding color for visual understanding of the grading. The scale is defined
below:
Green : 5 - Very good
Lime : 4 - Good
Yellow : 3 - Neither good nor bad
Orange : 2 - Poor
Red : 1 - Very poor
3.3.2 Eutrophying emissions
Data for the wastewater volume and nutrient concentrations in the influent to and effluent
from Sjölunda WWTP were collected from available environmental reports for Sjölunda
WWTP from the years 2015, 2016 and 2019 (VA SYD 2015, 2016, 2019). The nitrogen and
phosphorus removal in the WWTP was calculated using data for incoming and outgoing
concentrations for each year. The calculations were performed for each of the three years
to investigate the resulting percentage change in the concentration of the emissions. The
12change was found to be very small between the years and therefore the result of the most
recent data (2019) was used for the performance evaluation.
Since Sege Park is a new residential area, it generates additional wastewater to what is
already treated in the WWTP. The composition of the additional fraction of wastewater
from Sege Park was calculated based on the assumed composition of household wastewater
and assumed proportion of time spent at home in 3.1. Assumptions for the calculations
are summarized in Appendix A.
The volume wastewater produced in Sege Park was calculated by transforming the mass
of the wastewater fractions produced per person and day to the volume in liters and
multiplying it with the population in Sege Park. For urine and greywater, it was assumed
that the mass could be directly transformed to volume. The density used for faeces
and toilet paper were 1,075 kg/L and 1,4 kg/L, respectively. The calculations for the
conventional system included the volume and the mass of nitrogen and phosphorus from all
fractions. By using alkaline dehydration and nitrification-distillation systems the nitrogen
and phosphorus in the urine were assumed to not be treated at the WWTP. Therefore,
the volume of urine and the nutrients in the urine were excluded from the calculations of
wastewater volume and nutrients produced in Sege Park. However, for the ion-exchange
system the volume wastewater as well as nitrogen and phosphorus concentration in the
wastewater was calculated differently, since the wastewater from the ion-exchange system
was assumed to be treated at Sjölunda WWTP. The volume reduction of the urine for
the ion-exchange system was assumed to be small and was therefore considered negligible.
Nevertheless, the nitrogen and phosphorus in the urine were reduced with 99 and 93%,
respectively. These numbers are based on the potential nutrient removal through the
use of struvite precipitation and ion-exchange and are based on studies from Etter et al.
(2015) and Tarpeh et al. (2018b).
The resulting concentration of nitrogen and phosphorus the influent to Sjölunda WWTP
was calculated as:
cin = cSege P ark · fSege P ark + cER · fER (2)
where, cSege P ark is the nutrient concentration in the wastewater from Sege Park, fSege P ark
is the fraction from Sege Park of the total incoming wastewater to Sjölunda WWTP, cER
is the incoming concentration and fER is the fraction of incoming wastewater from the
rest of the city according the environmental reports. The resulting concentration of the
eutrophying emissions from the WWTP for the different systems was calculated using the
phosphorus and nitrogen removal efficiencies in the WWTP.
For the nitrogen emission, the grading of the performance was decided based on the 2019
annual mean emissions from Sjölundas Wastewater Treatment Plant, which was 12 mg/L
(VA SYD 2019) and the regulations in NFS 2016:6 (Swedish EPA 2016). According to
the regulations the highest annual mean nitrogen concentration allowed in the effluent
is 10 mg/L for a WWTP treating wastewater from >100,000 people. As of today, the
effluent from Sjölunda exceeds the allowed concentrations, but it fulfills the regulations
by having >70% annual nitrogen removal efficiency. The nitrogen concentration in the
wastewater to Sjölunda WWTP was around 42 mg/L for the conventional system and
the percentage removal at Sjölunda WWTP was calculated from this value. According
to Åmand et al. (2016) Swedish treatment plants may face stricter requirements for
13nitrogen and phosphorus emissions in the future. What these requirements will look like is uncertain, but limit values of 5-6 mg N/L for nitrogen has been mentioned. Based on this information the performance was graded accordingly: 5 - Very good : Annual mean nitrogen removal efficiency >85% corresponding to a con- centration of 95% removal efficiency). 3 - Neither good nor bad : Annual mean concentration of phosphorus in effluent from the WWTP is 0.28-0.34 mg/L (>93% removal efficiency). 2 - Poor : Annual mean concentration of phosphorus in effluent from the WWTP is 0.35–0.50 mg/L (>90% removal efficiency). 1 - Very poor : Annual mean concentration of phosphorus in effluent from the WWTP is >0.50 mg/L (
For the urine concentration systems the percentage recovery from the faeces and grey-
water in the WWTP was assumed to be the same as for the conventional system. The
nutrient recovery for the urine concentration technologies was calculated using the poten-
tial maximal recovery for the different technologies. The reason for using the potential
recovery was to give a fairer comparison between the different technologies, since they
are at different stages of development and have not yet been optimized. For the recovery
calculations it was also assumed that no nitrogen was lost in the pipe transport nor in
the urine storage tank due to sealed storage and non-leaking pipes.
Regarding nitrogen recovery, the Swedish EPA (2013) suggested a target of a minimum of
10% return to agricultural land before 2018. Based on the suggested target and considering
that the biogeochemical flows of nitrogen has exceeded the planetary boundaries according
to Steffen et al. (2015), the system performance in the MCA for recovery of nitrogen were
decided accordingly:
5 - Very good : Nitrogen recovery from total household wastewater is >50%.

4 - Good : Nitrogen recovery from total household wastewater is 30–50%.
3 - Neither good nor bad : Nitrogen recovery from total household wastewater is 10-29%.

2 - Poor : Nitrogen recovery from total household wastewater is 1-9%.
1 - Very poor : Nitrogen recovery from total household wastewater is 90%.

4 - Good : Phosphorus recovery from total household wastewater is 70–90%.
3 - Neither good nor bad : Phosphorus recovery from total household wastewater is 50–69%.

2 - Poor : Phosphorus recovery from total household wastewater is 30–49%.
1 - Very poor : Phosphorus recovery from total household wastewater is
In order to calculate the energy demand of the fertilizer production, data for the average
energy demand for N and P fertilizer production in Europe from a study by Maurer et al.
(2003) was used. For the nitrogen removal in the WWTP, an average value for the energy
demand of aeration and addition of external carbon source were calculated based on data
collected from Maurer et al. (2003) as well as Kavvada et al. (2017). These calculations
are described in Appendix A.
According to Vattenfall (2020), the energy consumption for an apartment is around 2400-
4800 kWh per year, depending on the size. From these values, the medium energy con-
sumption per apartment and year (3600 kWh) was compared with the medium energy
demand per household and year for the different urine concentration technologies. The
grading used for the MCA is presented below:
 5 - Very good : The annual energy consumption is 50% of the apartment energy con-
sumption.

3.3.5   Space efficiency
The space required per unit was decided based on literature values and assumptions when
data was missing. The nitrification-distillation technology requires 5 m2 for one reactor
and a total of 10 m2 per unit (Etter & Udert 2015). From this information, it was assumed
that the space required for the urine concentration technology set up would be twice the
space of the reactor. The alkaline dehydration technology was assumed to require about
3 m2 per reactor based on a field study performed by Simha et al. (2020c). The total
area required was then assumed to be 6 m2 per unit based on the previous assumption
that the urine concentration set up would need twice the space of the reactor. Based on
the treatment capacity, 70 units were needed for both the nitrification-distillation and
the alkaline dehydration system to treat the urine from Sege Park. For the ion-exchange
system, no data was found concerning the space required for this set-up. Therefore,
considering the amount of components, it was assumed that it would require about the
same space as the nitrification-distillation system, thus 10 m2 per unit. A hypothetical
ion-exchange system was designed for this study and assumed to be able to treat 100 L
of urine per day, thus only 22 units were assumed to be required.
The criteria was evaluated based on the space required in the residential area and the fact
that the urine concentration could compete with space needed for parking windows in e.g.
underground parking garages. The grading of the space efficiency was then decided con-
sidering the sustainability strategy from Malmö Stad (2015) for the area, which suggests
that parking space for maximum 0.5 cars per household will be provided. According to
Malmö Stad Stadsbyggnadskontoret (2017), parking will mainly be provided in a planned

                                            16
parking garage, but underground parking is also included in the plan. Given that a stan-
dard parking window is 12.5 m2 and that each household requires 0.5 parking window, the
space for parking was assumed to be 6.25 m2 per household. Based on this information
the performance for the different systems in the MCA was decided accordingly:
5 - Very good : Space required per household is 40% (>2.5 m2 ) of household parking
window
3.3.6 Cost and affordability
The cost estimation was based on the cost of the components and the operation and main-
tenance (O&M) cost for each system. Additional cost for installation was not considered
since the urine concentration technologies are under development and have not yet, to the
best of our knowledge, been applied at larger scale at the time of this study. Neither was
a safety factor for fluctuations of the volume urine taken in consideration for the fictional
systems. Furthermore, the systems have not yet been optimized and were therefore not
optimized in this study either. Hence, the estimations have a large uncertainty and should
therefore rather be seen as a tool for comparing the cost between the systems than the
actual cost for the systems.
The cost estimation was performed with the conventional system as a baseline. It was also
assumed that the additional cost for the urine piping was negligible when constructing a
new area. In addition, the piping costs would be approximately the same for the urine
concentration systems in any case. Design parameters and assumptions for the different
systems are summarized in Appendix B. For the alkaline dehydration technology, the cost
was estimated based on the system set-up for the field study in Finland performed by
Simha et al. (2020c). It was assumed that it would give an idea of the cost for the system
in this thesis. The nitrification-distillation set-up was assumed to be the one presented by
Etter & Udert (2015) where the costs for the different components also were presented.
The treatment capacity of the system was decided based on an assumed nitrification rate
of 450 mg N/L reactor and day and the nitrogen concentration in the urine decided based
on the values in Table 1. The ion-exchange system was in this study designed to treat
100 L urine per day and included weekly regeneration. The set-up took inspiration from
relevant literature and for further information (Table 21).
The annuity method was used to calculate the annual costs (Ca ) according to
p
Ca = Cc · n
+ CO&M (3)
1 (1 + p)
17where, Cc is the capital cost, p is the discount rate, n is the lifetime in years and CO&M
is the O&M costs (Kärrman et al. 2017). The lifetimes were estimated based on Svenskt
Vatten (2015) and from the lifetime the corresponding discount rate was assumed accord-
ing to the rates suggested by Söderqvist (2006). The costs were assumed to be shared by
the residents of Sege Park.
The performance grading in the MCA was based on the usage fee in Malmö that was
3100 SEK per year in 2020 and the average usage fee in Sweden that was 4900 SEK per
year in 2020 for a standard apartment according to Svenskt Vatten (2020a). The conven-
tional system was set as a baseline and the additional costs for the urine concentration
technologies were evaluated as follows:
5 - Very good : Additional annual costs of 3500 SEK/household
3.3.7 Working environment
All systems were assumed to be safe to use for the population in Sege Park because the only
difference at the household level for the different systems investigated was the toilet. The
use of the recovered nutrients as fertilizer was assumed to be safe after four days of storage
for the alkaline dehydration technology (Senecal et al. 2018). The use of the concentrate of
nutrient from the nitrification-distillation technology was also assumed to be safe, because
the technology has a complete pathogen inactivation due to the distillation (Etter & Udert
2015). For the ion-exchange system, based on Swedish EPA (2013) report, it was assumed
that the urine was stored for 30 days prior to the treatment in order to be safe to use
on the fields. Therefore, the health assessment focuses on the health risks operating the
different systems.
To evaluate the performance for the health of the workers a Semi-quantitative risk assess-
ment was used. The method is described in the manual Sanitation Safety Planning by
WHO (2016) and is based on a relation between the severity (S) and the likelihood (L)
that defines the level of the risk. The likelihood scale goes from very unlikely, where the
hazard has not occurred before and not likely to happen within the next year, to almost
certain, where the hazard has been reoccurring in the past and is highly probable to occur
within the following year almost regardless of the circumstances. The severity is defined
from insignificant, where the hazard causes no or almost no negative health effects, to
catastrophic, where the health effects are serious and may even be life-threatening. The
relation is presented in Table 3, which is a version of the one presented in the manual,
but the risk level low is divided into low and very low creating five risk levels instead of
four.
18Table 3: Modified matrix for semi-quantitative risk assessment from the manual Sanitation
Safety Planning by WHO (2016).
Severity [S]
Insignificant Minor Moderate Major Catastrophic
1 2 4 8 16
Very unlikely 1 1 2 4 8 16
Likelihood [L]
Unlikely 2 2 4 8 16 32
Possible 3 3 6 12 24 48
Likely 4 4 8 16 32 64
Almost certain 5 5 10 20 40 80
Risk score R=L·S 32
Risk level Very low Low Medium High Very high
The risks concerning the maintenance and operation of the wastewater treatment for
the different technologies were evaluated and hazardous events were identified through
a literature study. Hazards for the urine concentration systems were identified from the
chemicals used, system maintenance, process failure and the pathogen reduction in the
recovered concentrate of nutrients that were described in studies concerning the different
technologies (Etter & Udert 2015, Tarpeh et al. 2018a, Senecal 2020, McConville et al.
2020). The risks associated with the process chemicals were identified through chemical
data sheets. Information about the hazardous events connected to the wastewater treat-
ment at the WWTP were collected from a summary by IVL (2020) and they apply to
all systems, since the systems for urine concentration also were connected to the WWTP.
The basis for the risk analysis can be found in Appendix C.
The likelihood and severity of the hazardous events were determined according to the
manual by WHO (2016) and then the risk level was determined by the risk score according
to Table 3. The conventional system was set as a baseline for the performance evaluation.
Therefore, the performance was decided considering the additional risk associated with the
urine concentration technologies. The performance of the urine concentration technologies
was determined accordingly:
5 - Very good : Of the risks connected to urine concentration no risk levels are high or
very high and the total risk score isYou can also read