Sustainability: Performance against our capitals 2019/20 - The ...
←
→
Page content transcription
If your browser does not render page correctly, please read the page content below
Sustainability: Performance against our capitals 2019/20
CONTENTS                                                    OU R C A PI TA L S

OVERVIEW                          01-05
Context to this report                   01                            Natural resources
Our capitals                             02                            The natural resources
                                                                        that we manage
Our Aspirations 2030                     04                            and use.

NAT U R A L R ESOU RCES            06-19
                                                                        Our people
Introduction07                                                         The skills
                                                                        and experience
Climate action                           07
                                                                        of our employees.
— Energy and carbon                      08
— Renewables                             13                            Our know-how
Super-efficiency                         14                            Our collective expertise
                                                                        and processes.
— Building materials                     14
— Waste                                  14
                                                                        Our networks
— Water                                  17                            Our relationships with
                                                                        stakeholders, including
Healthy places and habitats              18                            customers, partners
                                                                        and communities.
— Healthy places                         18
— Healthy habitats                       18
                                                                        Physical
                                                                        resources
                                   20-28
OUR PEOPLE
                                                                        The land and property
AND KNOW-HOW
                                                                        that we own and utilise.
Introduction21
                                                                        Financial
Employee engagement                      21                            resources
Staff mix                                22                            The financial resources
                                                                        that are available to us
Health and safety                        23                            to grow our business.

Wellbeing24
Diversity and Inclusion (D&I)            24
                                                           Assurance
Learning and development                 26
Living Wage                              26               KPMG LLP has provided
                                                           independent limited assurance
Staff turnover                           27               over selected data included within
                                                           our integrated Annual Report at:
                                                           thecrownestate.co.uk/2020-
OUR NETWORKS                      29-35                   annual-report-document, using the
                                                           assurance standard ISAE 3000
Introduction30                                            and, for selected greenhouse
                                                           gas data, ISAE 3410. KPMG has
Stakeholder engagement                   30               issued an unqualified opinion over
                                                           the selected data and their full
Our customers                            30               assurance statement is available on
                                                           our website which, together with our
Our communities                          32               Reporting Criteria, should be read in
                                                           conjunction with the selected data
Our supply chain                         34               in this report. See both KPMG’s
                                                           opinion and our Reporting Criteria
                                                           at:thecrownestate.co.uk/
NEXT STEPS FOR 2020/21                  36                assurance-reporting.
                                                           The data subject to
ANNEX 1                                 37                KPMG’s assurance has been
                                                           reproduced in this report
Breakdown of Scope 1, Scope 2                              where you see the symbol
and Scope 3 carbon emissions             37

                                                           September 2020

THE CROW N ESTATE
Sustainability: Performance against our capitals 2019/20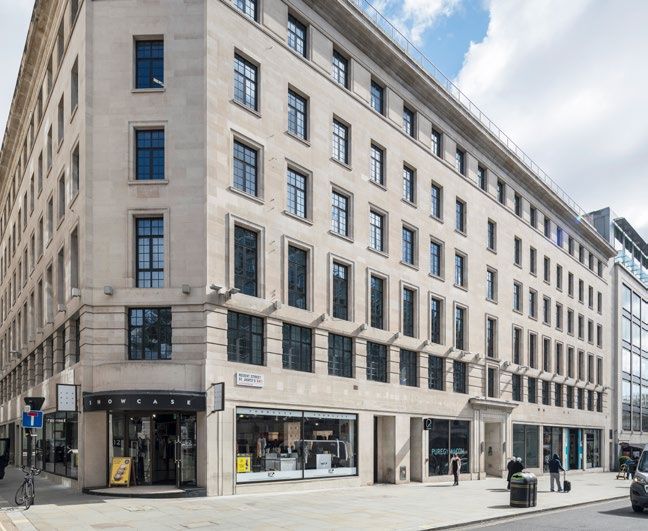
01

Overview
In this sustainability report we consolidate and add to the information given
in our Integrated Annual Report and Accounts 2019/20 (Annual Report) on
environmental and social performance. It complements the Annual Report
and should be read in conjunction with it. A copy can be found at:
thecrownestate.co.uk/2020-annual-report-document.
This report is structured around our capitals (also referred to as our resources
and relationships), which we draw on to create value (see previous page).
We rely on the capitals as vital inputs into our business model and draw
on them through our activities.
As our Physical and Financial resources are considered in our Annual Report,
this report focuses on our performance against the remaining capitals – Natural
resources, Our people, Our know-how and Our networks. However, all six capitals
are heavily inter-connected and very little of what we discuss in this report could
be achieved without also drawing on our Financial and Physical capitals.
Much of the activity reported took place before the arrival of COVID-19.
In recognition of its far-reaching implications across our business, in our
networks and across the world, the impact of the pandemic has been cited
throughout the report as appropriate. A more detailed account of our operational
response relating to our customers and wider networks can be found on
page 18 of our Annual Report.

Context to this report
The last reporting year, and in particular the past few months, have seen an
extraordinary amount of economic, political and systemic change. Many of
the major, long-term trends that have been impacting society, such as climate
emergency and technology, have continued and become even more apparent
through the effects of COVID-19. Internally we have welcomed a new
Chief Executive, Dan Labbad, and have begun a deep review of our purpose,
strategy and associated objectives and targets to ensure that the business
is best positioned to create value in the widest sense.

For a number of years we have reported against our Aspirations 2030, which
were developed to help achieve our strategic objective to be a leading responsible
and resilient business which thinks long term. However, whilst we have made
good progress against these (see pages 04 and 05), we know we need to be much
more ambitious in order to play an active and leading role across all the sectors
in which we operate, in support of the UK’s transition to net zero carbon.

As a first step, we will shortly be setting out how we will become a net zero
carbon business, aligning to the United Nation’s Sustainable Development
Goals (SDGs) which are referenced overleaf and throughout this report.

                                                                                         THE CROW N ESTATE
                                                              Sustainability: Performance against our capitals 2019/20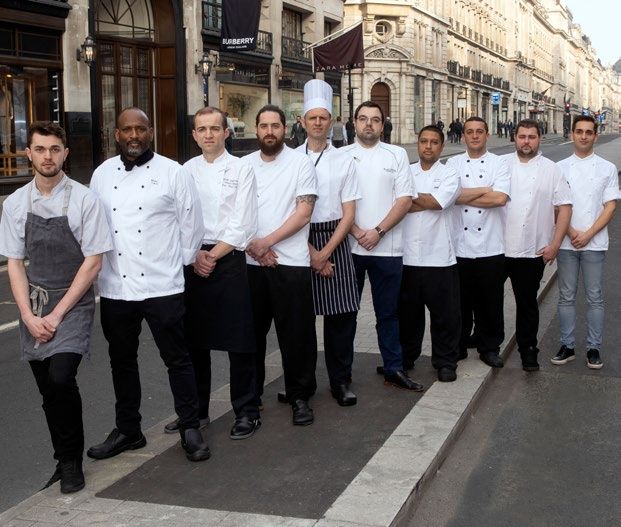
02

Our capitals
This report covers four of our six                         Capitals
capitals. Our people and Our know-
how are reported together as they
are intricately linked.                                    Natural
We rely on our capitals as vital inputs                    resources
into our business model and we                             The natural resources that we
draw on them through our activities,                       nurture, manage or use to sustain
increasing and diminishing the stock                       our business, many of which are
                                                           finite and irreplaceable.
of value in each. By acting carefully,
the diminution of value in one capital                        Read more p06

can positively transform the value
in others.
We measure our impact on Natural
resources through our Aspirations
2030 (see pages 04 and 05).
Using our Total Contribution
methodology we have applied an
economic value to a number of
non-financial indicators to give a                         Our people
comparable indication of impact.                           and know-how
See impact data on pages 10, 13,                           The individual skills,
21, 23 and 32.                                             competencies and experience
                                                           of our people which create value.
                                                           Also, our collective expertise
     	For more information see:                           and processes which provide
      thecrownestate.co.uk/
      total-contribution/methodology                       us with competitive advantage.

                                                              Read more p20

                                                           Our networks
                                                           The relationships we have with
                                                           stakeholders, including our
                                                           customers, communities,
                                                           and partners that are central
                                                           to our business.

                                                              Read more p29

THE CROW N ESTATE
Sustainability: Performance against our capitals 2019/20
03
Creating value in our capitals Alignment to UN Sustainable
Development Goals (SDGs)
Delivering optimal working Ensure access to
affordable, reliable,
Make cities
inclusive,
environments, smartly sustainable and
modern energy
safe, resilient,
and sustainable
for all
Smart buildings can reduce energy use, carbon
emissions and costs as well as increase productivity. Ensure Take urgent
sustainable action to combat
Read more p09
consumption climate change
and production and its impacts
Waste not, want not patterns
12 restaurateurs trial exciting and innovative Conserve and Protect, restore
sustainably use the and promote
solutions to reduce their food waste. oceans, seas and sustainable use
marine resources of ecosystems,
Read more p16
for sustainable land and
development forests, and halt
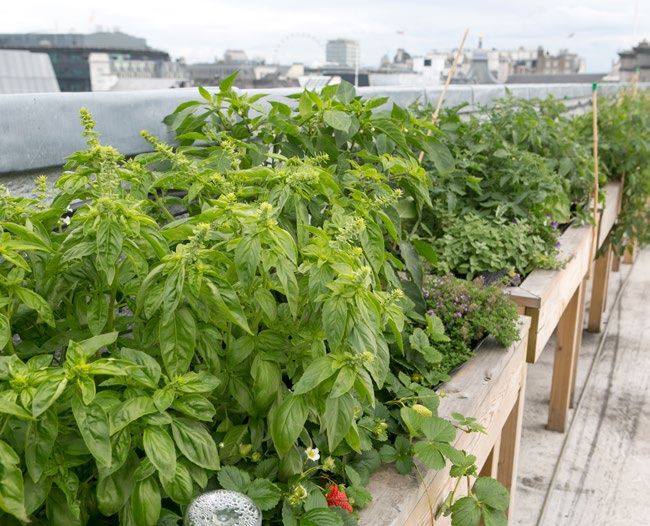
Allotments in the sky biodiversity loss
On a rooftop in Regent Street gardeners are creating
a haven for wellbeing and biodiversity.
Read more p19
Becoming more diverse Ensure healthy
lives and promote
Reduce inequity
within and
and inclusive wellbeing for all,
at all ages
among countries
By attracting a diverse group of people to our
business and our destinations we create value for all.
Read more p28
Ensuring a thriving future Promote inclusive
and sustainable
Reduce inequity
within and
for aggregates economic growth,
employment and
among countries
decent work for all
Equipping the industry with knowledge
and skills for continued success.
Read more p35
THE CROW N ESTATE
Sustainability: Performance against our capitals 2019/2004
Our Aspirations 2030
Our Aspirations are primarily environmental, as are the majority of the targets associated
with them. They are discussed predominantly in the Natural resources section of this
report on pages 06 to 19. As highlighted on page 01, our Aspirations and the associated
targets will be refreshed in the year ahead as part of our internal strategic review and
commitment to becoming a net zero carbon business.
Aspirations 2030 Indicator Target
40%
Carbon Improve carbon emissions intensity by a further
intensity 40% from a 2012/13 baseline for properties
under our direct control (by 2022/23)
100%
Purchased 100% of electricity procured from renewable sources
Climate renewables (by 2022/23)
action
8-10GW
Renewables Effectively realise value from the natural resources
generation of the seabed (England, Wales and N Ireland), including
facilitation of 8-10GW of offshore wind capacity
(by 2020/21)
6.5t/
Waste generation Aggregated total construction waste generated
– developments on completed development projects to be no more
than 6.5t/100m2 (Gross internal area) (by 2022/23)
100m2
95%
Waste recycling 95% of demolition and construction waste generated
Super-efficiency – developments from major and moderate projects operating under
Development Sustainability Principles (DSPs) v3
to be reused or recycled (by 2022/23)
80%
Waste recycling 80% of waste generated from managed assets
– managed assets (where we have operational control) to be reused
or recycled (by 2022/23)
5,000m2
Valuable Create at least 5,000m2 of additional, valuable green
green space space compared to 2012/13 baseline (by 2022/23)
50%
Sites of Special Scientific Interest 50% of SSSIs (Windsor) to be in ‘favourable’ condition,
Healthy places (SSSIs) whilst maintaining at least 95% in ‘favourable or
and habitats
recovering’ condition (by 2020/21)
10%
Health & Safety 10% year-on-year improvement in Incident Severity
– Incident Severity Score Score based on a rolling three-year average
Independent limited assurance (see inside front cover)
THE CROW N ESTATE
Sustainability: Performance against our capitals 2019/2005
Key
Achieved
On track
Not on track but achievable
At risk
Not achieved
No data to report
Progress Status Alignment to SDGs
38%
improvement against the 2012/13 baseline
(6.1% year-on-year improvement)
88%
of electricity purchased is from renewable sources
9.3GW
cumulative offshore wind capacity operational
(1.6GW additional capacity achieved over 2019/20)
11.61t/
no projects were completed in 2019/20
100m2
N/A
projects working to DSPs v3 are not yet generating waste
55%
of operational waste is recycled
3,362m2
total valuable green space created to date
100%
in favourable condition
-31%
underperformance against the target
THE CROW N ESTATE
Sustainability: Performance against our capitals 2019/2006
Capital:
Natural resources
We all depend on natural resources, Introduction
Climate action
07
07
not just for our business activity, — Energy and carbon
but for survival, and realise that — Renewables
many are finite or being used at Super-efficiency 14
a rate beyond which they can be — Building materials
— Waste
sustainably renewed. As part of our — Water
business activity we manage natural Healthy places and habitats 18
resources of national significance, — Healthy places
— Healthy habitats
from the Windsor Estate and our
rural holdings, to marine aggregates
and the seabed more broadly.
THE CROW N ESTATE
Sustainability: Performance against our capitals 2019/2007
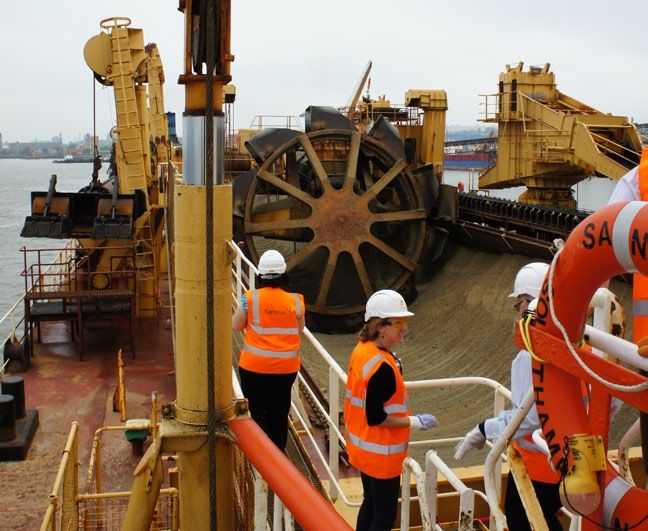
Introduction We are pursuing greater sustainability In the summer of 2019, and for the first
outcomes at all stages of our development time in the UK, 3.2 million tonnes of sand
Recognising the finite and irreplaceable
projects. In this latest version of the DSPs from the seabed was placed on the coast
nature of many of our natural resources,
we have placed an emphasis on: in north Norfolk to create the Bacton to
we have a responsibility to measure and
– Resilience – spaces will be flexible Walcott Sandscaping scheme. This has
mitigate our impact on them, to enhance
and adaptable over the long term been designed to protect the Bacton gas
their value within the communities in which
terminal and nearby coastal villages from
we operate, and to be considerate in our – Efficiency – assets should minimise
coastal erosion, and represents a ‘first
use of them. We do this working with our costs and the use of resources
of a kind’ engineering solution in the UK.
networks (all of our stakeholders, including – Innovation – working in partnership with Working with nature, over time the sand will
our customers, communities and supply our supply chain, developments should be moved naturally by currents and tides
chain) and know that there is a lot more seek to identify continual improvement to continuously replenish the beaches
to do.
– Customers – buildings will deliver healthy, of neighbouring villages. With a design
The COVID-19 pandemic has helped all of productive and accessible environments life of 20 years it provides a high level of
us to appreciate the benefits of the natural – Community – developments will have protection and gives the community vital
environment for our own health and mental a positive role in, and integrate with, time to plan for the future.
wellbeing and to see how different ways local communities. Our involvement in the £20 million project
of working and lifestyle can transform
was as programme initiator and joint
some of the negative impacts we have Climate action developer, delivering research, engaging
had on the environment. The pandemic
In line with SDG 13 (Climate action) we stakeholders, as well as providing a
presents both challenges and opportunities
continue to work to mitigate our impact and new regulating lease for the enlarged
and has reinforced understanding of the
are committed to working towards achieving beach. The sand used to replenish the
interdependencies between the capitals.
net zero carbon. Acknowledging the global beach was supplied from Crown Estate
urgency of this issue, and the enormity dredging licences.
OU R A SPI R AT IONS 2 0 3 0
of this undertaking, we will be shortly
We are working towards our ambitious setting out how we will become a net NEXT STEPS
sustainability Aspirations 2030, which zero carbon business.
will help future-proof our business: – Set out our commitment and
For a number of years we have been
Climate action approach to achieving net zero
working with the offshore wind industry and
carbon for the business
To be climate resilient by 2030, with stakeholders to help achieve a low-carbon
portfolio decarbonisation and effective energy system and have recently launched – Extend climate change physical
climate change adaptation in place. Offshore Wind Leasing Round 4 to facilitate risk analysis to other parts of
the growth of this sector. the portfolio (TCFD)
Super-efficiency
In addition, we recognise the need to – Assess climate change transition
By 2030, we will have closed the waste
identify where and how to adapt to climate risk in moving towards a 1.5 degree
loop using circular economy principles.
changes that are already happening. Celsius scenario (TCFD)
Healthy places and habitats To this end we are working on a voluntary
basis towards the recommendations
By 2030, to be creating healthy places
of the Taskforce for Climate-Related
where our customers, employees,
communities and natural habitats Disclosure (TCFD). We have developed
can thrive. a draft roadmap on disclosure and have
undertaken some preliminary scenario
analysis on our Central London and
Our Aspirations 2030 are especially
Regional portfolios. Read more on TCFD
relevant to this part of the report,
on page 35 of our Annual Report at:
and it has been structured around them.
thecrownestate.co.uk/2020-annual-
It is worth drawing attention to our report-document. Work undertaken on
Development Sustainability Principles TCFD will result in recommended action
(DSPs) v3 at: thecrownestate.co.uk/DSP- to take on strengthening resilience and
2019, launched in May 2019. Although we the adaptive capacity of our portfolio
are a multi-faceted real estate owner, our to climate-related hazards.
property development pipeline is material
We have been working for a number of years
to the consideration of our impact on
to adapt in different parts of our portfolio,
natural resources and the DSPs set out
for example on the Windsor Estate where
valuable principles and requirements of the
we have been growing tree species which
organisations we work with.
are more resilient to expected climate
changes. Likewise, across the rural portfolio
we have been investing in drainage schemes
to improve resilience (over £1.5 million since
2014). Benefits have already been seen
by our customers on the Ellington Estate
through improved soil health and crop yields.
THE CROW N ESTATE
Sustainability: Performance against our capitals 2019/2008
C A PITA L: NAT U R A L R ESOU RCES
continued
Energy and carbon Energy intensity (kWh per sq m) (based
In line with our net zero carbon agenda our on floor space) has increased by one METHODOLOGY
priorities are to reduce our energy intensity indexed point to 94 points. This increase We quantify and report our
and to better understand, and account for, largely reflects the number of properties organisational Greenhouse Gas (GHG)
our Scope 3 emissions (indirect emissions coming back into the portfolio through emissions according to the GHG Protocol,
from our value chain). We will be working our development pipeline in recent years. using the operational control approach.
more on both over the coming year. Energy use data has been collated
In accordance with Streamlined Energy
For transparency, our reporting shows and Carbon Reporting (SECR) we report and converted into carbon dioxide
progress against our Aspiration 2030 – energy efficiency measures taken during equivalent (CO2e) using the
climate action targets and is in line with the reporting year with associated UK Government 2019 Conversion
regulatory requirements and stakeholder savings. In the 2019/20 financial year the factors for Company Reporting and
expectations. Our reporting on energy and Central London portfolio realised energy the International Energy Agency (IEA)
carbon will increase as we work to achieve savings of approximately 2,597MWh international electricity conversion
net zero carbon. The methodology applied (£310,000 in cost savings) as a result factors, in order to calculate emissions
to the quantification and reporting of our of building management system (BMS) from corresponding activity data.
data, is given in the green panel opposite. optimisations, improved maintenance This report has been prepared in
programmes, energy management accordance with the GHG Protocol’s,
Energy use awareness amongst customers, lighting Scope 2 Guidance. We have therefore
Energy use across the whole of our retrofits and replacements. We have reported both a location-based and
managed portfolio has increased by 2% identified a number of additional energy market-based Scope 2 emissions
this year (see table below). Properties leave efficiency measures and will report figure (and Scope 3 where applicable).
the portfolio for redevelopment and those on these next year. The Scope 2 market-based figure
replacing them, whilst designed for energy reflects emissions from electricity
A Smart Optimisation programme
efficiency, are generally larger and more purchasing decisions that we have made.
carried out at Rex House, on Regent
sophisticated, to meet changing occupier When quantifying emissions using the
Street, in 2018/19 has yielded a number
needs and expectations. This has an impact market-based approach we have used
of different benefits, including reduced
on energy use. a supplier specific emissions factor
gas and electricity use over 2019/20
(read more in the case study on next page). where possible. If these factors were
A significant driver to the increase in
unavailable, a residual mix emissions
energy use was the 11% year-on-year
A reduction in energy consumption is factor was then used and, as a final
increase in fuel use (principally gas).
key to the achievement of net zero carbon. alternative, a location-based grid
Contributing factors include: occupation of
Shortly we will be setting out how we intend emissions factor was used.
properties following refurbishment, letting
to become a net zero carbon business
of vacant floorspace, changes to major plant More information can be found in our
which will include ways to improve efficiency
and to customer working routines, alongside Environmental Reporting Criteria at:
and ambitious targets.
data anomalies which are being investigated thecrownestate.co.uk/environmental-
as a priority. reporting-criteria.
NEXT STEPS
On a like-for-like basis we have achieved See pages 10 and 11 for our total
a 9% reduction in energy use. Like-for-like – Improve accuracy and quality emissions using the location-
properties are those which have been of energy data collection and market-based Scope 2
consistently in operation (and not under accounting methodologies.
development) during the most recent two
reporting years. Like-for-like performance
shows the change in performance
unrelated to fluctuations in portfolio size
and refurbishment or redevelopment, as
opposed to absolute energy performance.
Energy use – absolute (MWh) Like-for-like (MWh)
Year-on-year % Year-on-year %
Source 2018/19 2019/20 change 2018/19 2019/20 change
Electricity 69,481 68,073 (2)% 59,076 55,018 (7)%
Fuel 34,588 38,293 11% 24,024 20,880 (13)%
Total 104,069 106,366 2% 83,100 75,898 (9)%
Number of Assets 158 158 0% 127 125 (2)%
Energy Intensity (indexed kWh/m2)
(2012/13 baseline – 100 indexed points) 93 94 1
Data note:
The data in the above table reflects emissions from our direct-managed properties within our Central London and Regional portfolios and the main
commercial buildings at Windsor Great Park. It represents circa 38% of the total floor area of properties within these portfolios.
THE CROW N ESTATE
Sustainability: Performance against our capitals 2019/2009
51 tCO2e p.a.
expected saving as a result
of decreased energy use.
£22,000 p.a.
expected savings as a result
of decreased energy demand.
97%
potential productivity due to
optimal working environment.
CASE STUDY
Creating value in our capitals
Delivering optimal working
environments, smartly
Smart buildings can reduce In 2019 this was tested at Rex House, The speed at which water is pumped around
an office building in St James’s, the building is reduced where possible to
energy use, carbon emissions part of our Central London portfolio. lower energy consumption. The temperature
and costs, as well as deliver Working with Carbon Intelligence and of the external air brought into the
BNP Paribas Real Estate, we developed building is more accurately increased or
a better experience for those The Smart Building Optimisation decreased to maintain a more consistent
who use the space, resulting Programme designed to drive energy temperature inside. And the management
in increased productivity. savings whilst improving wellbeing on-site team now uses real time data to identify
and reducing complaints and site call-outs. office temperature changes and can make
immediate adjustments.
12 IoT (Internet of Things) sensors were
installed to monitor CO2, temperature, Together, these actions have had
humidity, light and motion, elements a significant impact:
which are known to impact running – energy use has decreased – gas by
costs, productivity and wellbeing. 10% and electricity by 8% over one
Each sensor sends a live flow of data year which is expected to save £22,000,
to Carbon Intelligence’s online analytics and 51 tonnes of CO2e, per year (as at
platform, ADAPT. Using machine learning 31 March 2020)
and engineering analysis of the data,
– maintaining optimum CO2 levels has
we were able to identify and visualise
ensured that productivity potential
inefficiencies in the building’s operations,
is close to as high as it can be, at 97%
which in turn informed a programme
of optimisation actions. – the team which runs the building now has
a dynamic, real-time system with which
A revised plant-running schedule now to deliver an optimal working environment
ensures the building is only using energy for our customers.
during the hours it really needs to.
THE CROW N ESTATE
Sustainability: Performance against our capitals 2019/2010
C A PITA L: NAT U R A L R ESOU RCES
continued
Carbon dioxide emissions (direct-managed portfolio)
Carbon emissions: Scope 1, Scope 2 (location-based) and Scope 3 (tCO2e)
Emission Source tCO2e
2015/16 2016/17 2017/18 2018/19 2019/20
Scope 1 Direct emissions from fleet and heating 5,868 5,906 5,663 6,678 7,457
of buildings
Scope 2 Emissions from generated electricity usage 11,221 12,621 14,542 11,738 9,247
Gross Scope 1 and 2 17,089 18,527 20,205 18,416 16,704
Scope 3 Emissions from business travel 265 208 188 178 181
Indirect emissions – 15,840 13,109 8,722 8,048 8,232
evidenced customer-purchased energy
Indirect emissions – 927 1,142 2,163 1,677 1,477
electricity transmission distribution losses
Total Scope 3 17,032 14,459 11,073 9,903 9,890
Gross Scope 1, 2 and 3 34,121 32,986 31,278 28,319 26,594
Emissions Intensity (indexed kg CO2e)
New methodology (indexed at 100 points at the 2012/13 baseline) N/A 87 78 66 62
Old methodology (indexed at 100 points at the 2012/13 baseline) 89 82 N/A N/A N/A
Data notes:
The above data reflects emissions from our directly-managed portfolio (within Central London, Regional and Windsor office and workshops). It represents
circa 38% of the total floor area of buildings within these portfolios.
The 2016/17 emissions intensity figure was restated from 82 to 87 as a result of work undertaken on the methodology to increase accuracy
and reduce complexity.
In accordance with the GHG Protocol’s Location-based methodology: under this We are on track to achieve our target of a
Scope 2 Guidance we have reported methodology, emissions from electricity 40% reduction in carbon emission intensity
both location-based and market-based usage are calculated in accordance (against floor space) from a 2012/13
Scope 2 emissions figures (and Scope 3 with the spread of energy sources in the baseline, by 2022/23. This is indicated
where applicable). National Grid over the year (e.g. fossil fuels in the penultimate line of the table above
and renewables). As the grid has increasingly by the Emissions intensity score of 62
For a more detailed breakdown of the
been decarbonised so our associated indexed points against a baseline of 100,
table above, see Annex 1 on page 37.
emissions have decreased. Therefore, reflecting year‑on-year improvement of
any decrease in our emissions has been due 6.1% . Again the reduction has been due,
to a combination of energy saving measures mainly, to the decarbonisation of the grid.
and, increasingly, grid decarbonisation.
Carbon emissions intensity: progress against target
I M PAC T
100 Greenhouse gas (GHG) emissions
90
80 16,704 tCO2e
Carbon Indicator
70
tonnes of CO2e emitted (Scopes 1 and 2).
60 (2018/19: 18,416 tCO2e).
50
40 Impact of GHG emissions
30
20
10
£1,069,056*
Value of the negative impacts and associated social
0 costs resulting from increased concentrations
of atmospheric GHGs. (2018/19: £1,178,595).
2
2
2
2
2
2
2
2
2
2
2
0
0
0
0
0
0
0
0
0
0
0
1
1
1
1
1
1
1
1
2
2
2
2
3
4
5
6
7
8
9
0
1
2
*The impact figure reflects a methodological
/1
/1
/1
/1
/1
/1
/1
/2
/2
/2
/2
3
4
5
6
7
8
9
0
1
2
3
adjustment relating to an increased cost now
Current Carbon Index Target to 40 indexed point reduction applied to the social cost of carbon. The 2018/19
figure has been restated accordingly to enable
meaningful comparability.
Data note:
The unit of measurement for the Carbon Index is as follows: CO₂e/m² adjusted to serviced floor area
and for occupancy, Indexed to 100, with the aggregation weighted by absolute impact on the total For more information see:
portfolio emissions. thecrownestate.co.uk/total-
contribution/methodology
Independent limited assurance (see inside front cover)
THE CROW N ESTATE
Sustainability: Performance against our capitals 2019/2011
Market-based methodology: under Our target is to procure 100% of our
this methodology, the sources of energy electricity from renewable sources by
purchased (e.g. renewables) are taken 2022/23. We already procure some gas
into account in the calculation of actual from renewable sources but recognise
emissions released into the atmosphere. that the renewable gas market is not yet
Of electricity purchased over the year, as mature as that of renewable electricity.
88% (2018/19: 81%) was from renewable
sources. This significantly reduces our
actual emissions (see charts below).
Emissions using the market-based methodology
88%
compared to the location-based methodology (tCO2e) of our electricity
is purchased from
renewable sources.
Scope 2 Scope 3 (customer-purchased energy only)
14,542
11,738
9,247
1,760
8,232
2,637
1,325
8,722
8,048
223
185
15
17/18 18/19 19/20 17/18 18/19 19/20
Location-based carbon emissions
Market-based carbon emissions
Independent limited assurance (see inside front cover)
THE CROW N ESTATE
Sustainability: Performance against our capitals 2019/2012
C A PITA L: NAT U R A L R ESOU RCES
continued
The bigger picture – understanding
our Scope 3 emissions
Carbon emissions by Scope (tCO₂e)
297,006 tCO2e
7,457 9,247
As with our peers, the direct impacts relating to Scope 3 emissions
of our operations are small compared with for 2019/20 (partial data).
our overall carbon footprint. While we will
continue to reduce our direct Scope 1
and 2 emissions, we also understand the
importance of addressing our Scope 3
emissions (those occurring up and down
56,000 tCO2
our value chain) (see the panel below sequestered per annum by
forestry on The Windsor Estate.
for definitions).
297,006
CARBON EMISSIONS –
SCOPES
13.1million
Scope 1
Scope 2
Scope 3 (partial data)
– Scope 1 – Direct GHG emissions from
sources owned or controlled by the tCO2e
business, e.g. combustion in boilers or Composition of Scope 3 emissions currently avoided per annum through
owned vehicles or process equipment (partial data) (297,006 tCO2e) offshore wind energy generation.
– Scope 2 – Indirect GHG emissions
from the generation of purchased
electricity. Emissions physically
occur at the facility where electricity
is generated
– Scope 3 – Other indirect emissions as
a consequence of the activities of the
business, but occur from sources not
owned or controlled by the business,
e.g. business travel
Goods and services purchased – 53.3%
Aggregates dredging – 36.1%
Scope 3 is a challenge for all organisations, Estimated customer electricity – 6.6%
in both understanding the impacts Evidenced customer electricity – 2.8%
and recognising the ability to make Embodied carbon – 0.6%
improvements. We are beginning to Electricity transmission and distribution losses – 0.5%
investigate our most material Scope 3 Business travel – 0.1%
impacts through engagement with our
supply chain and our customers. We know Our wider portfolio offers us a unique
our construction activity has a significant opportunity to play a bigger role in
impact, especially with regard to embodied addressing climate change. For example,
carbon, and are addressing capture of this through our forestry programmes
data through the DSPs v3. However, we on The Windsor Estate we sequester
are at a very early stage with all of this. carbon (56,000 tCO2 per annum), while
Data capture will form part of our net zero our facilitation of offshore wind generation
carbon roadmap. enables emissions to be avoided
(currently 13,096,350 tCO2e per annum).
The chart at the top of the page gives a
We recognise that these activities are not
partial indication of the extent of our Scope
necessarily formal Scope 3 reductions
3 emissions, using the data we currently
but are an important aspect of our
have. Scope 3 emissions are currently
total contribution.
calculated as 297,006 tCO2e for 2019/20.
They begin to show the very small amount It is clear that achievement of net zero
of emissions we have some control over carbon will require coordination between
and on which we report (see carbon data on our action on TCFD, Science-based targets
previous pages). Scope 3 elements not yet (work on which has provided data on our
taken into account include other activities goods and services purchased) and our
we licence on the seabed and on our customer emissions. We are defining the
Rural holdings. different stages, scopes and boundaries
of our net zero carbon ambition, and
reviewing our business processes, in
order to achieve the required reduction in
carbon emissions over the coming years.
THE CROW N ESTATE
Sustainability: Performance against our capitals 2019/2013
Renewables Offshore renewables
Onshore renewables We play a fundamental and active role in
We generate a minimal amount of supporting the UK’s world-leading offshore
renewable energy on our directly-managed wind industry. We facilitate the industry
portfolio, primarily through the installation by identifying and leasing suitable seabed
of solar panels. Although this has not been sites for development, as well as working
straightforward, due to complications with partners to build evidence, share
with historic lease structures and the data and support innovation to enable
configuration of the roofs (particularly the responsible growth of the sector.
in central London), we are exploring During 2019/20, operational capacity
new opportunities with our Regional
portfolio customers. However, we do
in the UK offshore wind sector increased
from 7.7GW to 9.3GW (an increase of
9.3GW
install solar panels on the roofs of our new 1.6GW ), meeting our own internal target of cumulative
developments amongst chiller units, roof- operational capacity
set in 2015 to achieve 8-10GW by 2020. achieved against a
top planting and bug hotels. The amount Further insights about the UK’s offshore target of 8-10GW
of energy generated in 2019/20 was wind sector can be found in our Offshore by 2020/21
743MWh. This compares to a much lower Wind Operational Report thecrownestate. (2018/19: 7.7GW).
amount of 83MWh in the prior year, largely co.uk/osw-ops-report-2019 which
attributable to the unavailability of data. demonstrates how the sector continues
Of the 743MWh, 589MWh was from to lead the world in installed capacity,
solar power and 153MWh from a fuel data‑gathering, skills and health and safety.
cell (since decommissioned).
In September 2019 we launched Offshore
NEXT STEPS Wind Leasing Round 4, our first major
new leasing round in a decade, creating
– Explore opportunities for on- the opportunity for at least 7GW of new
site renewables across the real projects around England and Wales. It is
estate portfolio clear offshore wind will continue to play
an important role in the transition to net
zero, and contribute significantly to SDG 7
(Affordable and clean energy).
Cumulative GW value of offshore wind turbines installed per year
I M PAC T
10 Greenhouse gas (GHG)
9 emissions avoided (enabled)
8
32.7 TWh
GW (Cumulative)
7
6
enabled terrawatt hours of offshore renewable
5 energy generated over 2019/20.
4 (2018/19: 25.3 TWh).
3
Impact of GHG emissions avoided
2
1
0 £838.2m*
Value of the positive impacts and associated
2
2
2
2
2
2
2
2
2
2
2
0
0
0
0
0
0
0
0
0
0
0
social benefits resulting from reduced concentrations
0
1
1
1
1
1
1
1
1
1
1
9
0
1
2
3
4
5
6
7
8
9
/1
/1
/1
/1
of atmospheric greenhouse gases.
/1
/1
/1
/1
/1
/1
/2
0
1
2
3
4
5
6
7
8
9
0
(2018/19: £648.5m*).
Data note: *Updated methodology applied – to reflect increasing
Data from 2014/15 shows GW capacity from turbines installed and operating (i.e. grid connected). renewable energy in the National Grid. 2018/19
Previous years’ data included those installed but not yet operating. figure has been restated accordingly to enable
meaningful comparability.
For more information see:
thecrownestate.co.uk/total-
contribution/methodology
Independent limited assurance (see inside front cover)
THE CROW N ESTATE
Sustainability: Performance against our capitals 2019/2014
C A PITA L: NAT U R A L R ESOU RCES
continued
Super-efficiency Waste We encourage our customers to use our
Our waste reporting is split between waste contractors so that we can monitor
Efficient use of all natural resources is
operational and construction waste. waste generation and end disposal routes.
critical to their continued availability. In line
Having achieved 100% diversion of waste However, some are already using their
with SDG 12 (Responsible consumption
from landfill for waste from our occupied own contractors for recycling and ours
and production), we are endeavouring to
properties for at least three years, we have for non‑recyclable waste, which makes it
apply circular economy principles and
been focusing on the recycling of waste. difficult to improve the recycling percentage
greater consideration of natural resource
However, the generation of waste has (in the table below both Recycled and
use across our business, and encouraging
not abated and we are working with our Anaerobic digestion are considered
the same of our customers and within our
customers to address this and intend to recycled waste).
supply chain.
set a waste intensity (tonnes per sq m) target
Over the past year we have worked with
Building materials as part of our review of non-financial targets.
some of our customers in the fashion
In support of our Development sector. At an event with a focus on waste
Operational waste
Sustainability Principles (DSPs) v3 we have and circularity a number of our customers
developed a materials matrix which provides Operational waste is defined as waste
shared detail on their initiatives and goals.
a framework for our supply chain to deliver generated as a result of our direct activities
Together we looked at the potential for
responsible sourcing of materials for our or those of our customers where the
scalability with other customers in the same
developments. The matrix categorises a disposal of waste is under our management
geographical area and explored carbon
wide range of materials and finishes against (covering the Central London and Regional
footprint reduction challenges.
standards, social responsibility, traceability, portfolios, and the Windsor Estate). Of our
different emissions and resource operational waste, 100% was diverted Working with the Sustainable Restaurants
efficiency in accordance with circular from landfill and of this 55% was recycled Association (SRA), we launched the
economy principles. against a target of 80% by 2022/23. Food Waste Pledge in May 2019, bringing
We currently operate a waste consolidation together 12 restaurants to trial exciting
In our building fit-out guides we specify scheme with three consolidation centres. and innovative solutions to reduce their
and encourage careful consideration The scheme serves 300 customers food waste by 25% in a year. Read more
of use of all resources. across our Central London portfolio, and about the Food Waste pledge in our case
alongside removing waste, provides waste study on page 16.
and recycling data back to our customers
to aid their own waste reduction ambitions.
Operational waste generated (tonnes) and disposal route
2015/16 2016/17 2017/18 2018/19 2019/20
Waste generated from buildings where we collect the waste (tonnes) 6,792 7,523 6,281 8,297 8,465
Percentage of non-hazardous waste diverted from landfill 99% 100% 100% 100% 100%
Waste Disposal Route
Landfill (Non-hazardous or inert) 0% 0% 0%
Incineration off-site (with energy recovery) 47% 46% 45%
Recycled (following on-site segregation) 50% 48% 43%
Anaerobic digestion 3% 6% 12%
Re-use off-site 0% 0% 0%
Waste Cost
Avoided landfill costs (£)1 561,016 654,184 540,794 738,018 773,278
Data note:
1 Avoided waste costs for 2019/20 are based on landfill tax of £91.35 per tonne.
Operational waste – end disposal breakdown 2019/20
Anaerobic digestion 12%
Recycled (following on-site segregation) 43%
Incineration off-site (with energy recovery) 45%
THE CROW N ESTATE
Sustainability: Performance against our capitals 2019/2015
Construction waste
Construction waste is defined as waste generated by our construction partners working on our behalf. The data in the table below does not
include demolition waste. However, all development projects working to our newest version of the Development Sustainability Principles
(DSPs) v3 published May 2019, are required to collect demolition waste data and it will be reported in future years, as new construction
projects commence.
Construction waste generated (tonnes) and diverted
2015/16 2016/17 2017/18 2018/19 2019/20
Construction waste generated 4,247 2,350 2,007 2,830 3,628
Number of projects 8 10 14 10 4
Diversion from Landfill
% diverted from landfill 96% 95% 98% 89% 94%
Waste Cost
Avoided landfill costs (£) 338,528 187,791 170,125 224,046 310,375
Despite the lower numbers of projects in Applying circular economy principles
2019/20, there was an increase in waste, in the offshore wind industry NEXT STEPS
reflecting the different development stage Looking more broadly across our business
of projects in both years. – Set an operational waste intensity
to activity on the seabed, and outside target (tonnes per sq m)
In the DSPs we have set high expectations of our direct operational control, we have
of future construction projects (major and engaged with the offshore wind sector – Explore opportunities with the
moderate) and seek to ensure that circular on circular economy principles. In October offshore wind industry to progress
economy measures are embedded into 2019 we hosted our first offshore wind action on decommissioning
the design and specification stages of decommissioning day for customers, as well
developments. We recognise that a lot as regulators and government stakeholders,
of work is required with regard to systems in collaboration with Offshore Renewable
and processes, in both the construction Energy (ORE) Catapult.
and waste industries, before the following
The aim of the day was to start
requirements become standard practice.
the conversation on offshore wind
– 98% of non-hazardous CDE decommissioning and the importance of
(construction, demolition and excavation) circular economy in the sector. We looked
(including fit-out) waste diverted at the value and recovery of materials
from landfill. offshore, the value of the opportunity and
– 95% of non-hazardous CDE (including the resource savings of recycling materials
fit-out) waste reused or recycled. against materials from virgin sources. As a
– Depending on use class – between result it was agreed that the industry should
3.2 and 4.9 tonnes/100m2 gross collaborate to bring decommissioning
internal area (GIA) of non-hazardous costs down and focus on how to recycle
construction waste generated. turbine blades.
THE CROW N ESTATE
Sustainability: Performance against our capitals 2019/2016
CASE STUDY
Creating value in our capitals
Waste not,
want not
In May 2019, we launched Partnering with the Sustainable Data collected throughout the programme
Restaurant Association, we have delivered has identified that most food waste is
the Food Waste Pledge, a programme of workshops and training created during preparation (45%) followed
bringing together 12 to support the restaurants in making by plate waste (34%) and spoilage (21%).
the pledge a reality, which has already Insights such as this could help inform
like-minded restaurateurs led to a range of innovations including: other restaurateurs who share a desire to
from across our West End – Chefs reinventing menus and creating reduce food waste. Although the COVID-19
property portfolio, as well entirely new dishes, which incorporate pandemic caused restaurants to close in
previously discarded ingredients such as mid‑March, bringing the Food Waste Pledge
as our own in‑house café, off-cuts, peelings and parts of vegetables to a premature end, we have collected
who together pledged to that would previously have gone to waste, 10 months of data and will share the results
later this year in a bid to contribute to the
reduce food waste by 25% without compromising on quality
industry’s understanding of how food waste
in a year. The project was – Reducing bread waste by 50%, simply
by removing table baskets and offering
can be reduced.
inspired by the SDG 12 customers as much bread as they like We would like to thank the customers
(Responsible consumption – The provision of boxes for diners who took part in the Food Waste Pledge:
Café Murano, Brasserie Zedel, Hawksmoor
and production), which has to take away leftovers
Air Street, ikoyi, Laurent, Hotel Café Royal,
– Challenging suppliers to rethink
a target to reduce food their offering and packaging
Neat Burger, Ristorante Frescobaldi, tibits,
waste by 50% per capita – Designing more informative menus
Sabor, Scully, Sketch, Ziggy Green and
Vacherin, The Crown Estate’s in-house
by 2030. to raise awareness amongst diners café supplier.
of the food waste issue.
Through this project we hope to inspire
more of our customers and other partners
to help reduce food waste.
THE CROW N ESTATE
Sustainability: Performance against our capitals 2019/2017
Water We are working to improve data accuracy Absolute water
consumption (m3)
Whilst our water consumption is not at Windsor, and where water consumption
considered material compared to some of fluctuates depending on the amount
our other impacts, we recognise that many of rainfall in the watering season. 521,125
of our properties are in water‑stressed
We also report consumption from
401,972
410,261
359,445
517,207
521,125
areas. Our customer fit-out guides
development projects. Indirect water
encourage occupiers to minimise water
consumption reduced dramatically
consumption and to use water-efficient
during 2019/20. Not only were there
fittings. Our DSPs set requirements for
fewer projects but the projects were
design-in-use and construction projects.
at stages of development which did not
The following data relates to water demand the consumption of much water.
consumption from our directly-managed
portfolio where we have the readings.
Our direct water consumption totalled
521,125m³ over the year, representing an
increase of 3,918m3 on that of 2018/19
(see the footnote to the table below).
15/16
16/17
17/18
18/19
19/20
Water – absolute consumption (m3)
2015/16 2016/17 2017/18 2018/19 2019/20
Water consumption (direct) NEXT STEPS
Windsor 173,171 138,753 137,481 140,8431 161,477
– Benchmark water consumption
Central London and across the real estate portfolio
Regional portfolios 228,801 271,508 221,964 376,364 359,648 and set reduction targets
Total water consumption 401,972 410,261 359,445 517,2071 521,125
– Improve the accuracy of water
Number of Central London data at Windsor
and Regional properties
included in analysis 75 72 66 73 75
Water consumption (indirect)
Construction projects N/A N/A N/A 49,270 1,971
Number of projects included
in analysis N/A N/A N/A 9 42
Data notes:
1 2018/19 water consumption at Windsor was restated to 140,843m3 from 78,660m3 as a result
of a broken meter discovered after we had reported last year. The total water consumption for
the year has been restated from 455,024m3 to 517,207m3 accordingly.
2 Development projects – Fosse Park Food Central, Fosse Park West, Morley House and Remo House.
Water source
2015/16 2016/17 2017/18 2018/19 2019/20
Water consumption (m3)
(direct use)
Water from municipal
water supplies 401,972 410,261 359,445 517,207 521,125
Water from rainwater harvesting 2,004 3,551 8,668 6,922 11,7451
Total water withdrawal 403,976 413,812 368,113 524,129 532,870
Water abstraction
from Windsor (m3)
(indirect use)
Indirect 35,314 20,790 29,441 60,508 36,013
Data note:
1 Rain water harvesting data relates to 1 and 2 St James’s Market, One Eagle Place and One Vine Street.
THE CROW N ESTATE
Sustainability: Performance against our capitals 2019/2018
C A PITA L: NAT U R A L R ESOU RCES
continued
Healthy places and habitats We are targeting Well Ready certification Natural capital accounting
on all of our major office developments In 2019 a study was undertaken to
Across our portfolio we aim to add
which will involve closer customer liaison estimate the value of ecosystem services
greenspace and enable increased
and result in better indoor air quality and at the Windsor Estate. The conservative
biodiversity, especially in the built
more indoor biophylia e.g. green walls. value of these services to our customers
environment. Our work, with that of others,
Working with our partners and supply chain, and adjacent communities was calculated
contributes to SDGs 11 (Sustainable Cities
we will continue to challenge ourselves at £21 million per annum. This study can
and Communities), SDG 15 (Life on Land)
to achieve these high standards in future be found at thecrownestate.co.uk/valuing-
and SDG 14 (Life below water).
developments and ongoing operations. windsor-estate.
Throughout the pandemic Windsor Great
In recognition of our commitment to
Park has been of great value to the local Sites of Special Scientific Interest (SSSIs)
sustainability, Regent Street achieved
community. COVID-19 has helped all of us On the Windsor Estate we have over
first place in its peer group and
to value the natural environment for our own 2,400 hectares of designated SSSIs.
Global Sector Leader status in the
health and mental wellbeing, appreciating These were assessed by Natural
annual Global Real Estate Sustainability
the interdependencies even more clearly. England last year as 100% in ‘favourable
Benchmark (GRESB). It also achieved
Lockdown has also been beneficial for flora condition’, outperforming our target of
eighth place in the ‘New Construction’
and fauna due to cleaner air and less noise 50% in ‘favourable condition’ and 95%
section against 379 global peers. We were
and disruption. Conversely, there are likely in ‘favourable or recovering condition’.
particularly pleased that our Regent Street,
to have been issues with invasive species The challenge is to maintain this status
St James’s and Regional portfolios all
and lack of necessary maintenance which until the next assessment (at least three
scored full marks in the new Health and
will need to be addressed in due course. years away).
Wellbeing questions added this year.
COVID-19 is driving the reconsideration of
the future of our urban places in particular. Healthy habitats Habitat retention on the seabed
The real opportunity is to deliver a long-term Wild West End As manager of the seabed around England,
change to the environment, and air quality Wales and Northern Ireland we need to
As a founder partner we continue to play
with regard to the volume and movement optimise the increasingly scarce space
an integral role in central London’s Wild
of traffic in the urban environment. This will on the seabed given the many varying
West End, a partnership of neighbouring
have to be a collective effort and will require demands. Consideration of biodiversity
landowners and other stakeholders working
systems thinking. is integral to our decision-making and we
to create new, valuable green spaces and
work closely with many stakeholders to
Healthy places increase biodiversity in urban corridors
understand the implications for biodiversity
between London’s parks. For more
Air quality of activities which we enable.
information – wildwestend.london/vision.
We are focused on improving air quality Good green space also improves air We also ensure the sectors we work with
wherever we can, by reducing and quality, sequesters carbon dioxide, retains are aware of the potential interactions their
consolidating deliveries, restricting rainwater, provides urban cooling and projects have on designated areas to inform
commercial traffic to designated time enhances a sense of health and wellbeing. their decision-making. This has been a
windows and cutting back on personal consideration in our approach to Offshore
Since 2017/18 we have developed a
deliveries. In central London we are doing Wind Leasing Round 4 (read more on page
total of 3,362 sq m of new green space
this in part by reducing vehicle movements 9 of the Annual Report at: thecrownestate.
in central London, keeping us on track to
through waste and delivery consolidation co.uk/2020-annual-report-document).
achieve our target of 5,000 sq m by 2022.
schemes, and on development sites
The abundance of flora and fauna (including During the year we granted a licence to
through sustainable procurement plans.
bats, birds and insects) are monitored every seed a two hectare (20,000 sq m) area
Our retail freight consolidation scheme
two years using established methodologies of the seabed with seagrass in a pilot
covers 46 locations across Regent Street.
and any issues are identified with scheme in Dale near Milford Haven in
Since 2013 it has contributed to a
recommendations for action. Pembrokeshire. Over the next three to
reduction in deliveries to participating
customers in these locations of over 90%. five years, the benefits to the environment
Wild West End also provides a healthy
should include carbon sequestration and
place for the customers in Regent Street
Across our Regional portfolio a sustainable marine habitat formation.
and the surrounding streets in the form of
travel programme is underway to support
rooftop allotments (read more in our case For information on how we are working to
our customers to reduce single car
study on the next page). protect the natural environment in Wales
occupancy journeys to our destinations
through lift-sharing apps, providing cycling and on the surrounding seabed, see the
We are exploring the potential to use
facilities and education about alternative Biodiversity and Resilience of Ecosystems
Wild West End as a framework for central
methods of transport. A bespoke app hosts Report (Wales) 2019 report online at:
London public realm activity and on our
sustainable travel information for each of thecrownestate.co.uk/biodiversity-report-
Regional portfolio. All current landscaping
our locations, including live feeds to public wales and, for the version in Welsh at:
proposals have a net positive effect on
transport timetables and updates. thecrownestate.co.uk/biodiversity-report-
the biodiversity baseline value of our sites
cymru.
and we will target improvement. We are
Wellbeing also looking to achieve biodiversity net
NEXT STEPS
The Marq, a property in St James’s, London, gain through developments at Fosse Park,
has become the first new-build project in Rushden Lakes and East Hemel.
– Identify opportunities for the
the UK to achieve both a BREEAM New
development of green infrastructure
Construction ‘Outstanding’ rating and WELL
across the portfolio
Gold Certification for the base build of the
scheme, relating to the office space.
THE CROW N ESTATE
Sustainability: Performance against our capitals 2019/2019
CASE STUDY
Creating value in our capitals
Allotments
in the sky
Seven storeys up on a In the spring of 2016, along with our Gardeners have reported that the allotment
managing agent JLL, we established the is a great boost for their health and
rooftop in Regent Street Regent Street rooftop Allotment Garden. wellbeing. They gain a sense of satisfaction
a team of gardeners It is an example of the positive link between from growing their own food and learning
green space, biodiversity, fresh food new skills; and they see the allotment as
are creating a haven for and wellbeing. a place where they can recharge their
wellbeing and biodiversity. The 16 table top allotments and
batteries, enjoy the peace and calm
and take time out of busy working days
one large communal herb table give
for relaxation and contemplation.
48 of our team and customers the
opportunity to grow their own food People are not the only ones who benefit.
throughout the year. The gardeners, The space provides a healthy habitat for
most of whom start as complete novices, biodiversity, with bees from our apiary –
are guided by professional gardeners located close by on another roof – regularly
who help them gain confidence in growing visiting and pollinating crops. Ladybirds,
a wide variety of herbs such as sage, thyme butterflies and small birds such as pied
and tarragon, as well as fruit and vegetables wagtails also enjoy visiting the allotment.
such as lettuce, tomatoes, peppers This helps contribute to the aims of
and strawberries. Wild West End, a partnership to encourage
wildlife into this busy area of London,
They can also learn new skills through
and create greater connections with
workshops such as the 2019 Winter
nature for people to enjoy.
Allotment workshop, run by Head Gardener,
Jo Ryan, and Edwin Ballogen from the In providing spaces such as these, we are
Sustainable Cookery School. using our physical resources to deliver
wellbeing value to our people and our
customers, and a thriving habitat for wildlife.
THE CROW N ESTATE
Sustainability: Performance against our capitals 2019/20You can also read