Technical Bulletin Compatibility Assessment - TB 027 Version 1.0 November 2018 - Euro NCAP
←
→
Page content transcription
If your browser does not render page correctly, please read the page content below
Technical Bulletin

Compatibility Assessment

 Version 1.0

 November 2018
 TB 027

Title Compatibility Assessment
Version 1.0
Document Number TB 027
Author James Ellway
Date November 2018
Related Documents MPDB Assessment Protocol
Status Information
Application Date 1st January 2020
Copyright ©Euro NCAP 2018 - This work is the intellectual property of Euro NCAP. Permission is granted for this
material to be shared for non-commercial, educational purposes, provided that this copyright statement appears on the
reproduced materials and notice is given that the copying is by permission of Euro NCAP. To disseminate otherwise or
to republish requires written permission from Euro NCAP.

Version 1.0
November 2018
Preface

In 2020 the European New Car Assessment Programme (Euro NCAP) will be updating its
offset frontal impact test procedure. These updates will be centred on the adoption of the
Thor anthropometric test device and a new barrier face for the mobile progressive
deformable barrier (MPDB). This Technical Bulletin details the calculation of the
Compatibility Assessment.

DISCLAIMER: Euro NCAP has taken all reasonable care to ensure that the information
published in this document is accurate and reflects the technical decisions taken by the
organisation. In the unlikely event that this protocol contains a typographical error or any
other inaccuracy, Euro NCAP reserves the right to make corrections and determine the
assessment and subsequent result of the affected requirement(s).

Version 1.0
November 2018
EUROPEAN NEW CAR ASSESSMENT PROGRAMME (Euro NCAP)

 Table of Contents

1. Introduction .............................................................................................................................. 1
2. Barrier Deformation Standard Deviation ................................................................................. 2
3. Occupant Load Criterion .......................................................................................................... 3
4. Bottoming Out .......................................................................................................................... 4
5. Calculation ............................................................................................................................... 5

Version 1.0
November 2018
1. Introduction
The Euro NCAP compatibility assessment is based upon three parameters that are
determined using the results of the Mobile Progressive Deformable Barrier (MPDB) to car
impact. The three parameters are the standard deviation (SD) of the post-test barrier face
measurements, the Occupant Load Criterion (OLC) and whether the vehicle has bottomed
out the MPDB face. Details on how each of these parameters is determined is illustrated in
the following sections of this document.

From 1st January 2022, the compatibility assessment will be a 0 to 8-point penalty applied
to the overall test score, as described in section 5 in this document. During the introduction
years 2020 and 2021, the compatibility penalty applied will be halved (maximum 4 points).

The penalty for standard deviation and OLC is based on two interlinked sliding scales that
can cover the full range of the penalty (0 to 8 points) where the lower performance limits
have been exceeded.

Where the OLC is 25g and below, the penalty ranges from 0 to 2 points and is based on SD
only. Where the OLC is 40g and above, the penalty ranges from 2 to 8 points and is based
upon both SD and OLC. Where OLC is between 25g and 40g, the penalty is based upon the
two sliding scales for SD and OLC.

Bottoming out is an additional 2 point penalty that is added to the modifier calculated from
the combination of SD and OLC. The maximum compatibility assessment will not exceed
8 points.

Version 1.0 1
November 2018
2. Barrier Deformation Standard Deviation

2.1 The homogeneity of the vehicle is based on the standard deviation of the intrusion
 depth within the prescribed measurement area of the MPDB face.
2.2 The standard deviation is defined as the spread around the mean intrusion that
 covers 68.2% of all measured intrusion points. The bigger the standard deviation,
 the bigger the spread of the measured intrusion points.
2.3 The assessment of SD is based on a linear scale from 50mm to 150mm where 50mm
 is the higher performance limit and 150mm is the lower performance limit.

2.4 Evaluation area
2.4.1 The height of the evaluation area is independent of vehicle size. The lower border
 is at 250mm above ground level (100mm from the lower edge of the barrier face).
 The upper border is at 650mm above the ground of the MPDB face.
2.4.2 For a left-hand drive vehicle, the right border of the area is located at 200mm from
 the right-hand edge of the MPDB face. The left border is dependent on the width of
 the test vehicle, it is located at 45% of the overall width from the right-hand edge
 of the MPDB face. See Figure 1.
2.4.3 The evaluation area for right hand drive vehicles will be mirrored accordingly
 around the vertical axis.

 Figure 1: Evaluation area

Version 1.0 2
November 2018
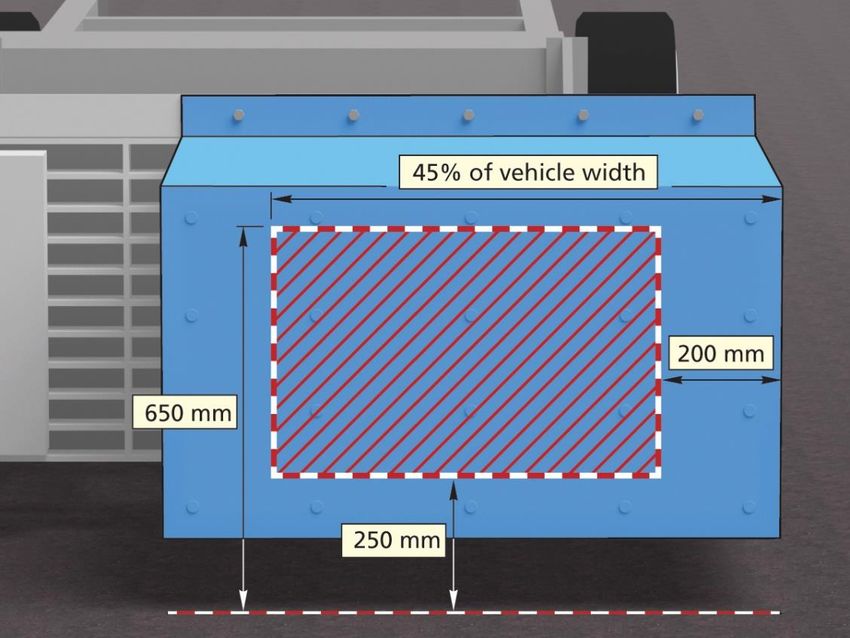
2.5 Barrier scan data.
2.5.1 Scanning of the barrier face shall be conducted in accordance with the procedure
 detailed in the Euro NCAP MPDB testing protocol.
2.5.2 The scanning data shall be inserted into the Euro NCAP Compatibility assessment
 spreadsheet in accordance with the following.
2.5.3 All required data shall be filled in the green cells within the sheet “input scan”.
2.5.4 The intrusion depths of the 1400 measuring points that came out of the scanning
 process are entered in column F (x-coordinates).
2.5.5 The data shall be entered row by row and top down.
2.5.6 The first measuring point (located top left on the front view of the barrier) shall be
 entered in line 7.
2.5.7 The last measuring point (located down right on the front view of the barrier) shall
 be entered in line 1406.
2.5.8 Within cell F2 the minimum measured intrusion depth is displayed.
2.5.9 Within cell F3 the maximum measured intrusion depth is displayed.
2.5.10 Within the sheet “pattern” the position of the single measuring points are displayed
2.5.11 Within the cell J2 the make and model of the tested vehicle and within the cell K2
 the test number should be entered (both types of information are only required to
 relate the evaluation with a certain test they are not relevant for the SD calculation)
2.5.12 Within the cell L2 the location of the steering wheel (left, or right) must be entered.
 This information will be used by the spreadsheet to determine the location of the
 evaluation area on the surface of the barrier face.
2.5.13 Within the cell M2 the overall width of the test vehicle must be entered. This
 information is required to determine the size of the evaluation area on the surface
 of the barrier face.
2.5.14 Within the cell N2 the occurrence of bottoming out (yes or no) must be entered.

3. Occupant Load Criterion

3.1 The OLC is evaluated using a sliding scale between 25g and 40g.
3.2 Measured X-acceleration (AX) on the centre of gravity of MPDB shall be filtered
 using CFC180.
3.3 The acceleration from the backup CoG accelerometer shall only be used for the
 OLC calculation where there is a channel failure of the primary accelerometer.
3.4 The acceleration data shall be entered in to the Euro NCAP compatibility
 assessment spreadsheet.
3.5 The calculation for OLC is as follows:
3.5.1 The filtered acceleration pulse shall be integrated with the following equation to
 derive the velocity course of the barrier:
 = ∫ ( ) + 0
 Where 0 is the initial velocity of the barrier at = 0 .
3.5.2 − , 1 and 2 can be calculated with solving the following equation system:

Version 1.0 3
November 2018
 = 1 = 1
 ∫ 0 − ∫ ( ) = 0.065
 =0 =0
 = 2 = 2
 ∫ ( 0 − − × ( − 1 )) − ∫ ( ) = 0.235
 = 1 = 1
 { 0 − − × ( 2 − 1 ) = ( 2 )
 Where:
 - 1 is end of the free-flight-phase of a virtual dummy on the barrier along a
 displacement of 0.065m, and
 - 2 is end of the restraining-phase of a virtual dummy on the barrier along a
 displacement of 0.235m after the free-flight-phase (i.e. in total 0.300m
 displacement for the virtual dummy).
3.5.3 For compatibility assessment OLC shall be converted from SI units into g (standard
 gravity) with the conversion factor of 1g = 9.81m/s²

4. Bottoming Out

4.1 Bottoming out is defined as an area of the barrier that has been penetrated by
 630mm or more that is 40mm x 40mm in height and width.
4.2 Bottoming out will be determined from a physical examination of the barrier face
 and vehicle. This will be evaluated by the Inspectors during the vehicle inspection
 and be based upon the barrier scanning results.
4.3 Where bottoming out occurs, a 2-point penalty will be added to the barrier
 deformation and OLC penalty.

Version 1.0 4
November 2018
5. Calculation 5.1 The assessment of standard deviation and OLC are both calculated on sliding scales between their respective limits detailed in Sections 2.2 and 3.1, the bottoming out penalty is then added to produce the final compatibility assessment. 5.2 For SD40g with bottoming out the penalty will be -8. 5.6 Where the SD and OLC are between the respective limits, the calculation is based upon the following percentages: Performance limits 0% 20% 40% 60% 80% 100% Standard deviation 50mm 70mm 90mm 110mm 130mm 150mm OLC MPDB 25g 28g 31g 34g 37g 40g 5.7 Figure 2 below is showing the sliding scales and resulting scoring rationale. Figure 2: General scoring rationale 5.8 According to the above calculation, the maximum value of the modifier is 8 points, which will be deducted from the total MPDB test score. During the introduction years, 2020 and 2021, the modifier will be halved, with a maximum of 4 points. Version 1.0 5 November 2018
6. Examples

6.1 Example 1 below is a calculation based on the following results for 2022 onwards:

 Standard deviation (homogeneity) = 119mm = 69% -3.2
 OLC = 34.9g -1.3
 Bottoming out = NO -0
 Modifier -4.553

 Figure 3: Example 1

Version 1.0 6
November 2018
6.2 Example 2 is a calculation based on the following results for 2022 onwards:

 Standard deviation (homogeneity) = 140mm = 90% -4.8
 OLC = 37.7g -1.7
 Bottoming out = YES -2
 Modifier -8.0

 Figure 4: Example 2

Version 1.0 7
November 2018
6.3 Example 3 is a calculation based on the following results for 2022 onwards:

 Standard deviation (homogeneity) = 100mm = 50% -1.3
 OLC = 27.2g -0.3
 Bottoming out = YES -2
 Modifier -3.587

 Figure 5: Example 3

Version 1.0 8
November 2018
6.4 Example 4 is a calculation based on the following results for 2020 & 2021:

 Standard deviation (homogeneity) = 140mm = 90% -4.8
 OLC = 37.7g -1.7
 Bottoming out = YES -2
 Modifier -8.0*0.5 = -4.0

Version 1.0 9
November 2018
You can also read