TESTS EXPLORING THE EFFECTIVENESS OF ELECTRON BEAM TREATMENT FOR BALLAST WATER MANAGEMENT - Minds@UW
←
→
Page content transcription
If your browser does not render page correctly, please read the page content below

Abbreviated Title: Fermi
                                                                               Date Issued: 25 March 2022

                          BENCH-SCALE TECHNICAL REPORT

     TESTS EXPLORING THE EFFECTIVENESS OF
        ELECTRON BEAM TREATMENT FOR
         BALLAST WATER MANAGEMENT
        CHRISTINE POLKINGHORNE * , HEIDI SAILLARD, KIMBERLY ELLER, MICHAEL NAGEL, DESI
              NIEWINSKI, SAMANTHA MCCLUNG, JEN MAKI, AND MATTHEW TENEYCK

Lake Superior Research Institute, University of Wisconsin-Superior, Belknap and Catlin Ave., P.O.
Box 2000, Superior, WI, USA

Reviewed and Approved by:

                                                            Digitally signed by Christine
                                        Christine N.        N. Polkinghorne
        CHRISTINE POLKINGHORNE                              Date: 2022.03.25 12:48:34       3/25/22
                                        Polkinghorne        -05'00'

     GWRC Bench Scale Testing Manager                   Signature                                Date

Cleared for Issue by:

                                                             Digitally signed by Matthew
                                        Matthew              TenEyck
           MATTHEW TENEYCK                                   Date: 2022.03.25 12:56:22      3/25/22
                                        TenEyck              -05'00'

               Director, LSRI                           Signature                                Date
*
    Corresponding Author, Email: CPolking@uwsuper.edu

                                             Page 1 of 38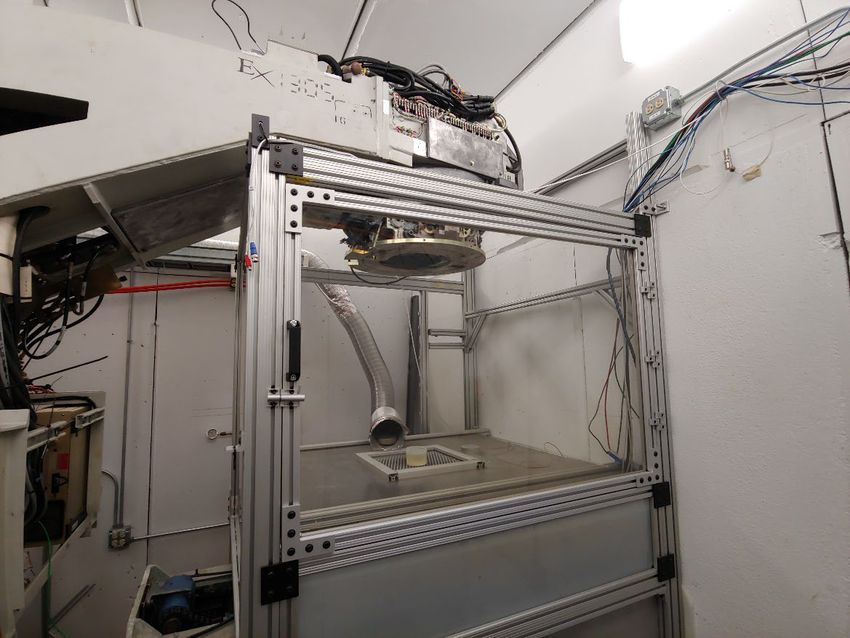
Abbreviated Title: Fermi
                                                             Date Issued: 25 March 2022

RECORD OF REVISIONS

 Revision No. (Effective Date)              Revision Description

                                 Page 2 of 38
Abbreviated Title: Fermi
                                                                             Date Issued: 25 March 2022

ABSTRACT
This technical report presents findings from bench-scale tests evaluating the ability of electron beam
treatment to inactivate aquatic organisms. This evaluation was the first attempt to assess the electron
beam treatment as a potential treatment method for ballast water in the Laurentian Great Lakes.

Researchers from the Lake Superior Research Institute (LSRI) of the University of Wisconsin-Superior
(UWS) in Superior, Wisconsin, USA traveled to the Fermi National Accelerator Laboratory, hereafter
Fermilab, to conduct the bench-scale evaluation in January 2022. The test apparatus is a stationary
copper particle accelerator that supplies a radiation dose expected to cause mortality in standard test
organisms. It has been previously demonstrated that electron beam treatment can cause direct damage
by creating either single- or double-strand breaks in the DNA molecule beyond cell repair (Shehata,
M.M.K. et al., 2011) or recovery (Lei, J. et al., 2020).

All experimental exposures were conducted at Fermilab. The irradiation process was conducted by
Fermilab staff in the Illinois Accelerator Research Center’s (IARC’s) Accelerator Applications
Development and Demonstration (A2D2) machine. Doses ranged from 1 to 50 kGy.

Dose effectiveness testing was completed in two water types using bacteria, algae, and zooplankton—
Escherichia coli, Selenastrum capricornutum, Eucyclops spp., and Daphnia magna, respectively. The
treatment caused complete mortality for E. coli in both water types at even the lowest dose employed.
Eucyclops spp. and Daphnia magna also experienced complete mortality in both water types between 5
and 10 kGy. Selenastrum capricornutum was the most resistant to treatment effect in both water types,
but did experience mortality at the highest doses. Algae examined a week after exposure for delayed
mortality experienced high mortality rates at all doses.

Key Words: Bench-scale, Ballast Water, Electron Particle Accelerator, Electron Beam, Fermilab

                                              Page 3 of 38
Abbreviated Title: Fermi
                                                                                                                         Date Issued: 25 March 2022

TABLE OF CONTENTS
Record of Revisions ....................................................................................................................................... 2
Abstract ......................................................................................................................................................... 3
List of Figures ................................................................................................................................................ 5
List of Tables ................................................................................................................................................. 5
1      Introduction .......................................................................................................................................... 7
2      Test Methods ........................................................................................................................................ 7
    2.1        Test Plan and SOPs ........................................................................................................................ 7
    2.2        Ballast Water Management System and Experimental Apparatus .............................................. 7
    2.3        Traveling to Conduct BWMS Evaluation ....................................................................................... 9
    2.4        Experimental Water Preparation .................................................................................................. 9
    2.5        Water Quality Methods .............................................................................................................. 11
       2.5.1           Total Suspended Solids, Particulate Organic Matter, and Mineral Matter ........................ 11
       2.5.2           Percent Transmittance at 254 nm ...................................................................................... 12
       2.5.3           Organic Carbon Analysis ..................................................................................................... 12
       2.5.4           Hardness ............................................................................................................................. 12
       2.5.5           Alkalinity.............................................................................................................................. 12
       2.5.6           Dissolved Oxygen ................................................................................................................ 13
       2.5.7           pH ........................................................................................................................................ 13
       2.5.8           Specific Conductivity ........................................................................................................... 13
       2.5.9           Temperature ....................................................................................................................... 13
    2.6        Dose Effectiveness Testing Methods .......................................................................................... 13
       2.6.1           Bacteria ............................................................................................................................... 14
       2.6.2           Algae.................................................................................................................................... 14
       2.6.3           Zooplankton ........................................................................................................................ 15
    2.7        Deviations ................................................................................................................................... 15
3      Results ................................................................................................................................................. 17
    3.1        Water Quality Prior to Exposure ................................................................................................. 17
    3.2        Bacteria ....................................................................................................................................... 18
    3.3        Algae ........................................................................................................................................... 20
       3.3.1           Delayed Mortality of Algae ................................................................................................. 22

                                                                        Page 4 of 38
Abbreviated Title: Fermi
Date Issued: 25 March 2022
3.4 Zooplankton ................................................................................................................................ 24
3.5 Treatment Effect on Water Quality ............................................................................................ 25
4 Quality Assurance/Quality Control – Data Quality Objectives ........................................................... 26
4.1 Water Quality Data Quality Objectives ....................................................................................... 26
4.2 Bacteria ....................................................................................................................................... 29
4.3 Algae Testing ............................................................................................................................... 30
4.4 Zooplankton Testing ................................................................................................................... 31
5 Conclusions and Discussion ................................................................................................................ 31
6 Acknowledgements............................................................................................................................. 34
7 References .......................................................................................................................................... 35
8 Appendix A. Mean minimum dose in kiloGray (±SD) delivered to samples during dose effectiveness
testing with the Electron Beam. ................................................................................................................. 36
9 Appendix B. List of SOPs used during dose effectiveness testing at Fermilab. .................................. 37
LIST OF FIGURES
Figure 1. IARC building pit and electron cave where A2D2 is located. ......................................................... 8
Figure 2. The electron cave of A2D2 with a sample in the exposure location. Note that GWRC samples
were covered during exposure. .................................................................................................................... 9
Figure 3. S. capricornutum mortality during dose effectiveness testing with the electron beam. ............ 22
Figure 4. Photograph of LW-TMH algae sample flasks after five-day incubation period. .......................... 23
Figure 5. Zooplankton mortality after electron beam exposure in LW. ..................................................... 25
Figure 6. Zooplankton mortality after electron beam exposure in LW-TMH. ............................................ 25
Figure 7. Percent transmittance after electron beam exposure. ............................................................... 26
LIST OF TABLES
Table 1. Water quality acceptable limits for laboratory water (LW) and amended laboratory water (LW-
TMH) prepared for GWRC bench-scale evaluations. .................................................................................. 10
Table 2. Dates, water type, and organisms tested during electron beam treatment testing. ................... 14
Table 3. Deviations encountered during the electron beam testing. ......................................................... 16
Table 4. Water quality values measured on stock solutions prior to use in dose effectiveness tests of the
electron beam. ............................................................................................................................................ 18
Page 5 of 38Abbreviated Title: Fermi
Date Issued: 25 March 2022
Table 5. Water quality measurements of stock water in each carboy taken prior to preparing sample
vessels for exposure on the day of testing at Fermilab. ............................................................................. 18
Table 6. Temperature, pH, DO, and conductivity measured in solutions at each dose after exposure in E.
coli dose effectiveness tests with the electron beam................................................................................. 19
Table 7. Average E. coli/Total Coliform density, standard error of the mean (SEM), and log reduction
value in LW and LW-TMH dose effectiveness tests of the electron beam. ................................................ 20
Table 8. Temperature, pH, DO, and conductivity results of exposure solutions measured after treatment
with electron beam involving S. capricornutum in LW and LW-TMH. ........................................................ 20
Table 9. Percent mortality (± standard deviation) of S. capricornutum during dose effectiveness testing
with the electron beam. ............................................................................................................................. 21
Table 10. Percent mortality (± standard deviation) of S. capricornutum after incubation for seven days
post treatment with the electron beam. .................................................................................................... 23
Table 11. Temperature, pH, DO, and conductivity results of exposure solutions measured after
treatment with the electron beam involving Eucyclops spp. (EU) and D. magna (DM). ............................ 24
Table 12. Treatment Effect of the electron beam on D. magna and Eucyclops spp. ................................. 24
Table 13. Data quality objectives, criteria, and performance measurement results from water quality
analyses conducted during the electron beam dose effectiveness testing................................................ 26
Table 14. Data quality objective table for bacteria sample analysis. ......................................................... 29
Table 15. Average Relative Percent Difference (RPD) for S. capricornutum counts conducted during the
electron beam dose effectiveness testing. ................................................................................................. 31
Page 6 of 38Abbreviated Title: Fermi
Date Issued: 25 March 2022
1 INTRODUCTION
A major focus area of the LSRI-Great Waters Research Collaborative (GWRC) is providing unbiased,
independent data in support of the accelerated development of technologies having the potential for
preventing the introduction and/or controlling the spread of non-indigenous organisms within the
Laurentian Great Lakes. This report details the results of the LSRI-GWRC bench-scale evaluation of
electron beam treatment for ballast water management. Located at Fermilab, Batavia, IL, USA, A2D2 is a
9 MeV electron beam accelerator that was used to apply a radiation dose to samples containing algae,
bacteria, or zooplankton in laboratory water and amended laboratory water.
This technical report presents qualitative findings from bench-scale tests of the electron beam, which
took place in January 2022 at Fermilab. The research questions answered were:
1. What is the relationship between electron beam treatment dose and response, in terms of
mortality, for a variety of cultured freshwater organisms in low- and high-challenge water?
2. Does electron beam treatment have an impact on water quality (e.g., temperature, pH,
dissolved oxygen)?
3. Is the dose-response relationship impacted by water quality?
2 TEST METHODS
2.1 TEST PLAN AND SOPS
A Test Quality Assurance Plan (TQAP) (Polkinghorne et al., 2021) and standard operating procedures
(SOPs) were used to implement all test activities. These procedures facilitated consistent conformance
to technical and quality system requirements and increased data quality in addition to providing
unbiased, independent data. The TQAP details: collection, analysis, handling, quality objectives, and
quality assurance/quality control (QAQC) requirements for samples and data. It was approved by both
LSRI-GWRC and Fermilab prior to the start of bench-scale test activities. The procedures followed
throughout testing are described in the Test Methods section and listed in the References section of this
report.
2.2 BALLAST WATER MANAGEMENT SYSTEM AND EXPERIMENTAL APPARATUS
The electron beam accelerator used by LSRI-GWRC was stationary, however, compact and portable units
are being developed at Fermilab that may be capable of functioning as an in-line treatment on a vessel.
The technology would treat a vessel’s ballast water as it is taken onboard and/or discharged to the
receiving body of water.
All test exposures were conducted at Fermilab. The irradiation process was conducted by Fermilab staff
in the Illinois Accelerator Research Center’s (IARC’s) Accelerator Applications Development and
Demonstration machine. Located in the pit floor (Figure 1) of the Heavy Assembly Building, A2D2 (Figure
2) was the source of 9 MeV electrons from a repurposed teletherapy linear accelerator, or linac. Its
foundation is a normal conducting multi-cell 2.85 GHz accelerator structure known as a cavity. Electrons
Page 7 of 38Abbreviated Title: Fermi
Date Issued: 25 March 2022
are generated by a thermionic electron gun and the radiofrequency power is supplied by a classic
Klystron amplifier. Once the electrons are accelerated, they are collimated by thin slits and a 270-degree
bending magnet. When combined, these electrons have a narrow momentum spread and are well
focused leaving the vacuum window. From a maximum of 1.2 kW of beam power, A2D2 is capable of
varying dose rates from 0.2 to 1.2 kGy/sec from its internal settings. For this application, A2D2 was run
at 1 kGy/sec and total dose was manipulated by adjusting the irradiation time. Ozone is generated as
the electron beam passes through the air above the sample. If the system was designed to treat ballast
water, it could be configured in a way that would produce minimal to no ozone. To prevent toxicity
caused by ozone, samples were covered during the exposure process. Safety procedures included a
roped off area for operation personnel only, an alarm sounding to indicate that irradiation was about to
occur, and appropriate personal protective equipment.
Figure 1. IARC building pit and electron cave where A2D2 is located.
Page 8 of 38Abbreviated Title: Fermi
Date Issued: 25 March 2022
Figure 2. The electron cave of A2D2 with a sample in the exposure location. Note that GWRC samples
were covered during exposure.
2.3 TRAVELING TO CONDUCT BWMS EVALUATION
LSRI staff members Kimberly Eller, Michael Nagel, Christine Polkinghorne, and Heidi Saillard, traveled
440 miles to Batavia, IL on January 10, 2022 with test water, organisms, equipment, and supplies.
Bench-scale evaluations were conducted at Fermilab from January 11-12, 2022. The team worked
closely with Charles Cooper, Yichen Ji, and Slavica Grdanovska of Fermilab to set up equipment, prepare
samples, and expose samples to the electron beam. LSRI staff were informed of the recommended
operating conditions and safety measures required during operation and when navigating from the lab
to the pit. Analysis of the bacteria samples and a portion of the algae samples were conducted in a
mobile laboratory set up in a hotel room in St. Charles, IL.
2.4 EXPERIMENTAL WATER PREPARATION
Two water types were used to test the biological effectiveness of the electron beam treatment.
Laboratory water (LW) provided a low water quality challenge while amended laboratory water (LW-
TMH) provided a high water quality challenge scenario. These solutions are defined by water quality
parameters including organic carbon, suspended solids, and UV-transmittance. Table 1 outlines the
target ranges for each parameter within samples collected prior to traveling to Fermilab. The two
experimental water types were prepared as follows:
Page 9 of 38Abbreviated Title: Fermi
Date Issued: 25 March 2022
Laboratory Water (LW): One day prior to the start of testing at Fermilab, a 50 L carboy was filled
with LW to the 30 L mark via the hatchery headbox, a temperature controlled and aerated water
source, located in the LSRI Toxicity Testing Lab. This was then sampled for water quality
parameters prior to being split into two-20 L carboys for ease of transport. LW is municipal
water from the City of Superior, Wisconsin that is passed through an activated carbon column to
remove the majority of the chlorine present. The remaining residual chlorine is removed
through injection of sodium sulfite and the resulting total residual chlorine concentration is
below the limit of detection (i.e., < 5.91 µg/L Cl2). Typically, LW has a low concentration of
organic carbon and suspended solids, and a high UV transmittance.
Amended Laboratory Water (LW-TMH): One day prior to the start of testing at Fermilab, a 50 L
carboy was filled to the 30 L mark with LW via the hatchery headbox. LW-TMH was prepared by
amending the LW with 12 mg/L pre-sterilized Fine Test Dust, 12 mg/L pre-sterilized
Micromate™, and 20 mg/L humic acid sodium salt following LSRI/SOP/AT/46- Preparing
Amended Lab Water using Test Dust, Micromate™, and Humic Acid Sodium Salt for use in Bench-
Scale Testing. The amended water was mixed thoroughly until no visible clumps of Fine Test
Dust or Micromate™ remained and a homogenous solution was achieved. This volume was then
sampled for water quality parameters prior to being split into two-20 L carboys for ease of
transport. LW-TMH is used to achieve challenge conditions similar to those stipulated in the U.S.
Environmental Protection Agency (USEPA) Environmental Technology Verification Program’s
Generic Protocol for the Verification of Ballast Water Treatment Technology (ETV), version 5.1
(USEPA, 2010).
Table 1. Water quality acceptable limits for laboratory water (LW) and amended laboratory water
(LW-TMH) prepared for GWRC bench-scale evaluations.
Acceptable Range
Parameter Water Type
for Initiating Bench-Scale Testing
LW
Temperature 22 – 28°C
LW-TMH
LW
pH 6.5–9.0
LW-TMH
LW
Specific Conductivity 120 – 170 µS/cm
LW-TMH
LW
Salinity < 1 ppt
LW-TMH
Page 10 of 38Abbreviated Title: Fermi
Date Issued: 25 March 2022
Acceptable Range
Parameter Water Type
for Initiating Bench-Scale Testing
Dissolved Oxygen LW
4 – 12 mg/L
(DO) LW-TMH
Total Suspended Solids LW Less than reporting limit
(TSS) LW-TMH 11.9 – 30.3 mg/L
LW Less than reporting limit
Particulate Organic Matter (POM)
LW-TMH 4.1 – 12.1 mg/L
Dissolved Organic Carbon LW Less than detection - 2
(DOC) LW-TMH 5.1–7.5 mg/L
Non-Purgeable Organic Carbon LW Less than detection - 2
(NPOC) LW-TMH 5.1 – 13.1 mg/L
93.0 – 100%
LW
Percent UV Transmittance at (filtered and unfiltered)
254 nm (%T) 23.0 – 33.0% (filtered)
LW-TMH
20.0 – 30.0% (unfiltered)
2.5 WATER QUALITY METHODS
Water quality samples were collected and measured from stock water one day prior to beginning testing
at Fermilab. Water quality measurements included determination of total suspended solids (TSS),
percent transmittance (%T), particulate organic matter (POM), non-purgeable organic carbon (NPOC),
dissolved organic carbon (DOC), total alkalinity, total hardness, dissolved oxygen (DO), temperature,
specific conductivity, and pH.
Temperature, DO, specific conductivity, and pH measurements were made on the stock LW and LW-
TMH containers prior to addition of organisms at the Fermilab. After exposures were completed,
temperature, DO, specific conductivity, and pH measurements were made on the chemistry replicates
for each exposure.
2.5.1 TOTAL SUSPENDED SOLIDS, PARTICULATE ORGANIC MATTER, AND MINERAL
MATTER
Total Suspended Solids (TSS) analysis was conducted according to LSRI/SOP/SA/66 – Analyzing Total
Suspended Solids (TSS), Particulate Organic Matter (POM), and Mineral Matter (MM). Sample volumes
(± 1%) were vacuum filtered through ashed, pre-washed, dried, and pre-weighed glass fiber filters (i.e.,
Whatman 934-AH, 1.5 µm particle retention). After each sample was filtered it was dried at 103-105°C in
an oven and brought to a constant weight. TSS values were determined by calculating the weight of
Page 11 of 38Abbreviated Title: Fermi
Date Issued: 25 March 2022
particulates collected on the filter. To determine POM, the residue on the filter from TSS analysis was
ignited to a constant weight at 550°C in a muffle furnace. The concentration of POM was determined by
calculating the difference of the dry weight of the particulates on the filter before and after ignition (the
mass lost due to combustion). Mineral matter was defined and calculated as the difference between TSS
and POM (determined by calculating the mass left on the filter after combustion).
2.5.2 PERCENT TRANSMITTANCE AT 254 NM
Percent Transmittance (%T) analysis was conducted according to LSRI/SOP/SA/69 – Laboratory
Determination of Percent Transmittance (%T) of Light in Water at 254 nm on both unfiltered and
filtered aliquots of each TSS sample collected using a Perkin Elmer Lambda 35 UV-Vis
spectrophotometer. For analysis of the filtered aliquots, an appropriate volume of sample was filtered
through a glass fiber filter (i.e., Whatman 934-AH, 1.5 µm particle retention). Deionized water was used
as a reference to adjust the spectrophotometer to 100%T, and then each unfiltered and filtered sample
aliquot was measured in a pre-rinsed sample cuvette with a 1 cm path length at 254 nm.
2.5.3 ORGANIC CARBON ANALYSIS
Dissolved organic carbon (DOC) and non-purgeable organic carbon (NPOC) analysis was conducted
following LSRI/SOP/SA/47 – Measuring Organic Carbon in Aqueous Samples. Organic carbon analysis was
performed using a Shimadzu Total Organic Carbon Analyzer, Model TOC-L, using a 1,000 mg/L organic
carbon standard to prepare a working standard of 50 mg/L C. This standard was acidified to a pH < 2
with concentrated hydrochloric acid (HCl; ~ 0.2% v/v) and was used to generate a calibration curve.
Before analysis, the NPOC samples were acidified to a pH < 2 with concentrated HCl and DOC samples
were filtered through a glass fiber filter (i.e., Whatman GF/F, 0.7 µm nominal particle retention) and
acidified in the same manner as NPOC samples. Samples were stored atAbbreviated Title: Fermi
Date Issued: 25 March 2022
2.5.6 DISSOLVED OXYGEN
The DO concentration of the test water was measured using an YSI ProSolo Handheld Meter and Optical
Dissolved Oxygen/Temperature Probe (YSI, Incorporated, Yellow Springs, OH) according to
LSRI/SOP/GLM/34 - Calibrating, Maintaining, and Using the YSI ProSolo Handheld Meter and Optical
Dissolved Oxygen/Temperature Probe to Measure Dissolved Oxygen in Water Samples. The DO meter
was calibrated daily.
2.5.7 PH
The pH of the test water was measured using an Orion 3 Star meter with a pH combination electrode
and automatic-temperature-compensation (ATC) probe, following LSRI/SOP/GLM/05 – Procedure for pH
Meter Calibration and pH Measurement for Ballast Treatment Systems Utilizing pH as the Active
Substance. The pH meter was calibrated daily with a three-point calibration and verified for accuracy
using a pH 8.00 check buffer. The pH 8.00 buffer was measured at regular timepoints throughout
analysis to verify that the meter did not drift.
2.5.8 SPECIFIC CONDUCTIVITY
The specific conductivity of the test water was measured using an Oakton Model CON 150
Conductivity/TDS/Temperature Meter (Oakton Instruments; Vernon Hills, IL), hereafter referred to as
the CON 150 Meter. The CON 150 Meter was calibrated on a monthly basis and was verified for accuracy
each day prior to sample analysis using a Daily Check Standard (i.e., 0.0100 M potassium chloride)
according to LSRI/SOP/GLM/28 - Procedures for Calibrating and Using the Oakton CON150
Conductivity/TDS/Temperature Meter.
2.5.9 TEMPERATURE
Temperature was measured using a Fisher digital thermometer that was calibrated quarterly against a
certified National Bureau of Standards mercury thermometer according to LSRI/SOP/GLM/17 –
Procedures for Thermometer Verification and Calibration.
2.6 DOSE EFFECTIVENESS TESTING METHODS
Dose effectiveness tests measured treatment effects, in terms of mortality, of the electron beam
treatment on organisms traditionally used for laboratory toxicity testing. All organisms used in dose
effectiveness tests were cultured by LSRI. The overall experimental design was outlined in the test plan
(Polkinghorne et al., 2021). The nominal dose, in units of kilograys (kGy), applied to each organism is
shown in Table 2.
For each control and exposure dose for all organisms, there were three replicates and an additional
chemistry replicate for water quality measurements. Once control and treatment sample vessels were
filled with the appropriate water and organisms, they were taken to the electron cave. A labeled
dosimetry film was placed on the cap of the sample vessel before exposure. After the film completely
developed (approximately 24 hours), it was used to determine the actual dose applied to each sample.
Page 13 of 38Abbreviated Title: Fermi
Date Issued: 25 March 2022
For each dose (1, 2, 5, 10, 20, and 50 kGy) sample replicates were placed individually into the A2D2 and
exposed to the electron beam (Figure 2). Table 2 outlines the dates when tests were conducted, the
water type used, and the doses applied to samples. Throughout the report the doses displayed in tables
and figures are nominal doses, while actual doses applied are shown in Appendix 1.
Table 2. Dates, water type, and organisms tested during electron beam treatment testing.
Date Water Type Organisms Dose (kGy)
E. coli 0, 1, 2, 5, 10, 20, 50
11 January 2022 LW
S. capricornutum 0, 1, 2, 5, 10, 20, 50
S. capricornutum 0, 1, 2, 5, 10, 20, 50
LW-TMH E. coli 0, 1, 2, 5, 10, 20, 50
12 January 2022
Eucyclops spp./D. magna 0, 1, 2, 5, 10
LW Eucyclops spp./D. magna 0, 1, 2, 5, 10
2.6.1 BACTERIA
Cryovials containing frozen stock cultures of Escherichia coli prepared from the American Type Culture
Collection stock (ATCC 25922; Manassas, VA, USA) were packaged in a culture box and transported in a
cooler with commercial ice packs frozen at -80°C. Six to eight hours prior to testing, Tryptic Soy Broth
(TSB) was inoculated with E. coli from stock cultures and incubated at 37°C in a shaking water bath to
prepare a log phase culture. A 10-L carboy containing 7-L of 25°C ± 5°C test water (LW or LW-TMH) was
spiked with the log phase culture to bring the density of E. coli to ≥10,000 most probable number
(MPN)/mL following LSRI/SOP/GWRC/14 – Assessing Antimicrobial Effectiveness. The spiked test water
was mixed well and aseptically portioned into 8-oz polypropylene exposure vessels to a level of 3 cm
(~160 mL). Exposure vessels were held in a cooler to maintain the desired test temperature until
exposure at Fermilab.
Following exposure, control and treated samples were transported in a cooler on wet ice to an offsite
lab for analysis within 8 hours. The density of total coliform bacteria and E. coli was determined using
LSRI/SOP/SA/56 – Detection and Enumeration of Total Coliforms and E. coli Using Colilert®, which is
based on IDEXX’s patented Defined Substrate Technology (DST®). Briefly, 100 mL of sample (or sample
plus sterile deionized water when dilution was required) was mixed with Colilert-18 media, sealed in a
Quanti-Tray/2000 and incubated at 35°C ± 0.5°C for 18–22 hours. Positive wells were counted, and
results were reported in MPN/100 mL, which correlates with CFU/100 mL. Dose effectiveness results for
bacteria were expressed as MPN/100 mL or as log10 reduction.
2.6.2 ALGAE
For S. capricornutum testing, a 10-L carboy containing 7-L of LW or LW-TMH was spiked with 16.1 mL of
algae from 4- to 8-day old cultures (8.71x10⁷ cells/mL), to obtain approximately 200,000 cells/mL,
following LSRI/SOP/GWRC/11 – Assessing Bench-Scale Dose Effectiveness of Potential Ballast Water
Treatment Processes on Selenastrum capricornutum. Following addition of S. capricornutum, the water
Page 14 of 38Abbreviated Title: Fermi
Date Issued: 25 March 2022
was manually mixed by inverting the carboy. The spiked water was then portioned into 8-ounce
polypropylene exposure vessels to a level of 3 cm (~160 mL) for exposure and control use.
After all exposures were completed, a 1 mL subsample of the S. capricornutum was collected from each
replicate for algae enumeration and analyzed by staining the cells with the mortal stain SYTOX® Green.
LSRI/SOP/GWRC/11 was followed for staining and counting. Counting was conducted by enumerating
the number of live and dead cells within a known area on a hemocytometer using a compound
microscope equipped with epifluorescence able to excite samples at 450-490 nm under 400x
magnification.
2.6.2.1 DELAYED MORTALITY OF ALGAE
After enumeration, LW-TMH samples were saved in the exposure vessels, placed in a portable incubator
set to 25°C and transported back to the LSRI lab. Upon arrival at the lab, subsamples were collected
from each vessel and placed in sterile flasks. USEPA nutrient media was added to each flask and
incubated at 25°C ± 1.0°C with continuous light for five days, seven days from the initial exposure.
Mortality was assessed as described in Section 2.6.2.
2.6.3 ZOOPLANKTON
Approximately 1,000 D. magna neonates were collected from brood boards that had been renewed
three days prior. Neonates were split into two separate 1-L plastic bottles. Approximately 1,000 mixed
age Eucyclops spp. adults were collected from mixed Lumbriculus variegatus/Eucyclops spp. culture
tanks. The adults were split into two separate 1-L plastic bottles. The bottles containing each
zooplankton species were transported in a portable incubator set to maintain a temperature of 25 °C.
D. magna and Eucyclops spp. sample vessels were filled with a small volume of the appropriate water
type (temperature adjusted to 25°C ± 3°C) and then both organisms were transferred into the vessels via
wide-mouth Pasteur pipette. The vessels were then filled to 3 cm after a quality control count was
conducted by a second analyst.
Mortality in the zooplankton was determined by visual observation for any movement of the organisms
following LSRI/ SOP/GWRC/9– Assessing Bench-Scale Dose-Effectiveness of Potential Ballast Water
Treatment Processes on Eucyclops spp. and LSRI/SOP/GWRC/10– Assessing Bench-Scale Dose
Effectiveness of Potential Ballast Water Treatment Processes on Daphnia magna. Nonmotile organisms
were gently prodded with a metal probe to induce a response before declaring the organism deceased.
As mortality assessment occurred immediately after exposure, once 100% mortality was observed in a
treatment group, any higher doses remaining were omitted from testing.
2.7 DEVIATIONS
Deviations from the test plan and SOPs that occurred during testing are listed in Table 3 along with
corrective actions that were taken as a response to the deviation. Perceived impact of the deviation on
the test results are also listed in the table.
Page 15 of 38Abbreviated Title: Fermi
Date Issued: 25 March 2022
Table 3. Deviations encountered during the electron beam testing.
Do the
1.Description of the Deviation or Quality Data
Description of
Control Failure Describe the Impact on the Need to
Test Date(s) Corrective
Project/Test be
2. Root Cause of #1 Action(s)
Qualified?
(Y/N)
1. The QCI 171 Multi-Analyte Solids
Standard Solution (Lot#210629) was Standard was re-
not within the acceptance range for analyzed on the Minimal impact, POM was
POM analysis. following day, within acceptable ranges for
10 January 2022 Y
1/11/22, and the the standard after standard
2. Analyst error. Standard solution was POM was within the was shaken well.
not shaken enough to resuspend acceptable range.
solids after storage.
1. No duplicates were collected or Minimal impact, all parameters
analyzed for TSS/POM, NPOC, DOC, No corrective action for stock water samples were
10 January 2022 or %T. N
taken. within the acceptable ranges to
2. Analyst error. begin a test.
1. The average relative percent
difference between the dead cell counts
in LW and the quality assurance counts
is greater than 20%.
Minimal, variation in cells
2. Dead cells in each row were less than Verify discrepancies
11 January 2022 counted was low and RPD in QA Y
10 cells and the counts between while counting.
counts on live cells wasAbbreviated Title: Fermi
Date Issued: 25 March 2022
Do the
1.Description of the Deviation or Quality Data
Description of
Control Failure Describe the Impact on the Need to
Test Date(s) Corrective
Project/Test be
2. Root Cause of #1 Action(s)
Qualified?
(Y/N)
collected from brood boards renewed
on 1/7/2022 were used instead.
No impact, control samples
grew and all DQO were
1. Incubator out of 35°C ± 0.5°C Monitored acceptable. Temp at lowest
temperature range. temperature closely when power was out for an
12 January 2022 N
2. Power outage and adjusting dial to and adjusted as hour and a half (32.42°C) and
temperature after travel. needed. did not go above 37°C, the
temp at which cultures are
grown at.
1. The relative percent differences
between the algae samples and
duplicates for both LW and LW-TMH are
greater than 20%. Mix subsample well
2. Samples and duplicates had prior to pipetting
12 January 2022 comparable quantities of dead cells, but Minimal Y
onto
live cells present in the rows counted hemocytometer.
varied greatly, sometimes by 50%.
3 RESULTS
Findings from the electron beam dose effectiveness tests are presented in the following subsections.
3.1 WATER QUALITY PRIOR TO EXPOSURE
Water quality was measured in stock solutions of LW and LW-TMH immediately after they were
prepared in LSRI’s lab one day prior to testing at Fermilab (Table 4). Water quality measurements of the
stocks met the water quality acceptance requirements listed in the test plan and in Table 1
(Polkinghorne et al., 2021). Additionally, water quality measurements of the stocks were measured daily
prior to addition of organisms to ensure there was no significant change in water quality (Table 5).
Page 17 of 38Abbreviated Title: Fermi
Date Issued: 25 March 2022
Table 4. Water quality values measured on stock solutions prior to use in dose effectiveness tests of
the electron beam.
Parameter LW Stock LW-TMH Stock
Temperature (°C) 24.3 23.8
pH 7.18 7.19
DO (mg/L) 7.1 7.4
Conductivity (µS/cm) 166.1 159.9
Hardness (mg/L CaCO3) 52.4 51.6
Alkalinity (mg/L CaCO3) 59.5 59.9
TSS (mg/L)Abbreviated Title: Fermi
Date Issued: 25 March 2022
follow the temperature trend. In general, temperature increased and pH and DO concentrations
decreased as the applied dose increased in both LW and LW-TMH. In the 50 kGy LW samples, water
temperature increased 10.4°C, pH decreased by 0.42, and DO decreased by 4.5 mg/L compared to the
controls. In the 50 kGy LW-TMH samples, water temperature increased 7.2°C, pH decreased by 1.07, and
DO decreased by 4.7 mg/L compared to the controls. The conductivity was not impacted by treatment
with the electron beam in either water type.
Table 6. Temperature, pH, DO, and conductivity measured in solutions at each dose after exposure in
E. coli dose effectiveness tests with the electron beam.
ECO-LW ECO-LW-TMH
Dose
(kGy) Temp. DO Conductivity Temp. DO Conductivity
pH pH
(°C) (mg/L) (µS/cm) (°C) (mg/L) (µS/cm)
0-
21.4 7.72 8.9 168.1 21.1 7.77 8.4 160.5
Control
1 16.4 7.62 7.6 168.9 16.6 7.54 7.4 161.9
2 18.4 7.49 6.7 167.3 16.7 7.41 7.0 161.6
5 22.2 7.34 5.8 167.3 20.4 7.21 5.6 160.3
10 22.7 7.35 5.8 167.6 21.2 7.05 5.3 161.1
20 24.6 7.30 5.3 168.0 22.9 6.93 4.5 159.0
50 31.8 7.30 4.4 168.0 28.3 6.70 3.7 156.1
E. coli and total coliform values were equivalent for all sample analyses; therefore E. coli/Total coliform
values are reported as one value. The density of E. coli in all control replicates were >1,000,000
MPN/100 mL for both the LW and LW-TMH tests (Table 7), indicating that initial target concentrations
for dose effectiveness testing were achieved for all control and treatment replicates. Densities of E. coli
were below the limit of detection (LOD) for all exposure doses (1-50 kGy) treated by the electron beam,
indicating it is effective at killing indicator bacteria in both LW and LW-TMH, even at the lowest dose.
Samples from the 1-5 kGy exposure doses in LW are reported asAbbreviated Title: Fermi
Date Issued: 25 March 2022
Table 7. Average E. coli/Total Coliform density, standard error of the mean (SEM), and log reduction
value in LW and LW-TMH dose effectiveness tests of the electron beam.
ECO-LW ECO-LW-TMH
E. coli/Total E. coli/Total
Dose (kGy) coliform coliform
Log Reduction Log Reduction
MPN/100 mL MPN/100 mL
(SEM) (SEM)
5,454,000 5,515,000
0 - Control NA NA
(710,900) (433,700)
1 5.7Abbreviated Title: Fermi
Date Issued: 25 March 2022
SC-LW SC-LW-TMH
Dose (kGy) DO Conductivity DO Conductivity
Temp. (°C) pH Temp. (°C) pH
(mg/L) (µS/cm) (mg/L) (µS/cm)
10 23.0 7.54 6.9 168.0 22.3 7.07 4.9 161.2
20 25.2 7.51 6.3 168.0 24.2 6.92 3.6 160.3
50 33.9 7.48 4.9 178.2 30.2 6.72 3.1 156.1
Initial counts of S. capricornutum in the 10 L carboy were targeted to be approximately 200,000
cells/mL. S. capricornutum cell counts, presented as percent mortality, are shown in Table 9 and Figure
3. Algae cell densities in the LW and LW-TMH controls were above the targeted density of >200,000
cells/mL at 259,111 cells/mL and 277,037 cells/mL, respectively. All control sample cell counts in both
LW and LW-TMH showed mortality rates of >1%. Percent mortality in LW samples ranged from 2% in the
1 kGy exposure samples to 99% in the 50 kGy exposures. Percent mortality in LW-TMH samples ranged
from 0% in the 1 kGy exposure samples to 85% in the 50 kGy exposures.
The LW samples took approximately nine hours to enumerate, while the LW-TMH samples took
approximately six hours to enumerate. This time difference was due to having to relocate the
microscope and then experiencing a power outage during analysis of the LW samples. This extended
time may account for the increased mortality observed in the lower dose LW samples and for the high
standard deviation in the 10 and 20 kGy LW exposures. For example, the first 10 kGy sample replicate
had 0% mortality, while the second and third replicate (counted six hours later) had 54% and 64%
mortality, respectively. In the LW samples the first replicate was analyzed first in all doses, except 2 kGy.
Analysis started with the control and went in ascending order through the doses. After the first replicate
was analyzed for all doses, analysis of the remaining two replicates began, starting back at the control
and moving in ascending order through the doses. Since the first replicate was analyzed approximately
4-6 hours prior to the second and third replicates, a greater percentage of mortality was observed in the
second and third replicates, signifying delayed mortality. This observation led to the unplanned testing
with the S. capricornutum samples in LW-TMH being incubated for seven days to examine delayed
mortality.
Table 9. Percent mortality (± standard deviation) of S. capricornutum during dose effectiveness
testing with the electron beam.
Percent Mortality (Std Dev)
Dose (kGy)
LW LW-TMH
0 - Control 0 (0.5) 0 (0)
1 2 (2.0) 0 (0)
2 7 (2.4) 1 (0.5)
Page 21 of 38Abbreviated Title: Fermi
Date Issued: 25 March 2022
Percent Mortality (Std Dev)
Dose (kGy)
LW LW-TMH
5 8 (7.7) 0 (0)
10 39 (34) 0 (0.6)
20 76 (22) 10 (5.5)
50 99 (1.4) 85 (15)
100
90
80
70
Percent Mortality
60
50
LW
40
LW-TMH
30
20
10
0
0 1 2 5 10 20 50
Dose (kGy)
Figure 3. S. capricornutum mortality during dose effectiveness testing with the electron beam.
3.3.1 DELAYED MORTALITY OF ALGAE
The LW-TMH samples containing S. capricornutum that were incubated for seven days after exposure
were enumerated to determine if delayed mortality occurred. Table 10 shows that all S. capricornutum
cells were alive in the control samples and that 83% were dead in the samples exposed to the 1 kGy
dose. All samples exposed to the remaining doses (2, 5, 10, 20, and 50 kGy) experienced 100% mortality
after the incubation period. Live/dead count was difficult to determine in samples above 2 kGy, as some
cells fluoresced neither red nor green, and many algal cells were ruptured and difficult to differentiate
from LW-TMH particles. Figure 4 shows the LW-TMH algae sample flasks after incubation. The yellowish-
green color seen in the control flask is an indicator of live algae. The color is vastly decreased in the 1
kGy and 2 kGy flasks, while exposures higher than 2 kGy are completely colorless, indicating a lack of live
algae.
Page 22 of 38Abbreviated Title: Fermi
Date Issued: 25 March 2022
Table 10. Percent mortality (± standard deviation) of S. capricornutum after incubation for seven days
post treatment with the electron beam.
Percent Mortality (Std Dev)
Dose (kGy)
LW-TMH
0 - Control 0 (0)
1 83 (2.0)
2 100 (0)
5 100 (0)
10 100 (0)
20 100 (0)
50 100 (0)
Figure 4. Photograph of LW-TMH algae sample flasks after five-day incubation period.
Page 23 of 38Abbreviated Title: Fermi
Date Issued: 25 March 2022
3.4 ZOOPLANKTON
Results of water quality measurements taken post-exposure with the zooplankton samples are shown in
Table 11. As was seen in the bacteria and algae exposure solutions, the electron beam had no effect on
conductivity values, but did cause an increase in the temperature and a decrease in both pH and DO
values. Due to 100% mortality being achieved in the 10 kGy dose, data for the higher exposures were
not measured.
Table 11. Temperature, pH, DO, and conductivity results of exposure solutions measured after
treatment with the electron beam involving Eucyclops spp. (EU) and D. magna (DM).
DM/EU LW DM/EU LW-TMH
Dose
Temp. DO Conductivity Temp. DO Conductivity
(kGy) pH pH
(°C) (mg/L) (µS/cm) (°C) (mg/L) (µS/cm)
0 - Control 21.8 7.68 8.3 169.5 22.1 7.60 8.3 162.1
1 22.1 7.57 7.4 169.9 22.6 7.44 6.3 162.5
2 22.4 7.49 6.5 168.6 22.7 7.26 5.3 162.9
5 23.0 7.41 6.0 168.7 23.7 7.10 4.0 163.6
10 24.1 7.39 5.8 169.0 24.4 6.96 2.7 163.2
Percent mortality of both D. magna and Eucyclops spp. are presented in Table 12, and in Figure 5 and
Figure 6. Mortality of the control organisms for both species of zooplankton was 0%. Eucyclops spp.
mortality wasAbbreviated Title: Fermi
Date Issued: 25 March 2022
100
90
80
70
Percent Mortality
60
50
D. magna
40
Eucyclops spp.
30
20
10
0
0 1 2 5 10
Dose (kGy)
Figure 5. Zooplankton mortality after electron beam exposure in LW.
100
90
80
70
Percent Mortality
60
50
D. magna
40
Eucyclops spp.
30
20
10
0
0 1 2 5 10
Dose (kGy)
Figure 6. Zooplankton mortality after electron beam exposure in LW-TMH.
3.5 TREATMENT EFFECT ON WATER QUALITY
Composite samples from algae dose effectiveness tests were collected after a delayed mortality study
described in Section 2.6.2.1. These composite samples were analyzed for %T, filtered and unfiltered,
following Section 2.5.2. Samples were not analyzed within the required holding time of 24 hours;
therefore, results should be used for qualitative purposes only. The water clarity, as demonstrated by
Page 25 of 38Abbreviated Title: Fermi
Date Issued: 25 March 2022
the %T results and the exposure of the water to the electron beam are directly correlated, as seen in
Figure 7. As the exposure increased from 1 kGy to 50 kGy the percent transmittance in filtered and
unfiltered samples also increased, indicating that the exposed samples were becoming clearer as dose
increased.
90.0
80.0
70.0
% Transmittance
Unfiltered LW-TMH
60.0
y = 26.537x + 27.675
R² = 0.9805
50.0
Filtered LW-TMH
y = 29.432x + 33.6
40.0
R² = 0.9893
30.0
20.0
0 0.5 1 1.5 2
Log of Kilograys Applied
Figure 7. Percent transmittance after electron beam exposure.
4 QUALITY ASSURANCE/QUALITY CONTROL – DATA QUALITY OBJECTIVES
4.1 WATER QUALITY DATA QUALITY OBJECTIVES
The data quality objectives (DQO) for water quality analyses conducted during the evaluation of the
electron beam are summarized in Table 13. Precision data quality objectives were not met for %T,
NPOC, TSS, and POM because no duplicate samples were collected.
Table 13. Data quality objectives, criteria, and performance measurement results from water quality
analyses conducted during the electron beam dose effectiveness testing.
Data Evaluation Data
Quality Process/Performance Quality Performance Measurement Result
Indicator Measurement Objective
Samples (10%) were collected < 20% Percentage of
Precision and analyzed in duplicate average Samples
with performance measured RPD Collected and Duplicate Relative Percent Difference
Page 26 of 38Abbreviated Title: Fermi
Date Issued: 25 March 2022
Data Evaluation Data
Quality Process/Performance Quality Performance Measurement Result
Indicator Measurement Objective
by average relative percent Analyzed in
difference (RPD) Duplicate:
%TF: 0% NC
%TU: 0% NC
NPOC: 0% NC
DOC: 22.2% DOC: 4.1 ± 0%
POM: 0% NC
TSS: 0% NC
Hardness: 50% Hardness: 5.9 ± 0%
Alkalinity: 50% Alkalinity: 4.8 ± 0%
%T method blanks were
Number of %T
prepared by filtering > 98%
Method Blanks Filter blanks (%T): 99.7 ± 0.1%
deionized water samples (one average %T
Analyzed: 2
per analysis date)
Number of TSS
TSS/POM method blanks
Method Blanks Method Blanks (TSS)=Abbreviated Title: Fermi
Date Issued: 25 March 2022
Data Evaluation Data
Quality Process/Performance Quality Performance Measurement Result
Indicator Measurement Objective
measured and nominal < 20% Reference
reference standard values average D Standard:
TSS: 100% TSS: NA
POM: 100% POM: NA
NPOC: 100% NPOC: 0.7 ± 0.0%
Percentage (vs
A least one
total samples) NPOC 10 mg/L Standard % Difference
per 10
Check Standards:
samples
< 10% NPOC/DOC:
average D 2.40 ± 0.6%
11.4%
A hardness/alkalinity Hardness: DQO met 100% of the time
reference standard was
Percentage of
analyzed once per bench Within
Analysis Days
scale test type per analyst. acceptance
Containing a
Performance was measured range (lot
Reference Alkalinity: DQO met 100% of the time
by ensuring the titrated value dependent)
Standard: 100%
was within the acceptance
range for the standard
All samples were collected, Not All water quality samples were collected, handled,
Represent-
handled, and analyzed in the Applicable – transported and analyzed in the same manner using the
ativeness
same manner Qualitative. appropriate SOPs.
Routine procedures were
conducted according to Not
The SOPs listed in the methods and references section
Comparability TQAPS and appropriate SOPs Applicable –
were used for all water quality analyses.
to ensure consistency Qualitative.
between tests
Percentage of valid (i.e., TSS: 100%
collected, handled, analyzed
%T, Filtered: 100%
correctly and meeting DQOs)
water quality samples %T, Unfiltered: 100%
Completeness measured out of the total > 90% C NPOC: 100%
number of water quality
samples collected. DOC: 100%
Performance is measured by Hardness: 100%
percent completeness (%C)
Alkalinity: 100%
The limit of detection (LOD) TSS/POM RL: 1.25 mg/L based on filtering 800 mL of
and limit of quantification sample
Not
Sensitivity (LOQ) for each analyte and
Applicable
analytical method utilized NPOC/DOC LOD: 0.77mg/L
was determined annually
Page 28 of 38Abbreviated Title: Fermi
Date Issued: 25 March 2022
Data Evaluation Data
Quality Process/Performance Quality Performance Measurement Result
Indicator Measurement Objective
unless a reporting limit was
used based on the amount NPOC/DOC LOQ: 2.6 mg/L
filtered as was the case with
TSS/POM Determined 19 October 2021
4.2 BACTERIA
The data quality objectives (DQO) for bacterial analyses conducted during the evaluation of FERMI
electron beam are summarized in Table 14. Data quality objectives for precision, bias, accuracy and
completeness (i.e., method blanks, duplicate agreements, and quantitative positive and negative
controls) were all within acceptable limits.
Table 14. Data quality objective table for bacteria sample analysis.
Evaluation Process/
Data Quality Data Quality
Performance Performance Measurement Result
Indicator Objective
Measurement
E. coli: 6 of 42 (14%) reported
samples were analyzed in duplicate;
Rlog not greater than Rlog for 3 were not calculable as both
Samples (10%) are
0.355 for E. coli samples were below the countable
analyzed in duplicate –
range, remaining 3 average Rlog =
with performance
0.140
Precision measured Rlog not
Total Coliforms: 6 of 42 (14%)
greater than precision
reported samples were analyzed in
criterion (PC) Rlog not greater than
duplicate; Rlog for 3 were not
0.355 for Total
calculable as both samples were below
Coliforms
the countable range, remaining 3
average Rlog = 0.140
Samples (10%) are
counted by two
E. coli/Total Coliforms: 11 of 85 (13%)
separate analysts with
samples analyzed were recounted by
performance measuredAbbreviated Title: Fermi
Date Issued: 25 March 2022
Evaluation Process/
Data Quality Data Quality
Performance Performance Measurement Result
Indicator Objective
Measurement
same method as
samples on each
analysis date.
E. coli: 1 of 1 quantitative analysis
E. coli: 60-282
within IDEXX acceptance ranges (n=1)
MPN/100 mL
ECO (E. coli) =172.5 MPN/100 mL
Total Coliforms: 1 of 1 quantitative
IDEXX-QC samples are
Bias analysis within IDEXX acceptance
analyzed as a Total Coliforms: 42-
Positive/Negative ranges (n=1)
quantitative positive 128 MPN/100 mL
Control Total Coliform (Klebsiella variicola)
and negative controls at
and =63.7 MPN/100 mL
least once per
Accuracy Negative Control: 1 of 1 quantitative
treatment system test.
analysis within IDEXX acceptable
Negative Control:Abbreviated Title: Fermi
Date Issued: 25 March 2022
of samples. For all testing with S. capricornutum, the minimum number of duplicate and quality
assurance samples were met or exceeded (Table 15). The average relative percent difference of live
counts for both LW and LW-TMH samples was greater than 20% during duplicate analysis. This was the
result of the samples and duplicates having a comparable quantity of dead cells present, but varying
amounts of live cells present in the rows counted. In all cases more than 10 total cells were counted. The
average relative percent difference between the dead cells counted in LW in the quality assurance
counts was also greater than 20%. This was due to the dead cells per row being very low (under 10 cells)
and counts between analysts varying by one to two dead cells per row.
Table 15. Average Relative Percent Difference (RPD) for S. capricornutum counts conducted during the
electron beam dose effectiveness testing.
Average Relative
Duplicate or Quality Percent of Samples
Water Type DQO Percent Difference
Assurance Count with QA/Duplicate
Live Dead
Duplicate 14 RPD ≤ 20%, when 43.2 12.8
LW
Quality Assurance 14 greater than 10 6.0 31.2
Duplicate 14 cells of live/dead 34.5 14.3
LW-TMH
Quality Assurance 14 are counted 8.4 18.4
4.4 ZOOPLANKTON TESTING
During dose effectiveness testing with Eucyclops spp. and D. magna data quality was ensured by having
a second individual conduct counts on a minimum of 10% of the samples. QA counts were conducted on
13.3% of zooplankton samples with an RPD of 0%, both meeting the DQO.
5 CONCLUSIONS AND DISCUSSION
Over the course of several days in January 2022, LSRI-GWRC evaluated electron beam treatment as a
potential ballast water treatment method at Fermilab. The electron beam accelerator used for this study
functioned as planned during testing and no delays were encountered. The data discussed in the
previous sections was used to evaluate the following questions.
Objective 1: What is the relationship between electron beam treatment dose and response, in
terms of mortality, for a variety of cultured freshwater organisms in low- and high-challenge
water?
The bacteria, E. coli, was highly sensitive to treatment by electron beam with even the lowest
dose causing 100% mortality in both water types (Table 7). The algae, S. capricornutum,
appeared to be the least sensitive of the organisms exposed to electron beam. In the counts
made on the day of exposure, there were live cells in the highest dose (50 kGy) in both water
types (Table 9). S. capricornutum cells exposed in LW-TMH and incubated for 7 days post
exposure showed 100% mortality in all doses except for the lowest dose (Table 10). This
suggests that S. capricornutum are sensitive to treatment with electron beam, but that the
impact takes longer to present itself. Both the Eucyclops spp. and D. magna reacted similarly to
treatment with electron beam (Table 12). While the Eucyclops spp. had slightly more mortality
Page 31 of 38You can also read