The effectiveness of ICEV phase out at 2035 in terms of CO2 emission reduction in the Italian scenario
←
→
Page content transcription
If your browser does not render page correctly, please read the page content below
Proceedings of the 6th International Conference on Energy Harvesting, Storage, and Transfer (EHST’22)
Niagara Falls, Canada – June 08-10, 2022
Paper No. 146
DOI: 10.11159/ehst22.146

  The effectiveness of ICEV phase out at 2035 in terms of CO2 emission
                     reduction in the Italian scenario
                                           Pietro Capaldi, Francesca Maria Grimaldi
                                        STEMS Institute, Consiglio Nazionale delle Ricerche
                                                   Via Marconi 4, Naples, Italy
                                    pietro.capaldi@cnr.it; francescamaria.grimaldi@stems.cnr.it;

Abstract - Many studies have focused on the advantages of electrification in reducing greenhouse gas (GHG) emissions of vehicles,
therefore on the advantages of battery electric vehicles (BEVs) compared to conventional internal combustion engine (ICEVs) or hybrid
electric vehicle ones (HEVs). However, is the world already prepared for this revolution? This Paper seeks to evaluate the actual
advantage of adopting a phase out in the production of HEV and ICEV cars by 2035 for Italy. To this aim, a comparison of the most up-
to-date “cradle-to-grave” LCA analyses applied to ICEVs, HEVs, BEVs, performed with similar methodologies and including only
climate change impact, was carried out in order to establish a mean specific CO 2 emission value for battery production. This carbon
intensity was compared to the actual specific CO2 emission of the energy used in the whole manufacturing process and for base materials
production/refining. The data obtained was then applied to the Italian context considering both the current (2020) specific energy carbon
intensity and some others forecasted for 2035, the latter calculated on the basis of the road map envisaged for Italy to meet the “Fit for
55 package” goals. Subsequently, this value was applied to the most representative BEVs and HEVs categories (A-, B-, C-, M-segments)
in order to assess, for each model, its carbon debt against a conventional ICEV. At the same time, data on end-use energy consumption
were collected and specific CO2 emissions (g/km) were calculated for the same vehicles. In this way it was possible to correlate for each
electrified vehicle the carbon debt related to battery production with the use-phase CO2 emission savings, hence to achieve a Break-Even
Point in respect to global carbon emissions. This analysis was performed by considering both current data, predicted values regarding
future energy carbon intensity/battery capacity, the thermal-based powertrains evolution and the adoption of fuels with very low carbon
content (e-fuels and biofuels). The results have outlined some advantages related to BEVs; nevertheless, their actual weight on the global
CO2 emissions reduction would remain rather small by 2035, especially if considering the possible adoption of Low Carbon Fuels in
ICEVs and HEVs. Therefore, policymakers should carefully move towards a too rapid electrification roadmap, which could seriously
damage the significance of the car industry within the Italian production landscape and require major infrastructure investments without
yielding substantial results in terms of CO2 reduction.

Keywords: 2035 phase-out, decarbonisation, LCA, energy mix, BEV, ICEV, HEV

1. Introduction
     In order to reduce climate change and thus avoid potentially disastrous impacts on the environment, a rapid
decarbonisation of all world economic sectors is required [1]. Vehicle transportation is nowadays one of the biggest
greenhouse gas (GHG) emitting sectors in the world contributing to around 25% of the total CO 2 emissions (2022) and in
general to air pollution [2, 3]. For this reason, a wide variety of technologies and policies have been suggested in order to
face this problem in many Countries, along with diversified ways to achieve the targets needed to meet mitigation in CO 2
production [4]. In particular, among the latter, electrification is one of the most noticeable actions considered to decarbonize
the transportation sector [5]. In Italy, where cars amount to about 39 million units [6], the decarbonisation of the transport
sector is considered a particularly relevant challenge due to the very slow renewal of the older, more-emitting cars, the
substantial lack of alternative low-carbon fuels and the slow pace at which the electric transition is moving. In 2021, in fact,
battery electric vehicles (BEVs) market share represented a value which is well below 1% of the entire circulating park,
despite a significant growth in the adoption of BEVs in the last few years [6, 7]. This fact can be explained by considering
the still excessive vehicle cost, the unavailability of charging infrastructure (with consequent range-anxiety by Customers
[8]) and the comparatively few vehicle types availableness [9]. However, the market is diversifying rapidly, with many BEV
and PHEV car models announced to be commercially acquirable in the Italian market for the next future. In this way, as also
predicted by many scenarios, BEVs market is expected to speed up in the next future [10]. In fact, these vehicles present
favourable advantages compared to ICEV or HEV counterparts in terms of higher energy efficiency and of lower CO 2
emissions, especially for large cars (e.g. sedans belonging to D and E Segments), as highlighted in various Papers [11-13].
However, it has to be underlined that the advantages related to CO2 emissions within the previously cited Papers could be
                                                           EHST146 -1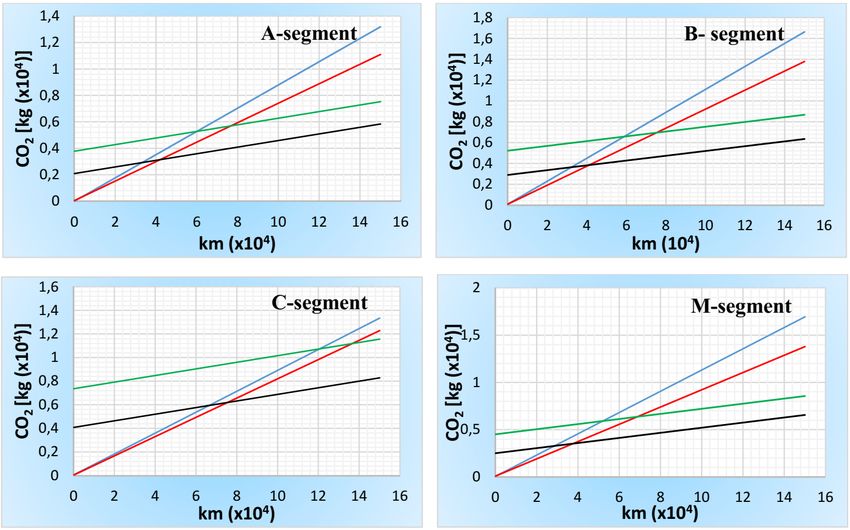
considered overestimated, as only the use-phase emissions (also known as “fuel cycle” or “tank-to-wheel” TTW emissions)
are taken into account. The latter are related to the vehicle’s utilization, depending on the model category (power, efficiency
and weight) [14], electric grid generation mix [15], electric grid emissions factor [16], ambient temperature [17], battery
degradation [18], driving patterns [19], charging patterns [20] and the many combinations of these factors [21-23]. In order
to have, in fact, a more complete picture of the global emissions, a “cradle-to-grave life cycle CO2 assessment” (referred to
the so called “production-phase emissions” or vehicle cycle emissions) should be carried out, so as performed by some
Authors [11, 24-27], since it takes into account the CO2 emissions, along with other pollutants, related to the construction of
the entire vehicle. In detail, this kind of analysis considers the emissions coming from materials extraction and
transformation, part manufacturing, vehicle assembly and disposal, especially those referred to battery life cycle and rare
earth materials adopted for some electric engines. Moreover, it considers other aspects affecting the amount of emissions
deriving from the electricity production. For example, it takes into account the grid energy mix, regional and temporal
variations, average vs. marginal emission factors, historic or projected factors, etc. [11] along with the evolution of future
grids and the typology of electricity production systems. These two latter are considered as crucial aspects toward a severe
reduction of carbon intensity [11, 26] and, therefore, towards the evaluation of the real advantage in adopting BEVs instead
of conventional ICEV or HEV vehicles in the future. However, they are taken into account only in few recent Papers [id.].
Another important issue about most of the current investigations regards the fact that, even though these comparisons are
made over important and detailed databases, the reported results are commonly presented as mean values referred to a single
category (such as gasoline cars and/or Diesel cars vs. electric cars [28]), inside which there is a large variety of vehicles,
each with different characteristics and mission (private, commercial, recreational, short range, long range, etc.). This kind of
approach determines, for each car segment, a mismatch between the mean emission rate and the effective advantage in the
adoption of a specific powertrain. In fact, these variances could be bigger or smaller in respect to the different usage
conditions (e.g. driving mission, global range, travelling distance per year, driving style, etc.), which heavily affect fuel
consumption and consequently CO2 emissions. Also, in order to outline a precise pattern in terms of emissions for a Country,
the analysis should consider only the most significant vehicle classes within the circulating park of the same territory.
Regarding the latter, in the Italian scenario segment A, B, C and M (respectively City Cars, Sub-compact, Compact and
Multi-Purpose Vehicles) represent more than 85% of the whole circulating park, while segment D and S (Sedans and SUV)
make up just 10% of the whole circulating park [29]. Therefore, only if the analysis were carried out in this way, it could be
possible to directly compare vehicles of the same segment and evaluate the real advantage in adopting a full electric
powertrain in place of a conventional ICE or HEV scheme.

2.    Methods
     The final aim of the Paper is to make a comparison between different powertrains (ICEV, HEV and BEV) with respect
to CO2 emissions (expected for 2035) calculated for each car segment (A, B, C and M), both in case of production of the
vehicle and of its subsequent road use in Italy. To achieve this result, five of the most up-to-date LCA analyses were taken
into consideration [11, 24-27], as they focused on the comparison between ICEVs, HEVs and BEVs as whole vehicles in
order to determine the so-called “cradle to grave” impact. In particular, within the research mentioned above, the production
phase related to battery systems was considered, as the emissions deriving from the sourcing of materials, from the
manufacture of the cells and from the compiling of the battery pack are those more significant and, therefore, most of interest
[30, 31]. With regard to the latter, it should be emphasized that the values reported are often not easily determined, as the car
Manufacturers do not always disclose detailed information on the production of batteries in their LCAs. In general, instead,
another aspect which could make the determination of the “cradle-to-grave” impact troublesome is that most of the available
data found in literature related to this topic are often quite incomparable among them, due to the partial transparency of the
values reported. For example, in fact, in the above cited surveys some fundamental data are often missing, such as the energy
needed for the mining and the refining of raw materials (and consequently their associated CO2 emissions), along with the
way scrap materials deriving from manufacturing are computed in terms of CO2 emissions. Nevertheless, the Authors tried
to find common elements among the considered research Papers with the final aim of determining a CO2 specific emission
value for batteries, the latter defined in terms of kgCO2/kWh. Subsequently, the LCA analyses taken into account, which
resulted strictly dependent on the methodology adopted and on the carbon intensity of the energy locally used, were evaluated
in light of the Italian specific energy supply chain with the aim of assessing the potential CO2 emissions related to the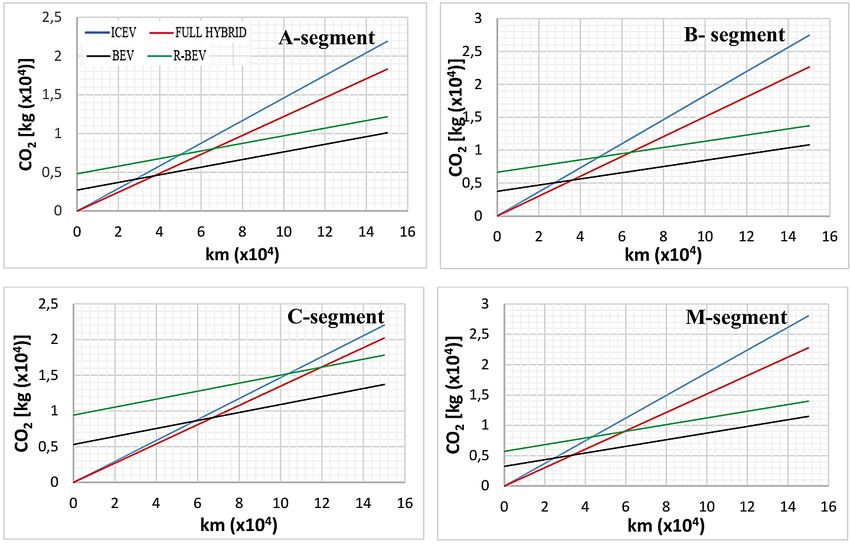
production of batteries if the latter were produced on the Italian territory. This aspect is considered as essential by the Authors,
as it takes into account the fundamental role of energy (in terms of amount, quality and related emissions) needed to
industrially produce battery packs. To achieve this result, a previously in-depth analysis of the current (2020) Italian carbon
intensity related to electricity production was carried out. After that, the carbon intensity value for 2035 was predicted, with
the latter calculated on the basis of the road map planned for Italy to meet the 2030 and 2035 “Fit for 55 package” goals [32]
(Green Revolution scenario). Then, a third energy carbon intensity related to a Business as Usual scenario for 2035 (BAU
2035) was calculated based on a lower growth rate of low-carbon energy production systems focused on a consolidated
historical data. Afterwards, these three carbon intensities related to the electricity production were adopted to calculate three
highly probable and reliable CO2 specific emission values for batteries, if the latter were produced in Italy, by carrying out
a critical evaluation of the results reported within the considered LCAs and taking into account a possible evolution both of
the manufacturing process and of the energy density of the batteries by 2035. At last, the 2035 battery carbon intensities were
applied to the most representative BEV and HEV cars of the current Italian market for the four most significant segments
(respectively, A, B, C and M) in terms of circulating park. For each vehicle considered, then, the specific battery carbon
intensity was multiplied for the capacity of the battery pack in order to determine the CO2 content related to the battery.
These emissions were then summed to the end-use phase emissions and plotted against the kilometers run by the car along
with the end-use phase emissions of ICEVs and HEVs, considering in the latter cases the sum of the two typologies of
emissions. In this way, for each vehicle category, it was possible to report the CO2 emissions and make a comparison between
the different powertrains. This analysis was based not only on the current consumption global data, which consider the
electric and/or thermal powertrain efficiencies, battery energy capacity, etc., but also by taking into account their development
up to 2035 in terms both of technical evolution and enhanced performances [33]. At the end, an ultimate correlation was
performed, by taking into account the introduction of a fuel with a lower carbon intensity (i.e., “LCF”, Low Carbon Fuel)
based on a mix of e-fuels and biofuels. This adoption could be feasible when renewable seasonal feedstock is available and/or
in case of curtailments when using electric renewable energy systems.

3. Results
3.1 Results from the considered LCA analyses (Materials production and refining phase)

     In this section are reported the description, some considerations and the results related to the five LCA analyses taken
into account within the Paper [11, 24-27]. The first considered investigation was the one carried out by Cox and Alii [24].
This work performed an LCA and cost comparison of current and future (2040) passenger cars under different energy
scenarios, with the latter created by means of the IMAGE Integrated Assessment Model. The results obtained were, then,
integrated into the Ecoinvent life cycle assessment background database and processed using Brightway-2 software in order
to understand both the effects of carbon intensity of the energy adopted in the end-use phase of the vehicle and the way cars
and batteries were produced (cradle-to-grave approach). As regards the energy carbon intensity, Cox and his group reported
three scenarios, with the first one based on the current European market and the corresponding production scheme. Instead,
the other two scenarios were referred to: 1) a forecasted baseline energy set-up, also known as Business As Usual (BAU),
which is characterized by a consolidated growth rate of low-carbon energy production systems; 2) a more stringent climate
Policy setup, based on ClimPol estimates, aimed at keeping temperature below the 2°C climate target. Moreover, in the
investigation, it was underlined that there is still a great uncertainty regarding the actual specific amount of energy required
to produce the batteries, as it depends not only on the energy mix, but also on many boundary conditions (factory dimensions
and efficiency, local climate, etc.). Also, the share of heat supplied to the whole industrial process (electricity vs. natural gas)
is also uncertain, thus making the actual carbon intensity of the production phase very hard to be determined. Furthermore,
there is an even more significant uncertainty regarding material supply chains, as most of the inventory data related to them
clearly showed that they represent the 70% of the whole impact on climate change [35]. This means that the GHG emission
reduction potential using renewables for energy supply in battery cell manufacturing, as announced by many battery makers,
is relatively limited, while the improvements regarding specific energy density for the future result much more significant.
Ultimately, the work stated that, by considering a mean energy carbon intensity of around 460 gCO 2/kWh for the European
Union, a battery carbon intensity value of around 100 kg CO 2/kWh could be considered as reliable by 2020, one of 35 kg

                                                              146-3
CO2/kWh could be predicted for 2040 in case of BAU Scenario and an even more exceptional value of 30 kg CO2/kWh could
be achieved in case of low carbon intensity energy supply for mass production. Another significant LCA related to vehicles
is the one proposed by Woody et Alii [11], which considered the role of some specific electric vehicles (i.e. midsize sedan
and SUV, full-size sedan and SUV, pickup and light truck) in the decarbonisation of the private transportation sector in the
United States. In this study the key parameters of each vehicle were calculated by means of Autonomie simulation model
and then processed through the GREET-2 model by Argonne National Laboratory in order to finally evaluate the LCA
“cradle-to-grave” impact of the vehicle in terms of materials, manufacturing and end-of-life phase emissions. As regards the
energy carbon intensity, even in this investigation, three different scenarios were taken into account. The first was a reference
scenario BAU (Business as Usual, also referred as “Mid Case”), which included policies in place as of June 2020 with no
planned policy changes and leading to a grid with a 50% lower carbon intensity by 2035 (if compared to 2005 level). The
other two scenarios, instead, considered two additional forecasts based on NREL “Cambium” estimates. The first one
considered a 95% decarbonisation by 2050 (compared to 2005), while the second one considered an even more stringent
95% decarbonisation by 2035. For both of the last two cases, a final carbon intensity of about 50 gCO2/kWh was intended.
This value would be a very ambitious result to be obtained, considering the current situation. The Mid Case scenario was
introduced in the end-use phase calculation starting from a value of around 500 gCO2/kWh in 2020 and up to a value of
around 300 gCO2/kWh by 2035. Regarding the carbon intensity adopted for the calculation of vehicle cycle phase, it was
reported that only models-year 2020 were considered, so that the related battery carbon emissions were calculated in respect
to a declared value of 500 gCO2/kWh. As regards the carbon intensity of the whole battery production, instead, no information
was provided regarding CO2 emissions and global impact in respect to mining and refining of raw materials and no
information could be obtained regarding the carbon intensity used for battery material production and assembly. However,
despite of these limitations, a mean value of about 95 kgCO2/kWh has been extracted by the Authors of this Paper from the
data provided, after an accurate cross-checking of the latter with other documents. This value is well below most of those
reported in the literature of 2017 [34] and can be justified both by the already mentioned technical and energetic
improvements in the manufacturing phase and by a higher forecasted specific energy capacity of the single battery element.
Moreover, it must be considered also the important role of LCA Model (GREET-2), which does not consider the CO2
emissions from material ending-up as scrap in the manufacturing process, thus determining a lower global emission rate
often not comparable to that one of other investigations. Also, no reference was added regarding the mining and refining
phase of raw materials used for battery construction, this making the final CO2 specific emission quite incomplete in terms
of real environmental impact. A third significant research expressly devoted to battery LCA is the one proposed by IVL (in
cooperation with the Swedish Energy Agency) [27] which dealt with the current status (2019) on energy use, CO2 emissions,
use of metals, products environmental footprint and recycling applied to the most common lithium batteries. This report is
an update of the previous one published in 2017 [34] and it took into account new data resulting from more recent Papers,
investigations and reports, such as the ones performed by Argonne National Laboratory (GREET LCA Simulation) and the
European Commission (PEFCR rules; Ecodesign and energy Labelling – rules and requirements). The report concluded that
a range of battery carbon intensity values between 61-106 kgCO2/kWh could be considered as reliable for the most common
types of batteries (based on NMC chemistry) when starting from virgin materials. In detail, the difference in the range
depends mainly on the variation of the electricity mix for cell production, with the lowest value in case of a quite complete
decarbonisation in the electricity production (
grid CO2 emissions (wind powered only with 15 gCO2/kWh) and 156 kgCO2/kWh in case of very high CO2 emissions (coal
powerplants only with a carbon intensity of 1180 gCO2/kWh, defined in the Paper as “Chinese electricity”). The range led
to a value of about 92 kgCO2/kWh of battery capacity when referred to a European mean carbon intensity (declared as of
522 gCO2/kWh and being significantly different from the one previously reported [24]). Even in this case, the LCA was
performed starting from virgin materials, despite not considering the contribution of CO2 emissions from base materials
production and refining phase. Also, it is not clear if the production of the material ending up as scrap in the manufacturing
was included in the vehicle carbon footprint. Also, the Paper underlined the extreme importance of adopting electricity for
both manufacturing and final end-use to achieve a real advantage in terms of reduction of CO2 emissions, furthermore
emphasizing that the EU CO2 reduction target might not be achieved by electric vehicles if the current life-cycle impact of
the batteries (most of them produced in China) would not be reduced. At last, the Authors considered the research developed
by Volvo Cars [25], which committed to only sell full electric cars by 2030 and which performed a detailed LCA of electric
cars and batteries. The study is the most up-to-date among the previously ones considered by the Authors and included the
vehicle life-cycle assessment from “cradle-to-grave”, starting from extraction and refining of raw materials and ending with
the end-of-life of the vehicle. In detail, Volvo Cars purchased modules from CATL and LG Chem industries, with which they
performed jointly a cradle-to-gate carbon footprint LCA of their batteries. System expansion were not applied in this study,
so that no credits were given for recycled materials (so offsetting other material production) or for energy generated in waste
incineration (so offsetting other energy production). The Report concluded that an estimate of about 95 kgCO2/kWh of battery
capacity could be a reliable value for most of NMC chemistry, with the manufacturing calculated from virgin materials. This
higher carbon footprint of both vehicle and battery (when compared to the above mentioned studies) was due to the fact that
the production of the material ending up as scrap in the manufacturing process was included in the vehicle carbon footprint,
even though the scrap was sent to recycling and used in other products. It must be noticed that Volvo Researchers took into
account the variation in carbon intensity of the electricity supply just for the calculation of the end-use phase, while
considering, instead, battery production carbon intensity quite constant, as probably assuming the current production to take
place only in a Country at a local fixed emission rate. As declared before, it must also be underlined that this is the only
investigation which considers another significant CO2 contribution within the global carbon intensity value related to battery
production, i.e. the one coming from base materials production and refining phase. This aspect accounts for nearly 30% of
the base materials production and refining of the whole car. Therefore, an additional extra contribution of 65 kgCO 2/kWh
related to carbon intensity for battery production should be added to the 95 kgCO2/kWh previously mentioned. In this way,
a total carbon intensity of 160 kgCO2/kWh of battery is reached, this representing a very high value to be recovered for
achieving parity between ICEVs and BEVs. On the other hand, in the Paper it was underlined the fact that the metal
production datasets that were deployed in the calculations were just average data, so a further investigation is needed to
assess to what extent the metal used in batteries differs from that one of the supply network of other competitors. Also, a
sensitivity analysis performed in this LCA showed that, if data related to some of the material productions (especially
aluminium) were referred to the European scenario instead of the global one, a significant reduction in carbon footprint was
achieved; this last aspect is an indication of how important sourcing of materials with low carbon footprint is. Furthermore,
as stated before, in this Paper all data have been recollected by the Authors and compared in order to determine a mean
specific CO2 emission value related to the production of the batteries in 2020, to be used, in turn, as starting value for defining
a reliable value of battery carbon intensity for 2035 based on the future grid carbon intensity and on the battery evolution.
The only Paper which estimates a global carbon intensity for battery for the future (2040) is the one of Cox et Alii [24]; in
this case, if a linear improvement in energy density is applied, a final value of 50 kgCO2/kWh could be considered as pertinent
for 2035. However, it must be underlined that this specific forecasted value is based on a nearly doubled specific energy
capacity of the single battery element, if compared to current (2022) energy density. A lesser influence is ascribed to the
enhancements in the manufacturing phase derived from a lower carbon intensity of the energy adopted. This aspect can be
object of discussion, being the claimed value for energy density not so far from the theoretical limit for this kind of chemicals.
Moreover, this expectative is quite unwarranted, as the average improvements of the last five years (2017-2022) have
followed a much lesser slope which cannot match anyway the doubling of the energy density forecasted for 2040. As regards
the other considered Papers, any prevision regarding battery energy density was not made, maybe because very significant
improvements are not expected in this specific field. On the contrary, IVL and Helmers underlined the strict dependency on

                                                              146-5
the energy carbon intensity adopted for manufacturing as the main way to reduce the specific battery impact over the
environment. It must be underlined, then, that, in most of considered Papers, it is still unclear if the production of material
ending up as scrap in the manufacturing is included in the vehicle carbon footprint. This latter aspect (considered only by
Volvo [25]) is important because it can make the global impact significantly higher (15 gCO 2/ kWh more). Moreover, the
Paper by Volvo cars also underlines that, in order to take into account of the whole impact of batteries, the one coming from
base materials production and refining phase must be taken into account. This aspect was not clearly considered in the other
above mentioned analyses and it accounts for nearly 50% of the whole vehicle’s impact. In the following Table 1, all the
recollected values have been reported.
Authors Battery specific CO2 Battery specific CO2 Mining and Refining Equivalent emission from
emissions (2020 mix) emissions (2035 mix) emissions scrap materials
Cox et Alii 100 kgCO2/kWh 50 kgCO2/kWh Not considered +15 kgCO2/kWh
Woody et Alii 90 kgCO2/kWh Not forecasted Not considered + 15 kgCO2/kWh
IVL 80 kgCO2/kWh Not forecasted Not considered +15 kgCO2/kWh
Helmers et Alii 90 kgCO2/kWh Not forecasted Not considered +15 kgCO2/kWh
Volvo 95 kgCO2/kWh Not forecasted +65 kgCO2/kWh Considered
Table 1 Recollected values from the five [11, 24-27] considered Papers
After some calculation, the specific mean value related to battery manufacturing can be fixed at 87 kgCO2/kWh when
the current average EU carbon intensity (i.e. around 340 gCO2/kWh [34,35]) is applied. As regards the Italian scenario, a
similar value of 85 kgCO2/kWh can be considered, due to an almost complete coincidence of the Italian carbon intensity
(i.e. around 360 gCO2/kWh) in respect to the EU value [id.]. However, the latter value does not take into account the mining
and refining emissions or the equivalent emissions from the recycling of scrap materials, which are assumed to account to
about 65 kgCO2/kWh, as evaluated by the LCA performed by Volvo Cars. Therefore, a forecasted reliable carbon intensity
of electricity for Italy at 2035 should be calculated in order to evaluate the real impact of the battery manufacturing.
3.2 The Italian energy scenario
To define the carbon intensity of the Italian grid electricity production by 2035, some forecasts have been made on the
electricity generation mix and, in particular, on the potential capacity of variable renewable energy sources, by starting from
2020 values and accomplishing the requirements imposed by the EC within the “Fit for 55 package” [32]. The latter is an
implementation package of the “Green Deal” policy and it was introduced in order to revise and update EU legislation with
the aim of ensuring that EU policies were in line with the climate goals agreed within the “Green Deal” by the Council and
the European Parliament [id.]. In detail, it introduced many legislative proposals and policy initiatives to be achieved by
2030 and 2035, e.g.: 1) a proposal to increase the current EU-level target for energy efficiency from 32.5% to 36% for final
energy consumption and 39% for primary energy consumption (compared to 1990 levels); 2) a proposal to increase the EU-
level greenhouse gas emissions reduction target from 29% to 40% (compared with 2005 levels) or up to 55% (compared
with 1990 levels); 3) a proposal to increase the current EU-level target of at least 32% of renewable energy sources in the
overall energy mix (expressed in terms of total final gross energy consumption) to at least 40% (compared to 1990 levels)
by 2030 along with sub-targets focused on sectors where progress with integrating renewables has been slower to date, such
as the fields of transport, buildings and industry; 4) a proposal to create a new self-standing emissions trading system (ETS)
for buildings and road transport so as to achieve emissions reductions of 43% for these sectors by 2030 (compared to 2005
levels) and, for cars and vans, of 100% by 2035. In order to achieve the targets above listed for the Italian energy panorama,
a previous reduction of the energy demand would be needed from the actual 1426 TWh to the 830 TWh by 2030. Afterwards,
an increase in the deployment of variable renewable energy sources from 18.2% and up to a value of 40% in the overall
energy mix would be necessary, both for the decarbonisation of the electricity sector and of the transport one. As a
consequence, the renewable energy content related to the final energy demand would rise up from the current value of 223
TWh to 332 TWh forecasted for 2030 while the renewable energy content related to the final electricity demand would pass
from the current 116 TWh (48 TWh hydro, 20 TWh wind, 23 TWh solar PV, 25 TWh biomass and geothermal) to 211 TWh
forecasted for 2030 (50 TWh hydro, 63 TWh wind, 81 TWh solar PV, 25 TWh biomass and geothermal), with an increase ofpotential capacity of variable renewable energy sources from the actual 33 GW to 93 GW by 2030 [36]. These results were
reported by TSO Terna in “Renewable Evolution, 2021” [id.] and substantially confirmed by the Institute of Sustainable
Future (ISF) of the University of Technology of Sydney (UTS) in the “Energy [R]evolution” scenario within the report
“100% Renewable Energy: An energy [R]evolution for Italy” [37]. Afterwards, in order to forecast the energy situation by
2035, a reduction rate of the total final energy consumption and a growth rate of variable renewable energy sources were
assumed to be in line with the one considered for the period 2020-2030. This methodology led to a further increase in
potential capacity of variable renewable energy sources equal to 30 GW, therefore to determine, through extrapolation, a
total amount of 123 GW (190 TWh). The latter is a feasible value to be achieved, above all because it is coherent with the
actual requests for connection to the national grid in high voltage (HV), which regard only variable renewable energy sources
(wind and solar PV) and amount to 94 GW [36]. By summing up, in fact, the latter with the actual 33 GW of variable
renewable energy sources already installed, a capacity of 124 GW would be achieved (1 GW more than the previously
calculated one). Therefore, if this potential were exploited, 191 TWh of electricity from variable renewable energy sources
would be supplied, while the total amount of electricity from renewable energy sources available to the grid (hydro, biomass
and geothermal included) would be 266 TWh. The latter calculated value could be considered as the maximum amount of
electricity produced through the deployment of renewable energy sources in a feasible way. Above it, in fact, expensive
energy storage systems would be needed to ensure the full use of energy without significant curtailment [37, 38]. Moreover,
if these results were confirmed and the median published life cycle emissions factors for electricity generation technologies
provided by NREL were taken into account [39], the 2035 energy mix would have a carbon intensity of 152 gCO2/kWh, as
the renewable energy sources would supply the 75% of the electricity demand. The remaining one, in fact, would be fulfilled
only by natural gas deployment in CCGT powerplants. Instead, in case of BAU Scenario, characterised by a very low rate of
new renewable installed systems, only 12 GW of power would be fitted (respectively, 8 GW of PV and 4 of wind power),
with only 17 TWh of more renewable electricity available. This would lead to a final value in energy mix of 305 gCO2/kWh,
i.e. quite the double of the previously calculated one referred to the Green Revolution Scenario. In the following Fig.1 the
two trends (BAU and Green revolution) have been reported.
140
120
100
80
60
40
20
0
2015 2020 2025 2030 2035 2040
BAU Renewables Green Revolution Renewables
Fig.1 Installed capacity [GW] of renewables energy systems in Green Revolution scenario and in BAU scenario
146-73.3 CO2 emissions from the vehicle use-phase
As well known, the use phase emissions of any vehicle are determined by two factors: 1) the carbon intensity of its
energy source and 2) the vehicle efficiency. As regards the efficiency, Authors did not consider models such as Autonomie
[33], which simulates vehicle energy consumption for different vehicle segments nor WLTP homologation assessments,
which are quite far from the vehicle real-world fuel needs (to a high of around 15%). In fact, the Authors chose only statistic
documented records regarding fuel need for each considered model, such as the consumer website SpritMonitor [40]. Instead,
as regards the carbon intensity of the energy sources adopted in the conventional ICEVs and HEVs, the JEC’s well-to-wheel
CO2-equivalent emissions data [41] were considered as first. JEC Consortium is a long-standing research collaboration
among the JRC (Joint Research Center of European Commission), EUCAR (European Council for Automotive R&D) and
CONCAWE (CONservation of Clean Air and Water in Europe) and it represents a source available regarding the carbon
intensity data. According to this research centre, just for gasoline fuel, the global value of the well-to-wheel CO2 emissions
is 2780 gCO2/dm3, with a well-to-tank of 460 gCO2/dm3 and a tank-to wheel of 2320 gCO2/dm3. Then, a second reliable
source was considered (Argonne GREET-1 emission database [42]), which provided a well-to-wheel carbon intensity of
2820 gCO2/dm3, with a well-to-tank of about 480 gCO2/dm3 and a tank-to-wheel of 2340 gCO2/dm3. Therefore, by taking
into account both of the previous sources, an average well-to-wheel carbon intensity of 2800 gCO2/dm3 with a well-to-tank
of 470 gCO2/dm3 and a tank-to wheel of 2330 gCO2/dm3 was finally considered. However, it must pointed-out that a carbon
intensity value for ICEVs and HEVs closer to real conditions could be obtained if considering the well-to-tank efficiency. In
this case, the CO2 emissions related to vehicle fuel consumption (tank to wheel) should be multiplied by the “well-to-tank
factor” (i.e. the ratio between the well-to-wheel and the tank-to-wheel), which is around 1,20. Moreover, the Authors
considered also the adoption of a LCF fuel (a blend of synthetic e-fuels and biofuels) by 2035, with a percentage of about
60% in gasoline blends [43] and a global emission rate of about 1700 gCO2/dm3 [44]. The possibility of adopting a large
scale production of these fuels has been considered feasible by some researches [45], owing to the large amount of renewable
energy and the low cost of the same especially during potential curtailments by the grid. As regards the BEVs well-to-wheel
(better defined as “powerplant-to-wheel”), the Authors considered the Italian emission factor for 2020 and the probable
carbon intensity for energy grid calculated at 2035. Also, a global charging efficiency of 86% was computed, the latter being
considered as a “well-to-tank” efficiency by taking into account the average grid efficiency from powerplants-to-battery. At
the same time, the vehicle medium energy consumption in terms of km/kWh (“battery to wheel”) could be considered as a
tank-to-wheel efficiency. So, to calculate the well-to-wheel efficiency for BEVs, the battery-to-wheel vehicle electricity
consumption should be multiplied by a factor of around 1,17, as the latter corresponds to the ratio between powerplant-to-
wheel and battery-to-wheel. This factor, indicated as “powerplant-to-battery factor”, would lead to the global carbon intensity
value when using grid electricity. As regards the vehicles taken into account in the present investigation, the most
representative car categories in the Italian market were chosen. As already stated before, A-, B-, C- and M-segments represent
nearly the 85% of the whole circulating park [7, 29]. After a market inquiry, some model year 2022 vehicles were
individuated, manufactured respectively by FCA, Jeep, Peugeot, Renault, Volkswagen and Toyota. As first, for each model,
statistic records regarding fuel needs were obtained from SpritMonitor [40], which reported the mean fuel consumption
(average tank-to-wheel consumption) expressed in terms of km/dm3 of gasoline, in case of ICEVs and HEVs, or in terms of
km/kWh of electricity, in case of BEVs. In the latter case, the Italian carbon intensity by 2020 was considered. Moreover, as
regards the carbon intensity related to batteries, two different values of CO2 were considered: 1) a base value of 85
kgCO2/kWh related to battery production associated to the current Italian carbon intensity (i.e. 360 gCO2/kWh); 2) an extra
value, to be added to the first one, which considers also the emission deriving from mining and refining of materials (from
ore or brine) and accounting for about 65 kgCO2/kWh, as calculated by Volvo results [25]. This aspect is fundamental as the
materials to be used in the production of the batteries must have a very high purity grade (A-grade materials) and, therefore,
must be obtained only through a process of extraction and subsequent refinement. In fact, material recycling cannot be
considered until 2035, due to the very marginal role it will have for a very long time to come when referred to the battery
growing market. In turn, the battery electric vehicles which took into account only the first battery carbon intensity value
were defined as BEVs, while those which took into account the first value summed to the extra value were defined as R-
BEVs (i.e. as Real-BEVs), so as to underline the full CO2 impact related to battery production.ICEV/ Manufacturer Tank-to-Wheel Well-to-Wheel CO2 Battery Battery carbon
Mild Hybrid car model efficiency emissions Capacity Intensity
Car segment (km/dm3) (gCO2/km) (kWh) (kgCO2/kWh)
A FCA Panda 17,5 160 0,13 11 (+9)
B Renault Clio-ICE 13,9 201 // //
C FCA 500 X 17,4 161 0,80 68 (+52)
M Jeep Renegade 13,6 206 0,80 68 (+52)
Full Hybrid
Car segment
A Toyota Yaris 20,8 135 0,75 64 (+49)
B Renault Capture 16,8 167 1,20 102 (+78)
C Toyota Corolla 18,9 148 0,75 64 (+49)
M Renault Arkana 16,7 168 1,20 102 (+78)
BEV Manufacturer Battery to wheel Powerplant-to-Wheel Battery Battery carbon
Car segment car model efficiency CO2 emissions Capacity Intensity
(km/kWh) (gCO2/km) (kWh) (kgCO2/kWh)
A FCA 500 5,63 64 42 3570 (+2730)
B Renault Zoe 5,91 61 58 4930 (+3770)
C VW ID3 4,95 73 82 7310 (+5330)
M Peugeot 2008 5,02 72 50 4250 (+3250)
Table 2 Current 2020 emissions for ICEVs, HEVs and BEVs for 4 different segments
In order to make some forecasts for 2035, the above mentioned vehicles were again considered, although with upgraded
performances in terms of better global efficiency (about +10%). Then, three different energy scenarios were taken into
account, listed as following:
1) BAU scenario, which implies a carbon intensity of 305 gCO2/kWh for electricity production and a battery carbon
intensity of about 65 kgCO2/kWh, with the latter deriving mostly from an enhancement in terms of energy density
(+20%) and an extra value of 50 kgCO2/kWh for mining and refining of materials, the latter considering as well an
enhanced efficiency of the whole processes in producing pure materials (A-grade) for battery production;
2) Green Revolution scenario, which implies a carbon intensity of 152 gCO2/kWh for electricity production and a
battery carbon intensity of about 50 kgCO2/kWh, with the latter deriving from both an enhancement of energy
density (+20%) and an optimized manufacturing cycle. An extra value of 40 kgCO2/kWh for mining and refining of
materials is also taken into account, the latter considering an enhanced efficiency of the whole processes in producing
pure materials (A-grade) for battery production and the lower carbon intensity of the electricity used;
3) Electric and Fuel Green Revolution scenario (LCF scenario), which is characterized by the same grid and battery
carbon intensities of the Green Revolution scenario and which considers the adoption of a LCF fuel, a blend of
biofuels and e-fuels, with an average specific carbon intensity of about 1700 gCO2/dm3.
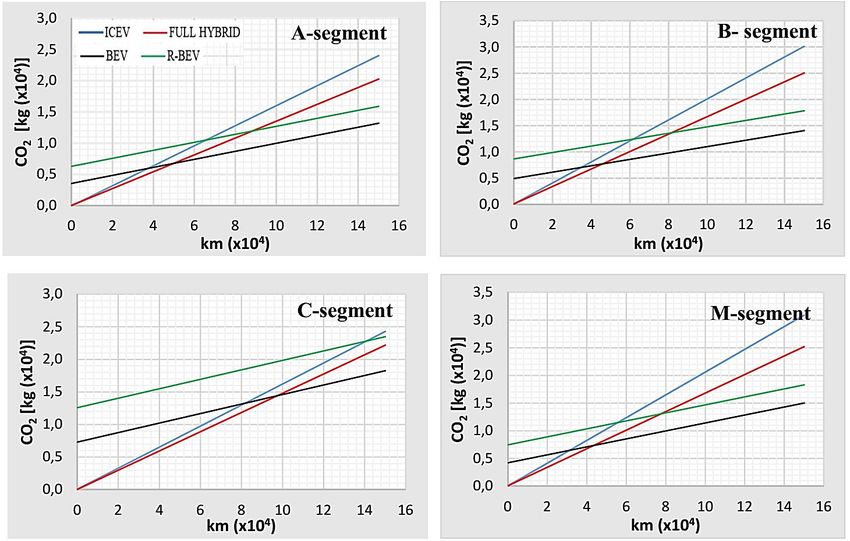
In the following Fig.2, 3, 4, 5, the current 2020 scenario along with the three 2035 scenarios referred to the four different
car segments are reported, each of them characterized by three different powertrains (ICEV, HEV, BEV) and a fourth line
referred to battery-related full CO2 impact for BEVs (R-BEV). There, the break-even points regarding the different
powertrains can be easily determined. At the same time, it can be easily seen that most of them occur for noteworthy mileage,
which result to be higher than most of the above mentioned Papers, especially when considering R-BEVs. This aspect can
be also justified by the fact that only statistic documented records regarding fuel consumption were taken into account
together with feasible carbon intensities of the local grid.
146-9Fig. 2 Total CO2 production in case of 2020 grid carbon intensity Fig. 3 Total CO2 production in case of 2035 BAU grid carbon intensity
Fig. 4 Total CO2 production in case of 2035 “Green Revolution” grid carbon intensity

Fig. 5 Total CO2 production in case of 2035 “Green Revolution” grid carbon intensity and LCF

                                          146-11
4 Discussion
The obtained results show the capability of BEVs to reduce GHG emissions in most cases within the Italian context,
although these advantages are much lower than expected, when compared to results of other Papers. Most of these works,
indeed, consider different future energy scenarios in Countries characterized by much lower carbon intensities related to
electricity generation (mostly based on renewables and nuclear powerplants) and a much lower carbon intensity related to
battery manufacturing process. As regards the first aspect, the roadmap leading to the reduction of GHG emissions related
to electricity generation in Italy is still quite unclear, due to a still very low trend in installing renewable energy systems, thus
making it very difficult to reach the “Fit for 55” milestone set for 2030. For this reason, the global emissions related to both
battery manufacturing and use-phase of BEVs are still quite high when compared to other Countries, thus making the
convenience of adopting these systems quite limited. The second aspect is that most Papers underestimate the full CO 2
emission content related to the whole battery manufacturing process, the latter not fully considering mining and refining of
materials. Moreover, the aspect regarding the still high battery-related global CO2 emissions is even more critical when
considering the real trend of battery energy density, which is nowadays characterized by much lower improvements than in
the past. In addition to that, the Authors clearly showed that the real advantages in BEVs adoption are deeply reduced when
a larger battery capacity is needed as a higher mileage is required by Customers. For example, in case of C-segment vehicle,
the Break-Even Point is reached at a quite high mileage, the latter not so far from the end of life calculated for the same car
(violet dotted lines in the previous Figures 2-5). Indeed, real consumption data showed that, even with cars provided with
large battery systems, the effective mileage can be hardly the half of ICEV or HEV vehicles. This aspect is still considered
crucial by Customers, making the trend to bigger batteries quite ineludibly and involving a higher global CO2 production
related to vehicle manufacturing.
Referring to the different scenarios defined for the future, BAU forecast would lead to a quite limited advantage in terms
of total CO2 emissions reduction extended to the whole life of the vehicle (and consequent energy savings), due to the still
high carbon intensity of electricity. On the contrary, the “Green Revolution” scenario would determine sensibly lower CO2
emissions, although it seems still far to be achievable because of the above mentioned critical aspects. Indeed, if this forecast
could be feasible, at the same time it could be viable the adoption of LCF as a way to achieve an energy storage (through e-
fuels) under the unavoidable curtailment conditions typical of large scale renewable energy systems. This could lead to an
availability of a low-carbon intensity energy source and to an important CO2 reduction for ICEVs and HEVs, thus making
again BEVs adoption less interesting for the market in the next future. All these aspects, together with the still high cost of
BEVs owing to battery and powertrain production (e.g. rare earth materials for motors/generators), make the potential of
vehicle electrification very hard to reach in terms of circulating park. This would imply a very limited impact on the global
CO2 emissions of the entire Country by 2035, thus making unworthy the significant economical efforts to prepare adequate
infrastructures for vehicles recharging.
4. Conclusion
In the present Paper the results have outlined some advantages related to BEVs use, although these effects are quite
limited when vehicles with a higher running range are required by Customers (e.g. in the case of C-segment). The issues
related to BEVs global CO2 emissions seems not to clearly change in the future (up to 2035 and later) even when a higher
availability of renewable energy will be reached. Indeed, the relative Italian scenario is still not clearly defined, with an
uncertain forecasted drop in the grid electricity carbon intensity. This aspect, together with the difficulties related to raw
materials availability, makes battery and vehicle production quite critical in the Country, both in terms of economic (energy
cost) and environmental (CO2 emissions) convenience. Other Countries, in fact, with different energy mix if compared to
Italy (i.e. with a nuclear base production and wind renewables) can boast a much lower carbon intensity without the need of
huge and extremely costly energy storage systems, as being considered as much better industrial environments to produce
batteries. For Italy, higher energy CO2 emissions would also imply a very limited weight on the reduction of global produced
CO2 emissions by 2035, probably making unworthy the huge economical efforts to prepare adequate infrastructures for
vehicles recharging. Since this revolution could profoundly affect the current automotive industry within the Italian
production landscape, policymakers should carefully move towards a too rapid electrification roadmap, which could
seriously damage the significance of the car industry and which would require major infrastructure investments without
yielding substantial results in terms of CO2 reduction. For all the above mentioned reasons the phase-out of thermal enginesshould be postposed to the achievement of a real reduction in CO2 energy emissions, making battery production and end-use
phase really convenient from both economic and environmental sides. This probably long transformation could be coupled
with the adoption of a new generation Plug-In hybrid vehicles (PHEVs) provided with some innovative internal combustion
engines. The same vehicle concept could fully take advantage from electrification while implementing other partially
renewable sources (such as LCF) without being involved by collateral issues like range anxiety.
References
[1] A.F.N. Abdul-Manan, V.G. Zavaleta, A.K. Agarwal, G. Kalghatgi, A.A. Amer., “Electrifying passenger road
transport in India requires near-term electricity grid decarbonisation”. Nat Commun 13, 2022, 2095.
https://doi.org/10.1038/s41467-022-29620-x
[2] S. McBain and J. Teter, “Tracking transport, 2021” IEA [Online]. Available: https://www.iea.org/reports/tracking-
transport-2021
[3] Data browser, International Energy Agency (IEA), 2022 [Online]. Available: https://www.iea.org/countries/italy
[4] IEA, “Clean Energy Innovation”, 2020, [Online]. Available:https://www.iea.org/reports/clean-energy-
innovation
[5] D. Kodjak, “A Strategy to decarbonize the global transport sector by 2050, explained.” ICCT – The international
council on clean transportation. https://theicct.org/a-strategy-to-decarbonize-the-global-transport-sector-by-2050-
explained/ (access 01 march 2022)
[6] The European Automobile Manufacturers’ Association (ACEA), “Vehicles in use, Europe, January 2021”, 2021
[Online]. Available: https://www.acea.auto/files/report-vehicles-in-use-europe-january-2021-1.pdf
[7] VGI, “Smart mobility Report 2021: il punto sulla mobilità elettrica”, Modo Volkswagen group,
https://modo.volkswagengroup.it/it/q-life/smart-mobility-report-2021-il-punto-sulla-mobilita-elettrica (accessed 01
May 2022)
[8] P. Chakraborty, R. Parker, T. Hoque, J. Cruz, L. Du, S. Wang, S. Bhunia, “Addressing the range anxiety of battery
electric vehicles with charging en route”, Sci. Rep., 12, 2022, 5588, https://doi.org/10.1038/s41598-022-08942-2
[9] E. Barozza, “The e-mobility in Italy: strategic analysis of the electric vehicles market”, M.S.thesis, School of
industrial and information engineering, Politecnico di Milano, Milano, Italy, 2017. [Online]. Available:
https://www.politesi.polimi.it/bitstream/10589/133678/3/2017_04_Barozza.pdf
[10] M. Nicholas and S. Wappelhorst, “ Preparing Italy's charging infrastructure for rapid vehicle electrification”, ICCT,
2022 [Online]. Available: https://theicct.org/wp-content/uploads/2022/03/Italy-working-Paper-16-A4-v3.pdf
[11] M. Woody, P. Vaishan, G.A. Keoleian, R. De Kleine, H.C. Kim, J.E. Anderson, T.J. Wallington, “The role
of pickup truck electrification in the decarbonization of light-duty vehicles”. Environ. Res.Lett., 17(3), 2022, 034031.
https://doi.org/10.1088/1748-9326/ac5142
[12] The European Automobile Manufacturers’ Association (ACEA), “Fuel types of new cars: battery electric 9.1%,
hybrid 19.6% and petrol 40.0% market share full-year 2021”, 2022, [Online], Available:
https://www.acea.auto/files/20220202_PRPC-fuel_Q4-2021_FINAL.pdf
[13] X. Xia and P. Li, “A review of the Life cycle Assessment of electric vehicles: Considering the influence of
batteries”, Science of total environment, 814, 2022, 152870. https://doi.org/10.1016/j.scitotenv.2021.152870
[14] L.A.W. Ellingsen, B. Singh, A.H. Strømman “The size and range effect: life-cycle greenhouse gas emissions
of electric vehicles” Environ. Res. Lett. 11, 2016, 054010. https://doi.org/10.1088/1748-9326/11/5/054010
[15] J.R.Woo, H. Choi, J. Ahn. “Well-to-wheel analysis of greenhouse gas emissions for electric vehicles based
on electricity generation mix: a global perspective” Transp. Res. D 51, 2017, 340–50.
https://doi.org/10.1016/j.trd.2017.01.005
[16] M.A.M. Tamayao, J.J. Michalek, C. Hendrickson, I.M.L. Azevedo. “Regional variability and uncertainty of
electric vehicle life cycle CO2 emissions across the United States” Environ. Sci. Technol. 49 2015 8844–55.
https://doi.org/10.1021/acs.est.5b00815
[17] T. Yuksel and J.J. Michalek, “Effects of regional temperature on electric vehicle efficiency, range, and emissions
146-13in the United States” Environ. Sci. Technol.49 2015 3974–80 https://doi.org/10.1021/es505621s
[18] F. Yang, Y. Xie, Y. Deng, C.Yuan “Predictive modeling of battery degradation and greenhouse gas emissions
from U.S. state-level electric vehicle operation” Nat. Commun. 9 2018 1–10.
https://doi.org/10.1038/s41467-018- 04826-0
[19] O. Karabasoglu, J. Michalek. “Influence of driving patterns on life cycle cost and emissions of hybrid and
plug-in electric vehicle powertrains” Energy Policy 60 2013 445–61https://doi.org/10.1016/j.enpol.2013.03.047
[20] I. Miller, M. Arbabzadeh, E. Gençer “Hourly power grid variations, electric vehicle charging patterns, and
operating emissions” Environ. Sci. Technol. 54 2020 16071–85. https://doi.org/10.1021/acs.est.0c02312
[21] T. Yuksel, M.A.M. Tamayao, C. Hendrickson, I.M.L. Azevedo and J.J. Michalek. “Effect of regional grid mix,
driving patterns and climate on the comparative carbon footprint of gasoline and plug-in electric vehicles in the
United States” Environ. Res. Lett. 11, 2016, 044007. https://doi.org/10.1088/1748-9326/11/4/044007
[22] D. Wu, F. Guo, F.R. Field, R.D. De Kleine, Kim H C, T.J. Wallington, R.E. Kirchain. “Regional heterogeneity
in the emissions benefits of electrified and lightweighted light-duty vehicles” Environ. Sci. Technol. 53, 2019,
10560– 70. https://doi.org/10.1021/acs.est.9b00648
[23] J. Woo, H. Choi, J. Ahn. “Well-to-wheel analysis of greenhouse gas emissions for electric vehicles based
on electricity generation mix: A global perspective”. Transp. Res. Part D: Transport and Environment,
51, 2017, 340- 350. https://doi.org/10.1016/j.trd.2017.01.005
[24] B. Cox, C. Bauer, A. M. Beltran, D.P. van Vuuren, C.L. Mutel,“Life cycle environmental and cost comparison of
current and future passenger cars under different energy scenarios”. Applied Energy, 269, 2020, 115021.
https://doi.org/10.1016/j.apenergy.2020.115021
[25] E. Evrard, J. Davis, K.-H. Hagdahl, R. Palm, J. Lindholm, L.Dahllöf, “Carbon footprint report – Volvo C40
Recharge”, Volvo Cars & IVL [Online]. Available: https://www.volvocars.com/images/v/-/media/market-
assets/intl/applications/dotcom/pdf/c40/volvo-c40-recharge-lca-report.pdf
[26] E. Helmers, D. Johannes, M. Weiss. “Sensitivity Analysis in the Life-Cycle Assessment of Electric vs. Combustion
Engine Cars under Approximate Real-World Conditions”. Sustainability, 12, 2020, 1241.
https://doi.org/10.3390/su12031241
[27] E. Emilsson, L. Dahllof, “Lithium-ion Vehicle Battery Production, Status 2019 on Energy use, CO2 emissions, use of
metals, Products Environmental Footprint, and Recycling”, IVL, 2019 [Online]. Available:
https://www.ivl.se/download/18.14d7b12e16e3c5c36271070/1574923989017/C444.pdf
[28] A. Moro, L. Lonza, “Electricity carbon intensity in European Member States: Impacts on GHG emissions of electric
vehicles”, Transportation Research Part D: Transport and Environment, 64, 2018, 5-14.
https://doi.org/10.1016/j.trd.2017.07.012
[29] UNRAE, “Immatricolazioni in Italia di autovetture e fuoristrada – top ten per segmento – Novembre 2019”, 2020.
[Online]. Available:https://unrae.it/files/07%20novembre%202019_UNRAE%20Top%2010%20per
%20segmento_5de51bb660942.pdf
[30] M. Thomas, L.A.-W. Ellingsen, C.R. Hung, 2018. “Research for TRAN Committee - Battery-powered electric
vehicles: market development and lifecycle emissions”, European Asylum Support Office [Online]. Available:
https://policycommons.net/artifacts/2176316/research-for-tran-committee-battery-powered-electric-vehicles/2932002/
on 10 May 2022. CID: 20.500.12592/rvrdsc.
[31] C. Yuan, Y. Deng, T. Li, F. Yang, “Manufacturing energy analysis of lithium ion battery pack of electric vehicles”.
CIRP Annals- manufacturing Technology, vol.66, pp.53-56
[32] European Counsil (EU). “Fit for 55” Council of the European Union.
https://www.consilium.europa.eu/en/policies/green-deal/fit-for-55-the-eu-plan-for-a-green-transition/ (accessed 1
May 2022).
[33] E.Islam, R.Vijayagopal, A. Moawad, N.Kim, B. Dupont, D.N. Prada, A. Rousseau, “A detailed vehicle modeling &
simulation study quantifying energy consumption and cost reduction of advantaced vehicle technologie through 2050,
Argonne National Laboratory, 2021, Tech. Rep. ANL/ESD-21/10
[34] M. Romare, L. Dahllöf, “ The life cycle energy consumption and greenhouse Gas emissions from Lithium-Ion
Batteries – A Study with Focus on Current Technology and batteries for light-duty vehicles”, IVL, 2017 [Online].
Available: http://www.energimyndigheten.se/globalassets/forskning--innovation/transporter/c243-the-life-cycle-You can also read