Air Ventilation: Health and Environmental Benefits of Fully Dedicated vs. Partially Dedicated Systems - Centrotherm
←
→
Page content transcription
If your browser does not render page correctly, please read the page content below
Air Ventilation:
Health and Environmental Benefits of
Fully Dedicated vs. Partially Dedicated Systems

 By:
 Mallory Epstein
 Centrotherm Eco Systems
Executive Summary
Indoor environments play a vital role in the well being of occupants and the outdoor
environment. Architects and builders have long prioritized a move towards sustainable
infrastructure but are now shifting to an emphasis on indoor elements as the benefits of
healthier living environments have come to light. Homeowners place the focus of their
comfort on temperature control, but typically stop there without acknowledging the
effects indoor air quality has on their wellbeing. Improving air quality can be achieved
through mechanical ventilation, like HRV’s, by bringing fresh air into the building while
extracting inadequate air outside. This report provides an evaluation of the health and
environmental benefits of implementing fully dedicated versus partially dedicated
ventilation systems in a residential setting.

Partially vs. Fully Dedicated Systems

Fully dedicated systems are comprised of individual ducts designated to specific rooms
for both supply and exhaust and therefore provide optimal air circulation. Partially
dedicated systems contain delegated extract runs, like that of a fully dedicated system,
however the supply air is integrated with existing furnace ductwork rather than
individually assigned to specific rooms. These are the most common ventilation systems
since the installation expense is lowered by eliminating supply air ductwork, but this
comes at the cost of occupant health and excessive energy consumption.

The advantage of separating ventilation from the heating system is that air inlet and
outlet valves can be strategically placed to achieve the best airflow based on the
layout of the building. Moreover, the volume of air can be dictated for each room,
allowing for an optimal indoor environment and subsequently occupant health.

Sustainability

Regarding sustainability, connecting the HRV to the furnace ductwork requires
continuous operation of the air handling unit since the ductwork is oversized. This leads
to unnecessary electricity consumption, and consequently increases the homeowner’s
carbon footprint and monthly electricity bill. By comparison, a fully dedicated system
has the potential to save over 50 trees and $300 per year as a direct result of not
running the air handling unit continuously. A fully dedicated system can even pay for
itself after only four years in some circumstances.

Conclusion

Implementing a fully dedicated system creates a healthier environment, both inside
and outside, and should therefore be at the forefront of innovative building design.

 2
Introduction
The average adult takes 20,000 breaths a day (1), so it’s no wonder why fresh air is vital
to maintain proper health. However, ensuring proper indoor air quality (IAQ) is
increasingly harder to achieve due to harmful pollutants and chemicals that lead to
adverse health effects. While fresh air is readily available outdoors, studies show indoor
air comparatively contains between 2-5 times the contaminants (2). Considering that
Canadians spend about 90% of their time indoors (3), it is clear that the importance of
indoor air quality needs to be emphasized through improving ventilation. As society
pushes for sustainable infrastructure to meet growing energy demands while minimizing
environmental impact, it becomes prudent that ventilation systems must be energy
efficient.

Background
Indoor air quality was not originally a concern for many homeowners. Before insulation
became widespread in construction fresh outdoor air was easily able to enter a
building through cracks within windows and walls. Even after the development of
insulation, leaky windows served as a mode for fresh air to enter through. Consequently,
as air was able to enter a building, heat was able to escape. As the price of oil
increased over time, so did the cost of heating a building. This, combined with a
growing awareness of the positive environmental impacts of sustainable buildings,
paved the way for new insulative technology including tighter windows, sealants,
caulking, sprayed foam, etc. Although these developments allowed for buildings to be
more energy efficient, they came at the cost of inhibiting the natural circulation of air,
ultimately lowering IAQ, and hindering the occupant’s health.

Another contributor to poor IAQ comes from the rise of pollutants and chemicals within
buildings. These can be found in cleaning and cooking products, aerosols, mold, and
building materials. The addition of rugs, furniture, and other absorbing materials trap
these chemicals, which can cause lung damage when inhaled over extended periods
of time (4).

The impacts of poor air quality extend further than just taking a toll on the lungs. Other
physical consequences from extended exposure include worsening asthma,
headaches, and fatigue.

With the Coronavirus pandemic, people are not only using more chemicals to clean
surfaces but are also staying at home for extended periods of time. Damage to lung
health increases one’s risk of becoming more susceptible to the virus and developing
severe symptoms. On top of that, the virus itself is airborne, with respiratory droplets
being detectable for as long as three hours, according to the National Institute of
Health (5).

Essentially, there is an increase in indoor pollutants, a lack of air circulation, and a
longer exposure to this polluted air. These factors all point to one conclusion, indoor air
quality is more important now than ever.

 3
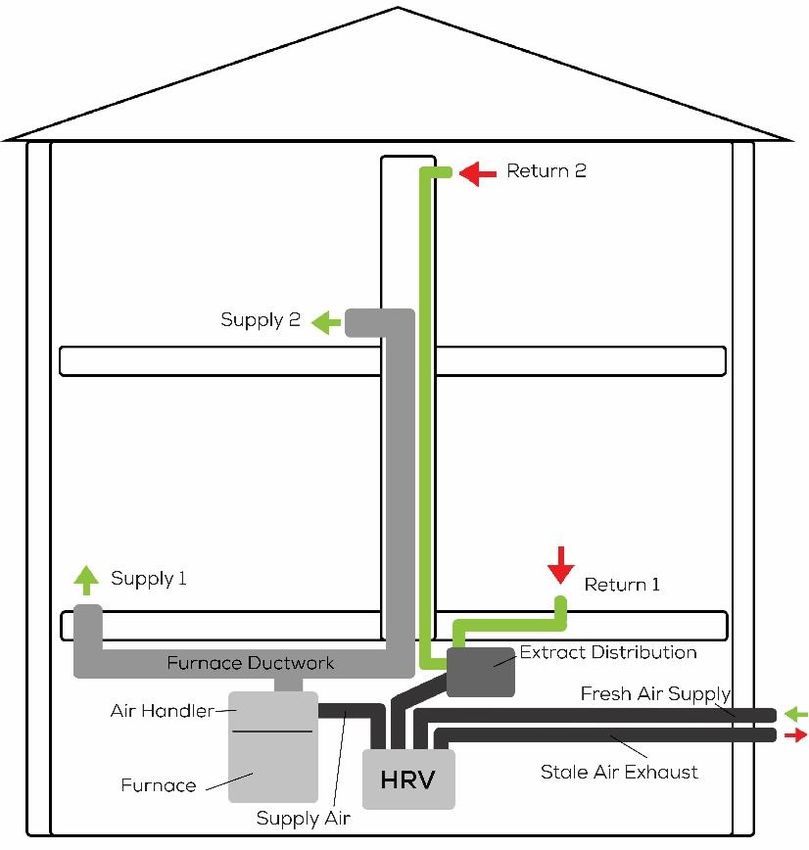
Outdoor air quality has also deteriorated due to pollutants and greenhouse gases,
accelerating the rate of climate change. Although there are copious tactics to reduce
greenhouse gas emissions, lowering energy consumption by increasing energy
efficiency is the key approach since this delivers savings, which will not only pay for itself
over time, but can also be used to reinvest in other sustainable solutions.

Maintaining indoor environments consumes over one third of global energy (6) and 43%
of all energy use in the United States (7), suggesting that solutions to reduce a building’s
energy consumption are in high demand, as this would have one of the largest impacts
on lowering global energy use. Increasing airtightness (i.e., insulation, caulking, etc.)
inhibits conditioned air from escaping, improving the energy efficiency of the building.
However, this comes at the cost of indoor air quality, as pollutants become trapped
inside. This points to the need for an energy efficient air ventilation system to keep the
occupants healthy while lowering the residence’s carbon footprint.

Partially vs. Fully Dedicated Systems
Mechanical ventilation systems are a great way to improve indoor air quality. These
include forced air furnaces, Heat Recovery Ventilators (HRVs), range hoods, and more.
HRVs are becoming increasingly prevalent in new home construction due to their low
operating costs and high efficiencies. There are two types of systems that can be
installed using an HRV; partially dedicated which consists of either just supply or just
exhaust runs, and fully dedicated which is a combination of supply and exhaust runs.

 Partially dedicated exhaust systems
 are the most common in Canadian
 households as they provide an
 efficient method to increase IAQ while
 reducing installation costs. Typically,
 the air supply is interlocked with an
 existing furnace return duct, while the
 extract is ducted separately to each
 highly contaminated and humid
 room, such as bathrooms and
 kitchens. The supply air is distributed by
 the air handling unit of the
 conditioning appliance. While this
 system offers a lower installation cost,
 as it utilizes existing ducts for air supply,
 there are two major drawbacks
 compared to a fully dedicated
 system: depreciated air quality and
Figure 1: Diagram of a partially dedicated system greater electrical consumption.

 4
Although using an existing ductwork system for the air supply seems like an appealing
route, this is actually the contributing factor to both of the previously stated
shortcomings. Simply put, furnaces serve a different purpose than HRVs, and are
designed to reflect as such. The objective of a forced-air handling system is to provide
a substantial amount of warm air throughout a building, whereas an HRV is designed to
bring in fresh air and circulate it throughout the building. Ventilation and
heating/cooling load needs for each room vary depending on factors including
duration of time spent in the room and external wall exposure. For example, large open
spaces such as living rooms are a considerable heating/cooling load due to their large
exterior surface area but aren’t inhabited for long periods of time. This can be easily
juxtaposed to a bedroom, a space where more time is spent by inhabitants but has less
area exposed to the outdoors and therefore less of a thermal load. Likewise, living
rooms naturally receive ample air circulation as a direct result of the open floor layout,
whereas bedrooms require further assistance in air movement as a direct result of their
closed design and doors being shut most of the time.

In this instance, the ductwork from the furnace to the living room would be designed to
handle the larger thermal load, resulting in a greater flow rate of air which is not
required for its short occupancy periods. By contrast, the bedroom would inevitably
receive less air supplied by the furnace ducts as a direct result of its lower heating and
cooling needs despite the need for a larger ventilation rate from its longer occupancy
periods. This demonstrates the contrasting nature of thermal versus ventilation demands
throughout a building, validating that heating/cooling and air circulation should be
implemented as separate systems to achieve an ideal indoor environment.

Air quality would also suffer if the HRV is connected to the air handling unit because of
the size of the ductwork attached to the appliance. Furnaces are designed to move
much higher amounts of air compared to a residential HRV. Typical flow rates for
furnaces and HRVs are around 1500 cfm and 150 cfm, respectively, meaning that there
is a tenfold difference in flow rates. Therefore, the ductwork connected to the furnace
is much larger in diameter since it must be able to handle a far higher airflow capacity.
While a larger diameter system is imperative for high flow rates due to pressure, for this
same reason it should not be incorporated with an HRV, as the low pressure in the trunk
will inhibit adequate air flow.

The fan on an HRV is considerably smaller than that of a furnace blower. This essentially
means that the small amount of air supplied from the HRV does not have enough
power to move throughout the oversized ductwork system. In this situation, only the
closest vents to the HRV will supply air, while the furthest vents will not receive as much
air, since there is not enough pressure. The only solution is the furnace fan must be on in
addition to the HRV in order to allow air to flow throughout the supply ducts. The longer
the fan is on, the better circulation is achieved, hence continuous fan operation would
produce optimal air movement throughout the building if a partially dedicated system
were used. However, continuous operation leads to excessive energy use that could be
avoided if a fully dedicated system is implemented.

 5
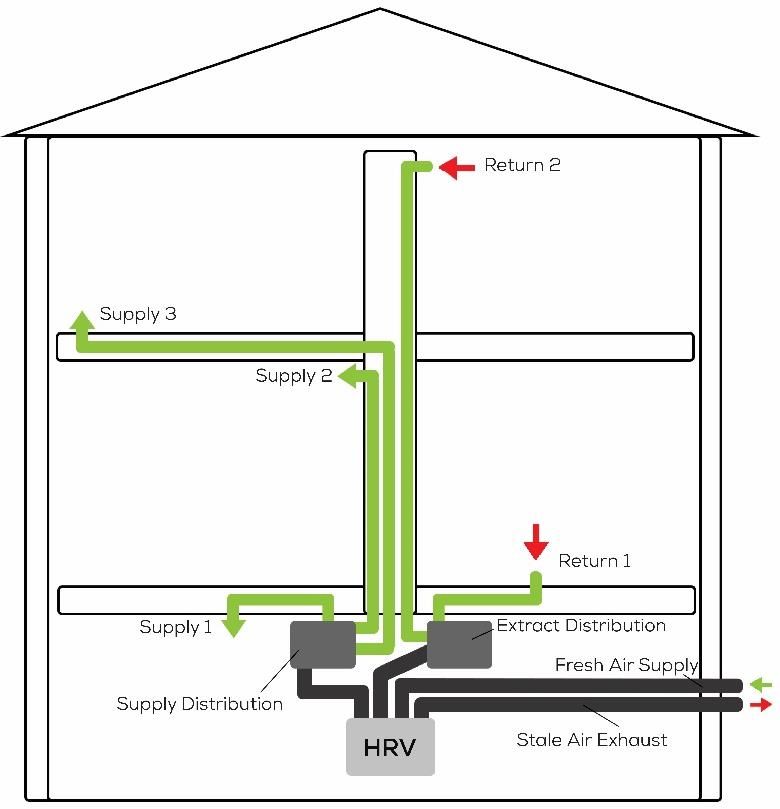
Fully dedicated systems are optimal
to achieve sufficient airflow. This
way the ventilation requirements
are met and only the HRV needs to
be on rather than the addition of a
furnace fan. The most
advantageous fully dedicated
design is a radial system. In a radial
system each run is distributed from
the HRV directly to each room,
rather than a trunk and branch
layout. This eliminates oversized
ductwork and prevents
contamination between rooms.

 Figure 2: Diagram of a fully dedicated system

One HRV manufacturer, provides the following reasons for why an HRV should not
connect to the furnace as a mode of distributing air:

 “1. In this case, the air handling unit (AHU) must run continuously or be
 interlocked to operate with the HRV/ ERV to avoid loss of balanced supply and
 exhaust airflows.

 2. In multi-speed AHU’s, balancing must be conducted on the most frequently
 used speed, but the HRV/ERV may not remain in balance at other speeds. The
 same is true if the AHU has multi-speed blowers.

 3. In warm, humid seasons, continuous operation of the AHU causes evaporation
 from the cooling coil, resulting in a loss of humidity control. Failure to operate the
 AHU with the HRV/ERV may also result in condensation in the supply plenum and
 ducting.”

Even an HRV manufacturer deters using their product with a furnace. Simply put, the air
handling unit must be constantly running, it’s difficult to properly balance both
appliances since they each have multiple operating speeds, and condensation
buildup occurs in warmer conditions, which lowers the indoor air quality (8). These
arguments point to the need for a fully dedicated system to provide the best air quality
while avoiding excessive air handling unit operation.

 6

IAQ and Occupant Health
There are countless reasons as to why indoor air quality should be a priority for
occupants with regards to their physical wellbeing. Nevertheless, proper air ventilation is
usually an afterthought for many residents since the archaic method of simply opening
a window achieves fresh airflow within the house. Even though this approach works,
opening windows throughout a building unfolds its airtight envelope, allowing
conditioned air to escape and consequently wasting energy. As previously discussed,
it’s imperative now more than ever to maximize building efficiency to subdue the
building’s environmental impact.

Apart from partially dedicated systems requiring more energy to operate, they also fail
to provide optimal air circulation because they make use of the existing furnace ducts.
This impedes achieving the best possible indoor airflow since furnace ducts are
oversized compared to ventilation ducts, and heating demands of a room oppose its
ventilation demands. In a partially dedicated system, the contractor only has control of
valve placement in exhaust runs and must accept the location of the existing supply
terminals from the air handling unit. Conversely, in a fully dedicated system the
contractor has full autonomy over the placement of supply and exhaust terminals and
can therefore create a strategic arrangement to get the most out of air mixing.

To consider the extent of the impact inadequate air distribution has on the health of its
occupants requires looking through a broader scope.

Air pollutants including dust mites, mold, tobacco smoke, and particulate matter are
commonly found within every building. These particular contaminants are considered
“asthma triggers” by the EPA (9), meaning that exposure could induce an attack to
those who suffer from asthma. However, an occupant can still experience adverse
health effects when subjected to inadequate air quality even if they are not asthmatic.
A common and well-studied example is “sick building syndrome” where occupants with
no record of preexisting conditions express acute discomforts such as headaches,
throat irritation, coughing, nausea, fatigue, and difficulty concentrating (10). While this is
certainly not something anyone wants to experience within their living space, sick
building syndrome can drastically hamper performance in academic and work
settings. It’s no wonder why asthma-related illness accounts for 10 million missed school
days per year (11), making it one of the leading causes of absenteeism.

Improving indoor air quality is proven to increase productivity in a working environment
as much as 5% -10%. In most businesses employee salary expense is far greater than
energy costs of the office building, making it a worthwhile investment to increase
productivity. In fact, only 1% increase in productivity is enough to offset annual
ventilating costs for the office building. It’s been shown that doubling the fresh air
supply rate not only reduced absences from illnesses by 10%, but also increased work
output by 1.5% (12), which is more than enough to cover ventilating costs.

The Covid-19 pandemic has transformed the definition of an office, allowing employees
to work from anywhere, mostly within the comfort of their living spaces, which further

 7
supports the need for proper indoor air quality in residential spaces. The pandemic has
also lowered indoor air quality for other reasons including a surge in household cleaning
products like aerosols and more time spent cooking rather than eating out. Constant air
circulation can also decrease the risk of transmission up to 47% according to the World
Health Organization (13).

Indoor air quality is so vital to combatting the spread of the Coronavirus, that the EPA
has dedicated part of their website to this relationship. They state, “Although
improvements to ventilation and air cleaning cannot on their own eliminate the risk of
airborne transmission of the SARS-CoV-2 virus, EPA recommends precautions to reduce
the potential for airborne transmission of the virus. These precautions include increasing
ventilation with outdoor air and air filtration as part of a larger strategy…” They also cite
using mechanical ventilation, such as an HRV, as a means to increase airflow (14).

In all, indoor air quality can positively benefit occupant well-being in terms of lung
health, productivity, and decreased risk of transmission of Covid.

Energy Consumption
Partially dedicated systems must employ the furnace fan simultaneously with the HRV to
achieve suitable air distribution due to the nature of the oversized air handler ducts.
Many new furnaces have variable fan speeds, so the fan could be run on a continuous
low speed. However, older models typically only have a single speed, resulting in excess
energy use if continuously operated. Nonetheless, in both cases the furnace fan is still
operating concurrently with the HRV, i.e., two appliances are running at the same time
in a partially dedicated system when only one appliance is needed in a fully dedicated
system. Consequently, more energy is used as opposed to solely running the HRV.

In order to quantify how much additional energy is consumed if both the furnace and
HRV are running simultaneously, a baseline of annual furnace fan use needs to be
established. The first step is to determine how often the furnace is running (how many
hours a year) in a typical household, to reveal how frequently the fan blower is on. This is
done by taking the heating loads of a residence into account to determine how much
energy is required to heat the household over a year based on its location.

In a fully dedicated system, the HRV is not connected to the furnace, therefore the fan
would only need to operate while the furnace is running. Determining the number of
hours per year the furnace is running equates to the number of hours per year the fan
would be operating in a fully dedicated system.

The excess electrical consumption in a partially dedicated system is attributed to
running the fan when the furnace is not on. The number of additional hours of fan
operation is governed by the fan speed, either single or variable. Essentially, energy
savings from a fully dedicated system is the difference in the number of hours of
additional fan operation.

 8
i. Determining A Furnace Fan Operation Baseline

First, the number of hours a furnace operates in a one-year period to heat the average
Canadian home needs to be established. This will be used as a baseline when
comparing the number of hours the fan would be operating if implemented in a
partially dedicated system.

The burning operating hours (BOH) of a furnace is the number of hours the furnace is
running during a year period. It’s used to determine annual heating loads and is
calculated based on the annual household heating consumption and the input
capacity of a typical furnace. Equation 1 was provided by the Office of Building
Technologies and Community Systems of the U.S. Department of Energy (15).

 (ℎ ⁄ ) =

 Equation 1: Annual Burning Operating Hours (BOH) of a furnace

Where Qyr is defined as “the annual fuel consumption for heating the house- from
RECS97 (Btu/yr)” and Qin is defined as the “input capacity of the existing furnace
(Btu/hr)”.

 ii. Annual Household Fuel Consumption

Qyr is now determined based on the annual fuel consumption of a household. It is
necessary to break down the annual fuel consumption usage by province, since the
climate varies greatly throughout Canada depending on the region. Based on values
published by Statistics Canada (16), the average household energy use by province is
as follows:

 Province GJ/household
 AB 130
 BC 99
 MB 98
 NB 92
 NL 111
 NS 101
 ON 107
 PE 142
 QC 95
 SK 110
 Table 1: Average household energy use in GJ broken down by province

Natural Resources Canada states “Approximately 60 percent of the energy required to
run the average home is used for space heating” (17). Taking 60% of the energy use per
household1 from table 1, the annual energy fuel consumption to heat an average
household (Qyr) in GJ and BTU is shown in Table 2.

 9
Heat Energy
 Province Qyr (Btu/yr)
 (GJ/yr)
 AB 78 7.39E+07
 BC 59.4 5.63E+07
 MB 58.8 5.57E+07
 NB 55.2 5.23E+07
 NL 66.6 6.31E+07
 NS 60.6 5.74E+07
 ON 64.2 6.08E+07
 PE 85.2 8.08E+07
 QC 57 5.40E+07
 SK 66 6.26E+07
Table 2: Annual heat energy consumption per household in GJ and Btu based on the assumption that 60%
 of residential energy consumption is used towards heating the house.

 iii. Furnace Input Energy

Next, to determine the BOH, the input capacity of the furnace, Qin, needs to be
established. Furnace specifications are used from The Federal Energy Management
Program (FEMP), which “provides acquisition guidance for residential furnaces, a
product category covered by ENERGY STAR”. For an ENERGY STAR furnace, FEMP
provides the following specifications (18):

 AFUE 95%
 Output Capacity 70,000 Btu/hr
 Table 3: AFUE rating of an ENERGY STAR furnace with a 70,000 Btu/hr output

Where AFUE or Annual Fuel Utilization Efficiency is defined as the “ratio of useful energy
output to energy input as a percentage (%) over the entire heating season” by ENERGY
STAR. Using the AFUE rating and output capacity, it is possible to determine the energy
input of the furnace.

 ( ⁄ℎ ) = ⁄

 Equation 2: Input energy of a furnace based on its AFUE ratings and output energy

Using Equation 2, the total energy input of the furnace is determined to be 73,684
Btu/hr2.
 70,000 /ℎ
 = = 73,684 ⁄ℎ
 0.95

 10
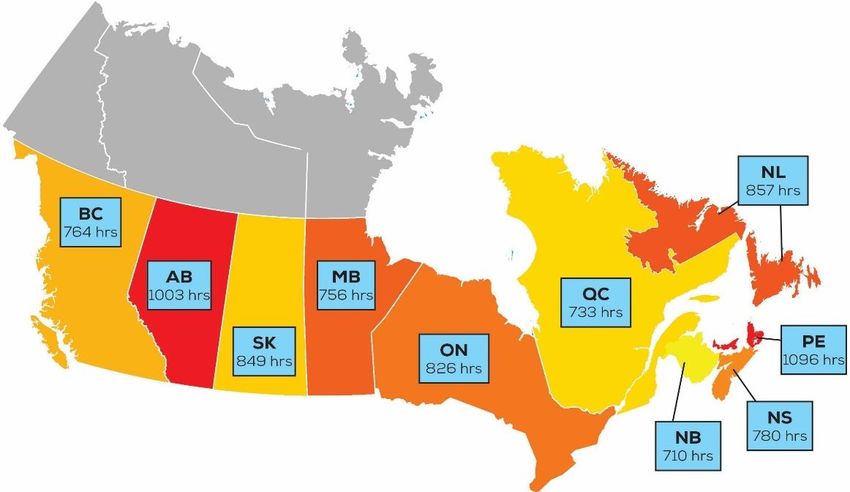
iv. Annual Furnace Fan Operating Hours

Now the BOH of each province can be determined using their respective Qyr and Qin.

 Figure 3: Burning Operating Hours (BOH) of each province calculated from equation 2
Assuming the blower is only operating while the furnace is running3, the BOH reflects the
operating time of the blower fan. This can be used to determine the total electrical
output of the furnace fan.

 v. Annual Energy Consumption of a Single & Variable Speed Fan

Older furnaces utilize inefficient recirculation fan motors, ranging from 500 W to 800 W
that operate on a single speed, while newer models can contain fans that use around
100 W with variable speeds (3). Table 5 below shows the total energy usage in kWh/year
of a 500 W single speed fan4, and a more efficient 100 W variable speed fan5 if they are
only operating during BOH.

 kWh/year
 Province BOH Single (100 W) Variable (500 W)
 AB 1003.3 501.7 100.3
 BC 764.1 382.0 76.4
 MB 756.4 378.2 75.6
 NB 710.1 355.0 71.0
 NL 856.7 428.3 85.7
 NS 779.5 389.8 78.0
 ON 825.8 412.9 82.6
 PE 1095.9 548.0 109.6
 QC 733.2 366.6 73.3
 SK 849.0 424.5 84.9
 Table 5: Annual energy usage for each province in kWh of a 500 W single speed fan and 100 W variable
 speed fan if operating during only BOH.

 11
vi. Energy Consumption of a Single & Variable Fan in a Partially Dedicated System

As previously stated, if the HRV is connected to the forced-air handler ductwork, then
the furnace blower should run either on a continuous6 low rate using a variable speed
motor (100 W for 24hr/day), or intermittently on a 30 minute on and off cycle7 using a
single speed motor (500 W). Equation 3 determines the energy consumption for both
scenarios.
 ( ) ∗ (ℎ / )
 ( ℎ/ ) =
 1000
 Equation 3: Annual energy consumption of a furnace fan in kWh

 ℎ
 500 ∗ 12 ∗ 365 ( )
 = = 2190 ℎ/
 1000
 ℎ
 100 ∗ 24 ∗ 365 ( )
 = = 876 ℎ/
 1000

vii. Excess Energy Consumed by the Fan in a Partially Dedicated System

The annual consumption difference per province can be concluded by subtracting the
values in Table 5 from their respective energy consumption from the calculated energy
consumption if connected to the HRV and run for the suggested amount of time
(Energysingle or Energyvariable). Table 6 quantifies this difference in energy consumption.

 Annual Excess Energy (kWh/yr)

 Province Single Variable
 AB 1688 776
 BC 1808 800
 MB 1812 800
 NB 1835 805
 NL 1762 790
 NS 1800 798
 ON 1777 793
 PE 1642 766
 QC 1823 803
 SK 1766 791
Table 6: Difference in energy consumption shown in kWh/yr if the furnace fan is running only at BOH versus if
 it is in a partially dedicated system and operating for the suggested amount of time based on the fan
 speed (12 hrs/day if single and 24 hrs/day if variable).

 12
The data in Table 6 reveals the electrical
 savings potential in a fully dedicated
 system. In other words, this is the
 additional amount of energy that would
 be consumed in a partially dedicated
 system. To put this into perspective,
 Figure 4 displays the percent difference
 from the energy savings in Table 6.

 A residence can save anywhere
 between 75%-92% on their furnace
 electrical consumption while improving
 air quality if a fully dedicated system is
 employed instead of a partially
 dedicated system. Although the amount
 of electricity consumed by a single
 speed fan is higher than a variable
 speed fan based on the values in Table
 6, proportionally the highest savings are
 attributed to switching from a variable
 speed fan as seen in Figure 4. The
 difference for a single speed fan ranges
 from 75% to 84%, while the difference for
 a variable speed fan ranges from 87% to
 92%.

 Looking at the bigger picture, energy
 savings can be translated into savings
Figure 4: Additional percentage of energy used by a on a residence’s electricity bill, as well as
single and variable speed fan based on values from lowering a residence’s carbon footprint.
 Table 6

Sustainability
As the number of Canadian households continues to grow, the need for energy
efficiency improvements in the residential sector becomes critical. Between 1990 and
2017 the total increase in Canadian residential energy use was only 5.8% despite a 46%
increase in the number of households. Additionally, the households erected during this
time also had an average of 20% more floor space, meaning more energy was
required to heat these newer homes. This disparity between increasing energy demand
and declining energy use is attributed to improvements in energy efficiency. Without
gains in efficiency, the Canadian residential energy use would have increased by
57.5%, ten times more than it actually did (19).

 13
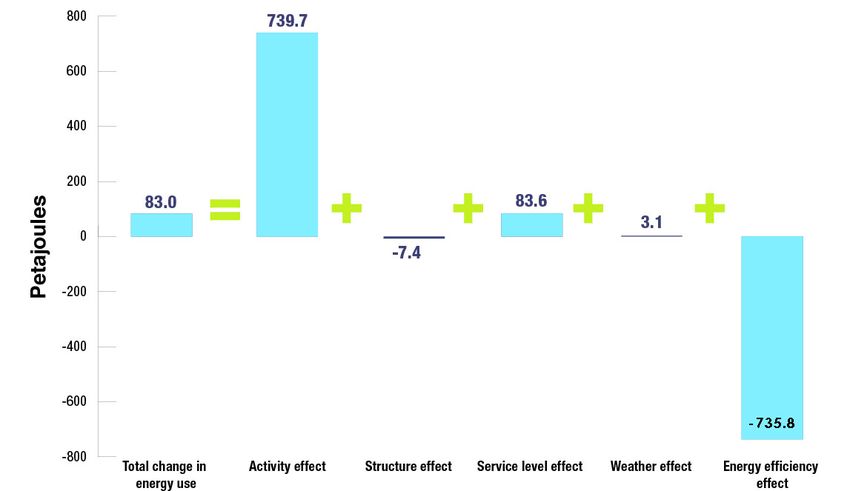
Change in Canadian Residential Energy Use Between 1990-2017

 Figure 5: Impact of activity, structure, service level, weather, and energy efficiency on the change in
 residential energy use, 1990-2017. Source: Natural Resources Canada

Figure 5 illustrates that the clear contributors to energy use and energy savings are the
activity and efficiency effects, respectively. The 740 PJ of energy used by the activity
effect, which is the growth of the residential sector and consequently its demand for
energy, emitted 30.4 Megatons of greenhouse gases. Fortunately, this was virtually
counterbalanced by the 736 PJ saved from energy efficiency improvements within the
residential sector, preventing an additional 30.2 Megatons of greenhouse gases from
being emitted.

The largest use of residential energy is dedicated to space heating, which accounted
for 62% of the total energy use (19). As a result, many efficiency improvements are
aimed at reducing the heating load by sealing the building envelope, ultimately
hindering indoor air quality. As this trend of enhancing airtightness combines with the
growth of the residential sector and its consequent demand for energy, it’s evident that
decreasing energy consumption and improving IAQ is a vital solution to minimize
carbon emissions while ensuring occupant health.

Implementing a fully dedicated ventilation system drastically reduces electrical
consumption compared to a partially dedicated system, subsequently lowering the
household’s environmental impact. To determine the equivalent carbon footprint offset,
each province’s mode of electricity production i.e., renewable sources vs. fossil fuels,
must be considered.

 14
i. Amount of CO2 Emitted from Electricity Production

Electricity can be generated through sustainable methods such as hydropower, wind
turbines, and solar panels, or conversely using fossil fuels which contribute to
greenhouse gas (GHG) emissions. Each province employs a different combination of
energy generation methods. Thus, the carbon footprint contributed by electricity
production varies by province based on how heavily they rely on fossil fuels versus
renewable energy sources.

The greenhouse gas emission expressed in grams of CO2 per kWh of electricity
produced for each province is determined by equation 4.

 2 ( )⁄ 2 ( ) 1 ( ℎ) 1.0 + 9 ( )
 ℎ = ( ℎ) ∗ 1.0 + 9 ( ℎ) ∗ 1 ( )
 Equation 4: Grams of equivalent CO2 emitted per kWh

Where kt of CO2eq is the equivalent amount of CO2 (combination of greenhouse gases
CO2, CH4, and N2O) emitted from public electricity production for each province
sourced by the 2020 Canadian National Inventory Report (20). Electricity produced is
the total amount of TWh of electricity produced for each province reported by the
Canada Energy Regulator8(21). Table 7 provides the data used to calculate the
equivalent amount of CO2 in grams produced for each kWh of electricity generated by
each province.

 Province Electricity (TWh) GHG (kt CO2 eq)
 AB 81 36200
 BC 74.2 689
 MB 36.9 41
 NB 12.2 3710
 NL 42.8 1130
 NS 9.6 7010
 ON 151 4450
 PE 0.6 3
 QC 213.7 255
 SK 24.3 16100
 YT 0.5 33
 Table 7: Electricity generated by each province and their respective CO2 emissions from production.

The Canada Energy Regulator states (21):

 “B.C., Manitoba, Quebec, Newfoundland and Labrador, and Yukon each
 generate over 80% of their electricity from hydroelectricity. Ontario, New
 Brunswick, and NWT rely on various combinations of nuclear, hydro, wind,
 biomass, coal, natural gas, and petroleum…. Alberta, Saskatchewan, Nova
 Scotia, and Nunavut generate the majority of their electricity from fossil fuels
 such as coal, natural gas, or petroleum.”

 15
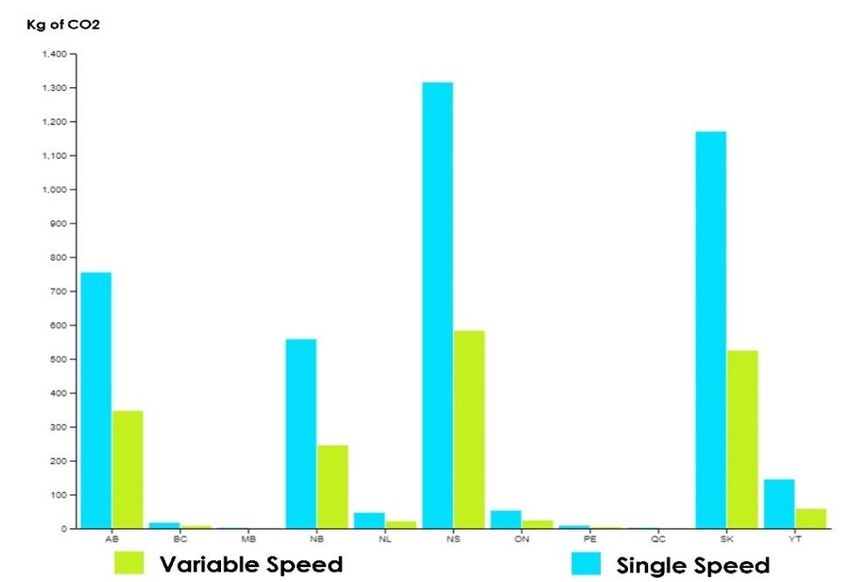
Taking this into context of the data in Table 7 explains the drastic difference between
the greenhouse gas emissions of AB, SK, and NS compared to the other provinces.

 GRAMS OF CO2/KWH The equivalent amount of CO2 in
 AB, 446.9 grams produced for each kWh of
 SK, 662.6 electricity generated by each
 province is calculated from the
 BC, 9.3 values in Table 7 with Equation 4.

 Figure 6 illustrates the influence
 MB, 1.1 various methods of electricity
QC, 1.2 production each province
 NB, 304.1
 employs has on the environment.
PE, 5
 For some provinces such as AB,
 NB, NS, and SK, reducing energy
 ON, 29.5
 NL, 26.4 consumption by even a small
 amount can still play a major role
 NS, 730.2 in mitigating carbon emissions.

Figure 6: Equivalent amount of CO2 in grams produced from
 each kWh of electricity generation for each province.

 ii. Carbon Footprint of a Partially Dedicated System

Using the difference in additional electricity consumption in kWh/yr between a fully
dedicated system and partially dedicated system calculated in Table 6, the total
amount of additional CO2 produced from a partially dedicated system for each
province can be concluded. The results are shown in Figure 7 below.

 Additional Carbon Emissions of a Partially Dedicated System

 Figure 7: Annual carbon emissions (kg) from a single and variable speed fan in a partially
 dedicated system for each province.

 16
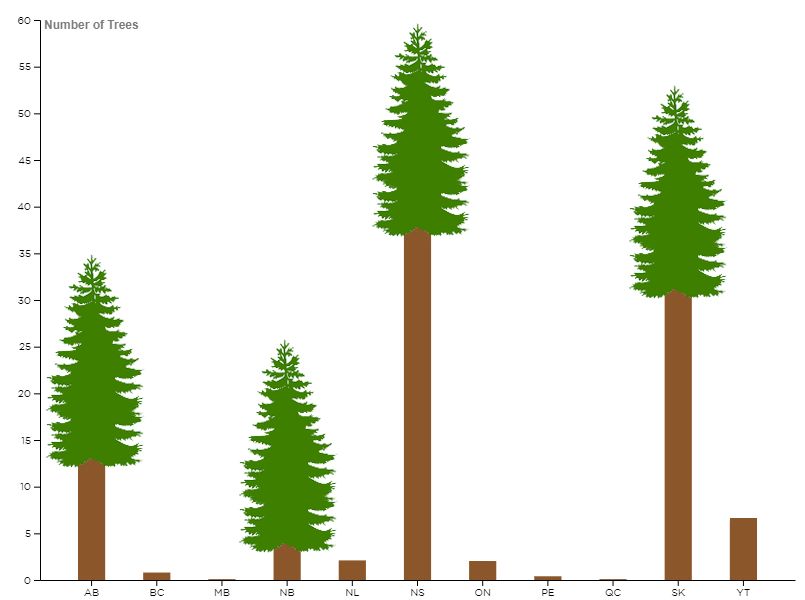
iii. Number of Trees Needed to Offset a Partially Dedicated System

The above results show the positive impact of using a fully dedicated system compared
to a partially dedicated system from an environmental standpoint. However, kg of CO2
is a difficult unit of measurement to comprehend since it is essentially the weight of a
gas. This can be converted into a more tangible unit that’s easier to grasp, such as
number of trees needed to offset this carbon footprint.

According to Kohl et al. 2017 (22), one mature tree can store up to 48 lbs, or 22 kg of
carbon annually. Figure 6 illustrates the number of trees needed to offset the additional
carbon emissions from a partially dedicated system with a single speed fan for an
average household in each province.

 Number of Trees Required to Offset Carbon Emissions of a Partially Dedicated System
 with a Single Speed Fan for One Year

Figure 8: Number of trees needed to offset additional CO2 emissions from a partially dedicated system with
 a single speed fan for each province found by dividing the values in Table 8 by 22 kg.

It should be noted that a carbon offset of 22 kg is only true for adult trees, which can
take approximately forty years to reach maturity (23), meaning that even if a residence
planted the suggested number of trees, there wouldn’t even be a noticeable positive
effect until decades after. Converting carbon emissions into a more demonstrable
instance unveils just how paramount reducing electrical consumption really is and the
larger impact it can have on the environment.

 17
Electricity Savings
In addition to lowering carbon emissions from requiring less energy, a fully dedicated
system also lowers the homeowner’s electricity bill. Savings vary based on how much
more frequently the fan would be operating in a partially dedicated system, which is
dictated by the building’s thermal load (see excess energy use in table 6). The strongest
appeal of a partially dedicated exhaust system is lower installation costs since the
system utilizes existing ductwork. However, this cost would be offset by the electricity
savings. The funds saved in operating costs can be used to invest in other sustainable
and efficient home solutions and can eventually pay off the installation difference.

 i. Annual Electricity cost of a Fully and Partially Dedicated System

The annual cost of electricity for a fully and partially dedicated system for both a single
and variable speed fan in each province is determined by multiplying the costs/kWh of
electricity (24) by the annual kWh consumed for each fan type under their respective
fully and partially dedicated operating hours.

 Price/year (fully) Price/year (partial)
 Province Price/kWh single variable single variable
 AB $ 0.166 $ 83.28 $ 16.66 $ 363.54 $ 145.42
 BC $ 0.126 $ 48.14 $ 9.63 $ 275.94 $ 110.38
 MB $ 0.099 $ 37.44 $ 7.49 $ 216.81 $ 86.72
 NB $ 0.127 $ 45.09 $ 9.02 $ 278.13 $ 111.25
 NL $ 0.138 $ 59.11 $ 11.82 $ 302.22 $ 120.89
 NS $ 0.171 $ 66.65 $ 13.33 $ 374.49 $ 149.80
 ON $ 0.130 $ 53.68 $ 10.74 $ 284.70 $ 113.88
 PE $ 0.174 $ 95.35 $ 19.07 $ 381.06 $ 152.42
 QC $ 0.073 $ 26.76 $ 5.35 $ 159.87 $ 63.95
 SK $ 0.181 $ 76.83 $ 15.37 $ 396.39 $ 158.56
Table 8: Annual cost of electricity for each province if a single and variable furnace fan were run in a fully
 dedicated system (during BOH) versus a partially dedicated system (operating during their suggested
 amount of time based on the fan speed, 12 hrs/day if single and 24 hrs/day if variable).

Table 8 displays the annual cost of electricity to operate a furnace blower under various
conditions. The Price/year (fully) column exhibits the annual electrical cost to run a fully
dedicated system (blower on only when the furnace is running for both a single speed
500 W and variable speed 100 W fan). These costs are relatively low compared to the
Price/year (partial) column, which presents the annual price of electricity for a single
speed and variable speed fan in a partially dedicated system running under their
respective airflow assumptions used in the previous calculations (12 hours/day for single
speed and 24 hours a day for variable speed).

 18
ii. Fully Dedicated Electricity Savings Over a One, Three, and Five Year Period

This difference becomes even more apparent when looking through a larger timeframe
and taking inflation into account. Savings are calculated using equation 5:

 ($) = − ∗ ∗ 1.02 −1
Equation 5: Annual electricity savings if the furnace fans are running during BOH versus if they are operating
 during their suggested amount of time based on the fan speed, with 2% inflation.

Where Costpartial is the annual electrical cost of either the single or variable speed fan
when used under its respective operating frequency assumptions, Costfully is the annual
electrical cost of either the single or variable speed fan when running only while the
furnace is running (BOH), and n is the number of years after installation. Equation 5 also
considers a 2% inflation rate9. This formula was used to calculate the potential electricity
savings of a fully dedicated system for one, three, and five years seen in Table 9 below.

 Yearly price difference 3-year savings 5-year savings
Province single variable single variable single variable
 AB $ 280.26 $ 128.76 $ 874.76 $ 401.89 $ 1,516.83 $ 696.87
 BC $ 227.80 $ 100.75 $ 711.02 $ 314.46 $ 1,232.91 $ 545.27
 MB $ 179.37 $ 79.24 $ 559.85 $ 247.31 $ 970.78 $ 428.84
 NB $ 233.04 $ 102.23 $ 727.37 $ 319.09 $ 1,261.26 $ 553.31
 NL $ 243.11 $ 109.07 $ 758.79 $ 340.42 $ 1,315.74 $ 590.28
 NS $ 307.84 $ 136.47 $ 960.84 $ 425.94 $ 1,666.09 $ 738.58
 ON $ 231.02 $ 103.14 $ 721.07 $ 321.93 $ 1,250.33 $ 558.23
 PE $ 285.71 $ 133.35 $ 891.77 $ 416.23 $ 1,546.32 $ 721.74
 QC $ 133.11 $ 58.60 $ 415.46 $ 182.89 $ 720.40 $ 317.13
 SK $ 319.56 $ 143.19 $ 997.40 $ 446.92 $ 1,729.50 $ 774.97
Table 9: Electrical price difference between a single and variable speed furnace fan operation during only
 BOH versus within a partially dedicated system shown over a period of 1, 3, & 5 years for each province.

Based on the costs above, it’s evident that the highest potential electrical savings
come from implementing a fully dedicated system rather than a partially dedicated
system with a single speed furnace blower. These savings could even be deemed a
conservative estimate, considering that they are based on the assumption the single
speed fan is only running for 12 hours of the day, rather than the recommended
continuous 24 hours, which would provide better air circulation.

 iii. Payback Period of a Fully Dedicated System

After only a couple of years, the savings from employing a fully dedicated system over
a partially dedicated system would cover the installation and materials cost and
continue saving the residence money on their energy bill while providing optimal air
circulation. A reasonable installation cost for the supply side of a dedicated ventilation
system is around $120010.

 19
This can be used to determine the payback period of a fully dedicated system by
dividing the assumed installation cost of $1200 by the annual electricity savings.

 Payback Period of a Fully Dedicated System

 Figure 9: Payback period of a fully dedicated system with a single and variable speed fan for each
 province based on an estimated installation cost of $1200.

Figure 9 illustrates the difference in payback period between a single speed and
variable speed fully dedicated system. It would only take between four to six years to
pay off the installation costs of a fully dedicated system if the homeowner had a single
speed fan. The payback period is longer for a variable speed furnace and would
realistically take between eight to twelve years to cover the installation costs. Once the
installation cost is paid off, the homeowner will continue to save money every year
thereafter, making a fully dedicated system a worthwhile investment.

 20
Discussion
The average person spends most of their time at home and tries to stay healthy, so
keeping living spaces and lungs in good shape should receive the same amount of
emphasis. Extending past living spaces, it’s crucial now more than ever to make sure
the environment is healthy as well. For these reasons, capitalizing on proper ventilation
produces a wide range of returns, reaching occupant health, electrical bills, carbon
footprint, and even transmission of diseases.

Partially dedicated ventilation systems are abundant throughout Canada, as they are
presumably the better option based on installation costs while still offering dedicated
extracts. Yet looking below the surface reveals that these systems require excess
electrical consumption and only provide enough air circulation if properly installed. Still,
the volume and assignment of air flow doesn’t compare in quality to a fully dedicated
system and redundant electricity use has lasting environmental impacts.

For the assumed average household, making the switch from a partially to a fully
dedicated system will result in electrical savings and lower carbon emissions, but these
results vary greatly depending on the location of the residence or building. For
example, a homeowner in Alberta could save 14 times the number of trees compared
to a homeowner in Ontario, even though an electricity bill in Alberta would only be 20%
greater than that of Ontario. Moreover, a dedicated system in Alberta would be paid
back within a matter of only four years if they had a single speed furnace, which is the
most common type in Canadian homes.

As ventilation requirements become more stringent throughout Canada and HRV
mandates are even imposed in some jurisdictions (3), choosing the proper ventilation
system is crucial in new construction. Fully dedicated systems undeniably offer optimal
air circulation and reduce a home’s environmental impact by lowering electrical
consumption, consequently saving the homeowner on their electricity bills, and
eventually covering the cost of installation as an added benefit. In other words, an
investment in a fully dedicated ventilation system is an investment in health, savings,
and the environment.

 21
Appendix A: Assumptions
The calculations in this paper are based on assumed values and datasets.

 1. All the 60% of energy used for space heating in the average home provided by
 the natural Resources Canada is used by only the furnace. This results in a
 conservative energy savings estimate, since assuming all 60% of heat energy is
 used by the furnace raises the Qyr, and therefore increases the baseline of
 furnace operation (BOH).
 2. The furnace has an energy star rating and an AFUE of 95%. Not all Canadian
 homes have a high efficiency furnace, meaning the Qin would be larger in that
 case. This results in a conservative energy savings estimate, since assuming a
 high efficiency furnace lowers the Qin, therefore increasing the baseline of
 furnace operation (BOH).
 3. The blower only operates while the furnace is running and not more. Although it’s
 not uncommon to run the fan outside of when the furnace is not on to increase
 air mixing, if the household has a fully dedicated system there is no need to run
 the fan additionally, since the system is designed to maximize airflow.
 4. The single speed furnace fan uses 500 W. This results in a conservative energy
 savings estimate since the furnace fan could use up to 800 W, which would
 consume 60% more electricity and emit more greenhouse gases and cost the
 homeowner more to operate.
 5. The variable speed furnace fan uses 100 W. This is a realistic energy savings
 estimate; however, some newer high efficiency fans can use as little as 75 W,
 which would result in lower greenhouse gas emissions and operating costs.
 6. The variable speed fan operates continuously when integrated in a partially
 dedicated system, which is recommended by the HRV manufacturer.
 7. The single speed fan operates on a 30 minute on and off cycle, or 12 hours per
 day. This is a conservative estimate considering a recommended continuous
 operation to achieve optimal air quality.
 8. The equivalent amount of CO2 emitted from electricity generation for each
 province assumes that a household receives power only from the electricity
 generated by the province it is located in, and no other sources.
 9. A 2.00% inflation rate is used to determine the savings of a fully dedicated system
 over time. This is a slightly conservative estimate, considering the average
 inflation rate is approximately 2.27% compared to the previous year.
 10. The installation cost of the supply runs in a dedicated system is $1200. The
 installation costs can differ greatly based on variables such as building size,
 ventilation requirements, contractor, location, and more.

 22
Sources:

 1. Brown, Ann. “How Many Breaths Do You Take Each Day?” The EPA Blog, EPA, 28
 Apr. 2014, blog.epa.gov/2014/04/28/how-many-breaths-do-you-take-each-day.
 2. Abouleish, M. Y. Z. “Indoor Air Quality and Covid-19.” Royal Society for Public
 Health, vol. 191, 2020, pp. 1–2. ScienceDirect, doi:10.1016/j.puhe.2020.04.047.
 3. Health Canada. “Ventilation and the Indoor Environment - Canada.Ca.”
 Government of Canada, 19 Apr. 2018, www.canada.ca/en/health-
 canada/services/publications/healthy-living/ventilation-indoor-
 environment.html.
 4. Snider, Joe. “Could Indoor Air Quality Become Part of the Post Coronavirus
 Playbook? | Greenbiz.” Could Indoor Air Quality Become Part of the Post
 Coronavirus Playbook?, GreenBiz, 15 May 2020,
 www.greenbiz.com/article/could-indoor-air-quality-become-part-post-
 coronavirus-playbook.
 5. National Institutes of Health. “New Coronavirus Stable for Hours on Surfaces.”
 National Institutes of Health (NIH), 17 Mar. 2020, www.nih.gov/news-events/news-
 releases/new-coronavirus-stable-hours-surfaces.
 6. Leong, Xi Wen, and Emmanuel A. Essah. “Bridging the Gap between Energy
 Consumption and the Indoor Environmental Quality of a 1960s Educational
 Building.” Energy Procedia, vol. 132, 2017, pp. 87–92. Crossref,
 doi:10.1016/j.egypro.2017.09.643.
 7. Environmental Protection Agency. “Health, Energy Efficiency and Climate
 Change.” US EPA, 19 Aug. 2020, www.epa.gov/indoor-air-quality-iaq/health-
 energy-efficiency-and-climate-change.
 8. American ALDES Ventilation Corporation. (2019). Heat & Energy Recovery
 Ventilators: Operations & Maintenance Manual. Retrieved from
 https://aldes.us/wp-content/uploads/2019/02/residential-hrv-
 erv_iom.REV0219.pdf
 9. United States Environmental Protection Agency. “Indoor Air Quality.” US EPA, 16
 July 2018, www.epa.gov/report-environment/indoor-air-
 quality#:%7E:text=or%20air%20conditioning.-
 ,Effects%20on%20Human%20Health,%2C%20heart%20disease%2C%20and%20ca
 ncer.
 10. United States Environmental Protection Agency. “Indoor Air Facts No. 4 (Revised)
 Sick Building Syndrome.” Air and Radiation Research and Development (MD-56),
 1991, pp. 1–4, www.epa.gov/sites/production/files/2014-
 08/documents/sick_building_factsheet.pdf.
 11. Hsu, Joy et al. “Asthma-Related School Absenteeism, Morbidity, and Modifiable
 Factors.” American journal of preventive medicine vol. 51,1 (2016): 23-32.
 doi:10.1016/j.amepre.2015.12.012
 12. Wargocki, Pawel. “Indoor Climate and Productivity in Offices How to Integrate
 Productivity in Life-Cycle Cost Analysis of Building Services.” REHVA, vol. 6, 2007,
 pp. 3–82. Federation of European Heating and Air-Conditioning Associations,
 biblioteka.ktu.edu/wp-
 content/uploads/sites/38/2017/06/06_Productivity_2ed_protected.pdf.

 23
13. “COVID-19 Brings Indoor Air Quality Monitoring Upfront.” World Green Building
 Council, 2020, www.worldgbc.org/news-media/covid-19-brings-indoor-air-
 quality-monitoring-upfront.
14. “Indoor Air and Coronavirus (COVID-19).” US EPA, 16 Dec. 2020,
 www.epa.gov/coronavirus/indoor-air-and-coronavirus-covid-19.
15. Lutz, James, Dunham-Whitehead, Camilla, Lekov, Alex, and McMahon,
 James. Modeling energy consumption of residential furnaces and boilers in U.S.
 homes. United States: N. p., 2004. Web. doi:10.2172/829987.
16. Environment Accounts and Statistics Division. “Households and the Environment:
 Energy Use: Table 4–2 — Average Household Energy Use, by Household and
 Dwelling Characteristics, 2011 — Size of Heated Area.” Statistics Canada, 27 Nov.
 2015, www150.statcan.gc.ca/n1/pub/11-526-s/2013002/t006-eng.htm.
17. Office of Energy Efficiency. “Heating With Gas.” Natural Resources Canada, Oct.
 2012, pp. 1–60.
18. Federal Energy Management Program. “Purchasing Energy-Efficient Residential
 Furnaces.” Office of Energy Efficiency & Renewable Energy, U.S. Department of
 Energy, 2018, www.energy.gov/eere/femp/purchasing-energy-efficient-
 residential-furnaces.
19. Natural Resources Canada. “Energy Use in Canada: Trends Publications |
 Natural Resources Canada.” Enerty Use in the Residential Sector, Government of
 Canada, 2017,
 oee.nrcan.gc.ca/publications/statistics/trends/2017/residential.cfm#L2.
20. Minister of Environment and Climate Change, 2020. “National Inventory Report
 1990–2018: Greenhouse Gas Sources and Sinks in Canada.” United Nations
 Framework Convention on Climate Change, 2020, pp. 1–82. Pollutant Inventories
 and Reporting Division,
 publications.gc.ca/collections/collection_2020/eccc/En81-4-2018-3-eng.pdf.
21. Government of Canada. “Provincial and Territorial Energy Profiles.” Canada
 Energy Regulator, 29 Jan. 2021, www.cer-rec.gc.ca/en/data-analysis/energy-
 markets/provincial-territorial-energy-
 profiles/#:~:text=Provincial%20and%20Territorial%20Energy%20Profiles%20explores
 %20these%20systems%20by%20providing,discussions%20about%20energy%20in%2
 0Canada.
22. Köhl, Michael et al. “The impact of tree age on biomass growth and carbon
 accumulation capacity: A retrospective analysis using tree ring data of three
 tropical tree species grown in natural forests of Suriname.” PloS one vol. 12,8
 e0181187. 16 Aug. 2017, doi:10.1371/journal.pone.0181187
23. CO2 Meter. “Could Global CO2 Levels Be Reduced by Planting Trees?” CO2
 Meter, 21 Sept. 2020, www.co2meter.com/blogs/news/could-global-co2-levels-
 be-reduced-by-planting-
 trees#:%7E:text=While%20a%20typical%20hardwood%20tree,into%20the%20air%2
 0each%20year.
24. Urban, Ryan. “Electricity Prices in Canada (Updated 2021).” Energyhub.Org,
 Energy Hub, 11 Mar. 2021, www.energyhub.org/electricity-
 prices/#:%7E:text=The%20average%20residential%20price%20of,if%20you%20excl
 ude%20the%20territories

 24
You can also read