MODELING SUSTAINABLE ELECTRICITY SYSTEMS FOR THE BALTIC SEA REGION - Uni Flensburg
←
→
Page content transcription
If your browser does not render page correctly, please read the page content below
ZENTRUM FÜR NACHHALTIGE ENERGIESYSTEME (ZNES)
CENTRE FOR SUSTAINABLE ENERGY SYSTEMS (CSES)
Department System Integration

                 MODELING SUSTAINABLE
                 ELECTRICITY SYSTEMS FOR
                 THE BALTIC SEA REGION

                 A research project study within the Master’s
                 programme “Energy and Environmental
                 Management in Industrialised Countries"

                November 2012

                 Discussion Paper 3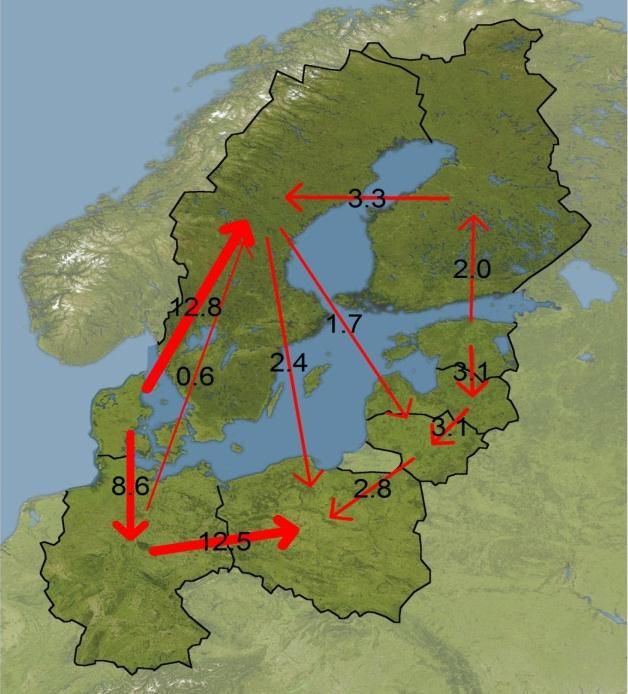
Modeling Sustainable Electricity Systems of the Baltic Sea Region

Authors:

B.Eng. Nicolas Bernhardi
Dipl.-Wirt.-Ing. Gesine Bökenkamp
B.Eng. Marian Bons
B.Eng. Rasmus Borrmann
B.Eng. Marion Christ
B.Eng. Lauren Grüterich
B.Eng. Emilie Heidtmann
M.Eng. Martin Jahn
B.Eng. Tomke Janssen
B.Eng. Jonas Lesch
B.Eng. Ulf Philipp Müller
B.Eng. Johannes Pelda
B.Eng. Isabelle Stein
B.Eng. Eike Veddeler
B.Eng. David Voß
B.Eng. Lukas Wienholt
Dipl.-Wirt.-Ing. Frauke Wiese
M.Eng. Clemens Wingenbach

University of Flensburg
Zentrum für nachhaltige Energiesysteme (ZNES)
Centre for Sustainable Energy Systems (CSES)

i² - Interdisciplinary Institute for Environmental, Social and Human Studies
Department Energy and Environmental Management
Munketoft 3b
24937 Flensburg
Germany
Internet: www.znes-flensburg.de

Flensburg, November 2012

Diskussionsbeiträge 3
Discussion Paper 3
ISSN: 2192-4597

                                                  -1-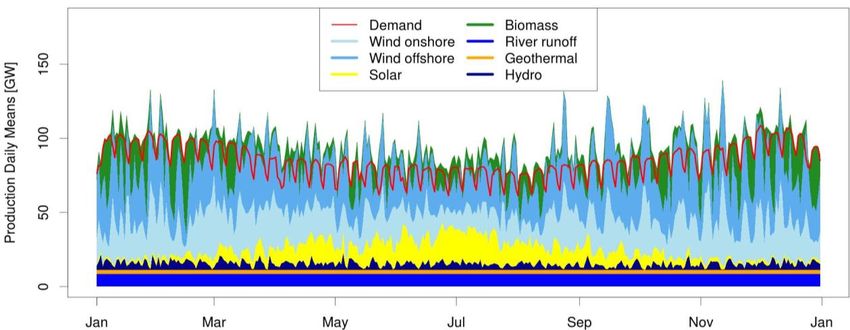
Modeling Sustainable Electricity Systems of the Baltic Sea Region
Executive summary

Executive summary
In the context of climate change the need for a sustainable energy system becomes more and more
apparent. The European Commission developed an “Energy Roadmap 2050” that includes the EU’s
commitment to reduce its greenhouse gas emissions to 80-95% below 1990 levels by 2050, promotes
a stronger use of renewable energies and a higher independency of energy imports in an
economically feasible way. The aim of this study by CSES was the simulation of a 100% renewable
electricity scenario for the Baltic region countries in 2050. This was done with the simulation model
renpass (Renewable ENergy PAthways Simulation System) which was developed by the Centre for
Sustainable Energy Systems (CSES) at the University of Flensburg. The simulation model uses the
open-source software tools MySQL and R.

To model a variety of pathways and solutions for a sustainable electricity system different scenarios
have been developed to identify the most important parameters for a secure supply in 2050. Input
parameters were the installed power plants and storages, the renewable energy potentials, the
electricity demand, the grid capacity of the interconnectors and weather data for the eight countries
Germany, Poland, Lithuania, Latvia, Estonia, Finland, Sweden and Denmark. Various scenarios for the
different parameter of possible development pathways have been combined to find a base scenario
that fulfils the aim of supplying the electricity demand of the target region.

The base scenario assumes conservative renewable potentials (economic potentials) and grid
enhancements (grid as planned until 2015), a high efficiency regarding the demand in 2050 (-20%
following the EU goals until 2020), a moderate extension of storage options and the deployment of
biomass for flexible electricity production. This system produces in total about 98 TWh per year more
electricity than the countries will consume in 2050. More than half of the produced electricity comes
from wind offshore and onshore (36 and 24% respectively), about 14% from biomass and 10% from
PV. In 2050 especially Lithuania, Poland and Sweden are net importers while Germany and Denmark
can produce significantly more electricity than they would need to cover their domestic demand.
With the current base scenario parameter settings the system will still have a few hours per year in
2050 when the renewable production cannot cover the demand. Regarding the fact that further
connections of the countries to other neighbouring countries have not been taken into account it can
be assumed that those gaps can be closed with imports (especially since the possible export amounts
of electricity exceed the currently necessary import). At times there are also situations when the
renewable production is too high and has to be shut off.

Several variations of the base scenario have been simulated to determine sensitivities of the system.
It can be seen that the high flexibility of biomass production plays an important role in covering peak
demands and that the expansion of the grid does not seem to be highly necessary. In fact the
flexibility of the biomass production seems to have a bigger impact on the covering of overdemands
than grid enhancements. The size and technology of storages also does not seem to make a very big
difference and highlights the importance of the utilization of flexible biomass production as
supplement or even replacement for storage or grid enhancements. The system also works without
the large Norwegian storage capacities. Another outcome is the necessity to increase the expansion
rate of renewable production capacities in order to replace the decreasing fossil capacities, especially
in Poland.

                                                  -I-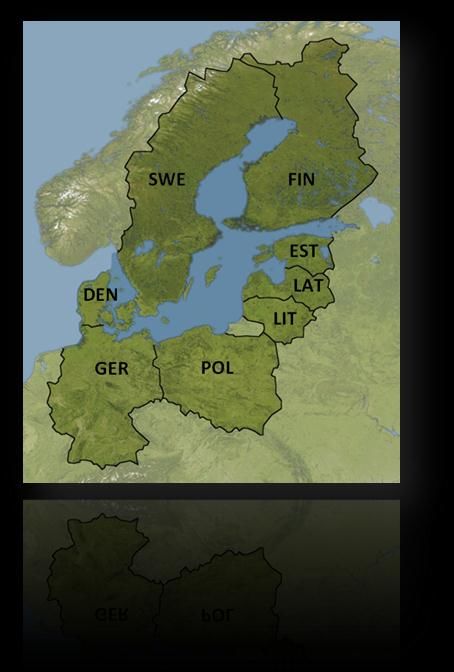
Modeling Sustainable Electricity Systems of the Baltic Sea Region
Executive summary

Key conclusions are:

 1.   A 100% renewable electricity system for all Baltic region countries is possible even under
      conservative assumptions. However the installation of renewable production capacities needs
      to be ramped up in the years until 2050 to compensate the scheduled gradual phase-out of
      fossil power plants.
 2.   Biomass as flexible electricity production holds a key role for the system stability. To ensure
      the necessary enhancements a market structure with effective incentive schemes (e.g.
      capacity market mechanisms) needs to be established.
 3.   The grid transmission capacities between the countries are often not used to capacity in 2050
      although they might well be very busy in the years in-between. A 100% renewable electricity
      system in 2050 probably does not need the full capacities anymore. Flexible biomass power
      plants can potentially decrease the necessity of large transmission capacities.
 4.   A 100% renewable electricity system in the countries surrounding the Baltic is even without
      imports from the huge Norwegian pump storage potential. The production of renewable
      energies balances itself within the considered region sufficiently.
 5.   Such a system is not extremely expensive. The roughly calculated costs for the expansion of
      renewable energy capacities, storage systems and grid capacities between the countries are
      around 50€/MWh.

The central conclusion of the scenario is that a 100% renewable electricity system for the Baltic Sea
Region in 2050 is possible. However, measures have to be taken to focus on flexible electricity
generation through customized energy market structures.

                                                - II -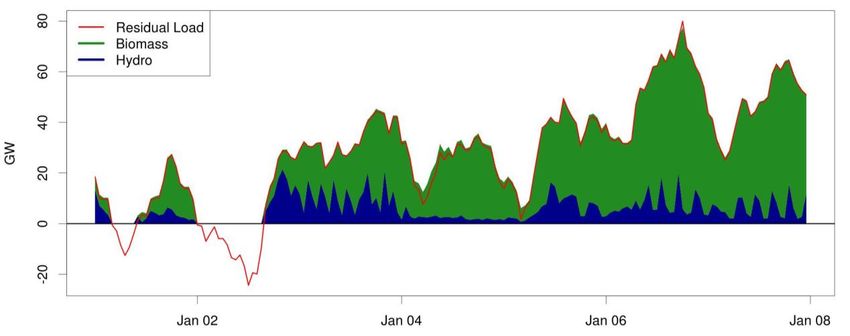
Modeling Sustainable Electricity Systems of the Baltic Sea Region
Table of Contents

Table of Contents

Executive summary .................................................................................................................................. I
Table of Contents ................................................................................................................................... III
List of Figures......................................................................................................................................... IIV
List of Tables ........................................................................................................................................... IV

1       Introduction ................................................................................................................................... 1
2       Simulation model renpass ............................................................................................................. 2
3       Modeling data input ...................................................................................................................... 4
    3.1        Fossil Power Plants .................................................................................................................. 4
    3.2        Renewable energy potential ................................................................................................... 5
    3.3        Demand ................................................................................................................................... 6
    3.4        Grid .......................................................................................................................................... 7
    3.5        Storage .................................................................................................................................... 8
    3.6        Costs ........................................................................................................................................ 9
    3.7        Weather Data ........................................................................................................................ 10
4       Scenario development ................................................................................................................. 12
    4.1        Scenario parameter ............................................................................................................... 12
    4.2        Parameter variations for a base scenario.............................................................................. 13
5       Results for the base scenario....................................................................................................... 15
    5.1        Demand and Electricity Production....................................................................................... 15
    5.2        Residual Load and overdemand ............................................................................................ 17
    5.3        Imports and exports .............................................................................................................. 17
    5.4        Renewable energy reduction ................................................................................................ 19
    5.5        Costs ...................................................................................................................................... 19
6       Base scenario sensitivities and results ........................................................................................ 21
    6.1        Capacity and mix of renewable energies .............................................................................. 21
    6.2        Necessary grid capacities ...................................................................................................... 22
    6.3        Storage capacities.................................................................................................................. 23
    6.4        Pathway steps towards 2050 ................................................................................................ 24
7       Evaluation..................................................................................................................................... 25
    7.1        Input Data .............................................................................................................................. 25
    7.2        renpass simulation ................................................................................................................ 25
8       Conclusion .................................................................................................................................... 27

Literature ............................................................................................................................................... 29

                                                                           - III -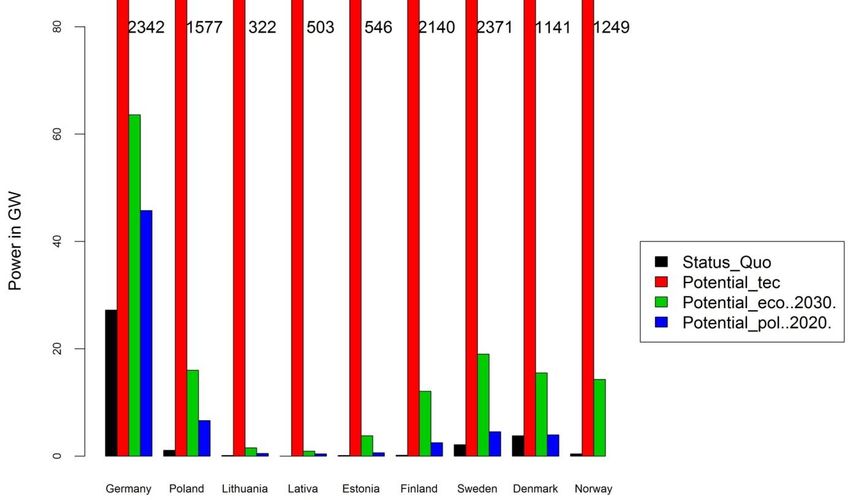
Modeling Sustainable Electricity Systems of the Baltic Sea Region
Lists of Figures and Tables
List of Figures
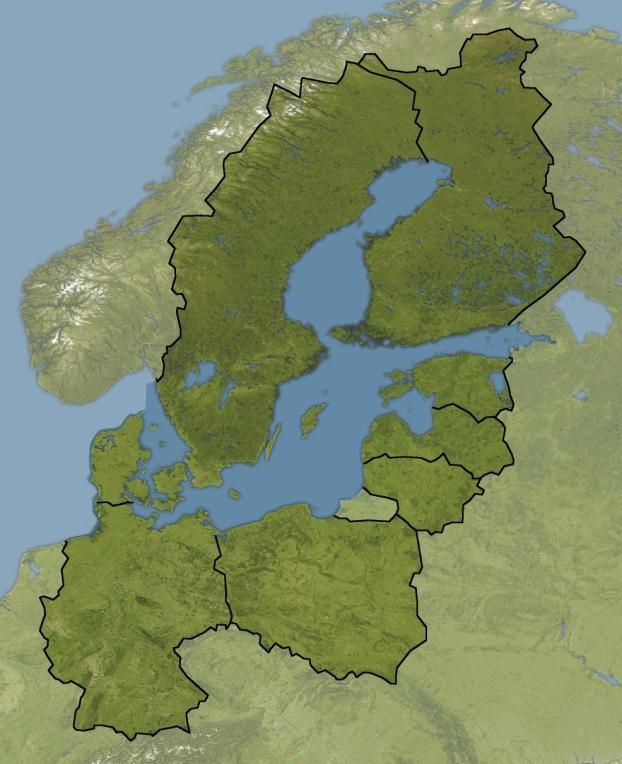
Figure 1: Map of the geographical scope of the study – eight countries bordering the Baltic Sea ........ 1
Figure 2: Schematic illustration of the modelling process ...................................................................... 2
Figure 3: Installed fossil fuel capacity in 2010 ......................................................................................... 4
Figure 3: Different types of potentials ................................................................................................... 5
Figure 4: Exemplary comparison of the status quo of installed onshore wind capacities with
economic, policital and technical potentials ........................................................................... 6
Figure 5: Summarized daily consumption for the Baltic region 2010 ..................................................... 7
Figure 6: Consumption 2010 by country ................................................................................................. 7
Figure 7: Assumed storage capacity scenarios for 2050 ......................................................................... 9
Figure 8: Location of the chosen weather stations .............................................................................. 10
Figure 9: Demand and renewable electricity production in 2050 for the whole Baltic Sea region ...... 15
Figure 10: Production and demand for each country in 2050 .............................................................. 16
Figure 11: Electricity production of the Baltic Sea region by source in 2050 in TWh ........................... 16
Figure 12: Residual load and biomass production in GW for the Baltic Sea region in January 2050.... 17
Figure 13: Net import 2050 in TWh ....................................................................................................... 18
Figure 14: Renewable energy shut-off for the Baltic Sea region in GW ................................................ 19
Figure 15: Technology-specific levelised costs of electricity by type .................................................... 20
List of Tables
Table 1: output parameters given by renpass......................................................................................... 3
Table 2: Currently installed capacity ...................................................................................................... 5
Table 3: Assumed economic potential in 2050 ...................................................................................... 6
Table 4: Summarized interconnector capacities ..................................................................................... 8
Table 5: Assumptions for investment and running costs of power plants and fuel prices in 2050 ........ 9
Table 6: Grid costs assumption ............................................................................................................. 10
Table 7: Overview over parameter scenarios ....................................................................................... 12
Table 8: Initial combinations of parameter scenarios .......................................................................... 14
Table 9: Export and import countries.................................................................................................... 18
Table 10: Scenario matrix for the analysis of sensitivities of renewable energy capacities ................. 21
Table 11: Scenario matrix for the analysis of sensitivities of grid capacities ........................................ 22
Table 12: Scenario matrix for the analysis of sensitivities of storage capacities .................................. 23
Table 13: Scenario matrix for the analysis of pathway steps towards 2050 ......................................... 24
- IV -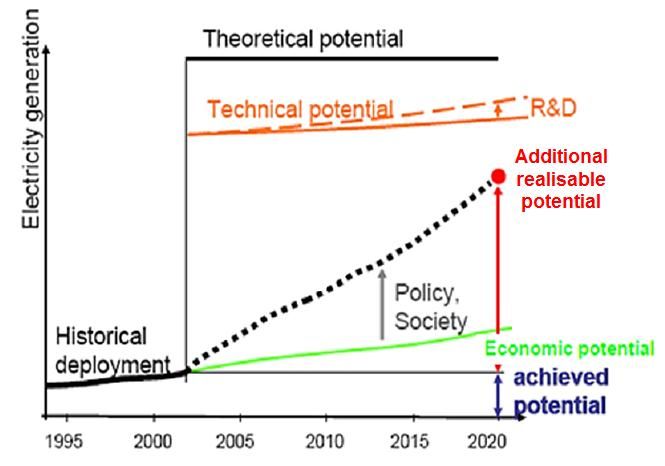
Modeling Sustainable Electricity Systems of the Baltic Sea Region
Introduction

1 Introduction
In the context of climate change and with dwindling fossil resources the need of a more sustainable
energy system becomes more and more apparent. The European Commission developed an “Energy
Roadmap 2050” that includes the EU’s “commitment to reducing greenhouse gas emissions to 80-
95% below 1990 levels by 2050 in the context of necessary reductions by developed countries”
(European Commission, 2011, p. 2). It promotes a stronger use of renewable energies as a way to
reduce the greenhouse gas emissions and to achieve a higher independency of energy imports in an
economically feasible way.

                                                    SWE                 FIN

                                                                        EST

                                          DEN                            LAT
                                                                      LIT

                                            GER            POL

Figure 1: Map of the geographical scope of the study – eight countries bordering the Baltic Sea

Following the idea of the EU roadmap, the objective of this study is the development of a 100%
renewable electricity supply scenario for the Baltic Sea Region in the year 2050. The Centre for
Sustainable Energy Systems (CSES) at the University of Flensburg has developed the open-source
modeling software renpass (RENewable PAthway Simulation System) with which the Baltic Sea
countries (see Figure 1) were simulated. Detailed data on the energy systems, the economies and the
climate were collected and their interrelations in terms of the electricity systems were examined.
Subsequently different scenarios have been developed to identify the most important parameters for
a secure electricity supply in 2050.This report shows one possible scenario for a 100% renewable
electricity system in the Baltic Region.

The study was part of the summer semester 2012’s curriculum of the Master’s programme “Energy
and Environmental Management in Industrialised Countries” and has been conducted between April
and October 2012 by 14 students and four lecturers. The beginnings of cooperation with several
Baltic institutions were started during the course and the results presented at the Tallinn University
of Technology in July 2012.

                                                          -1-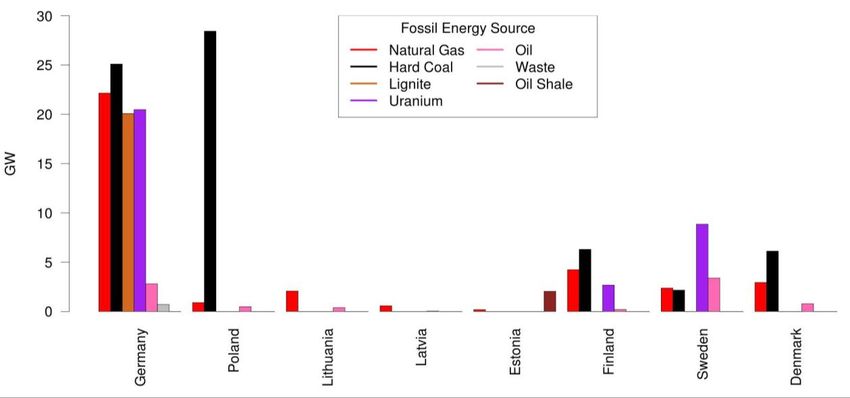
Modeling Sustainable Electricity Systems of the Baltic Sea Region
Simulation model renpass

2 Simulation model renpass
The modeling of a sustainable electricity scenario is based upon the simulation model renpass
(Renewable ENergy PAthways Simulation System) for the electricity sector that is currently under
development at the University of Flensburg’s Centre for Sustainable Energy Systems (CSES). It is yet
in a test phase thus one of the aims of the course has been the testing of the model’s functionality.

The core of renpass is the program code that is built on the open-source platform and programming
language R and works in combination with a respective MySQL database management system which
stores the necessary data (see Figure 2). One of the aims of the open-source approach is to facilitate
international research collaboration. R ultimately connects the renpass simulation with the database,
i.e. it reads data from the database and writes the results into the database. renpass can be used for
quantitative analysis of the electricity sector.

Input data for the modeling are the existing fossil power plants, assumed renewable energy
installations, demand curves, information on grid and storages as well as data on costs and the
weather. Each data set defines a certain state of the electricity system that will be simulated. The
model has been only operating for the grid regions of Norway and Germany before the extension in
within this study. First calculations have proven the viability of the model.

Figure 2: Schematic illustration of the modelling process

The first step of the simulation is the so-called national dispatch (cp. Figure 2). It is mainly driven by
the feed-in of non-dispatchable renewable energies and the load. For each time step renpass
calculates the renewable electricity production on the basis of the weather data. The feed in power
of the volatile renewable electricity sources primarily depends on the assumed capacity of the
respective scenario in combination with the weather data. For the electricity fed in by wind power
plants and PV parks the power production is calculated with algorithms that convert e.g. the wind
speed or solar radiation into a power production. The algorithms themselves are based on
performance curves. By deducting the currently produced renewable power from the demand the
model determines the residual load that has to be covered by the dispatchable power plants
(including existing storage capacities). The dispatchable power plants are used in order of their

                                                            -2-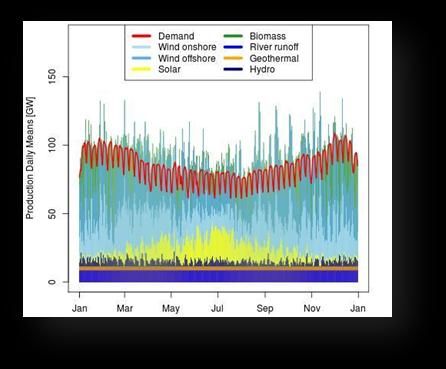
Modeling Sustainable Electricity Systems of the Baltic Sea Region
Simulation model renpass

production costs. In the next step (international balance), the electricity is exchanged between the
regions to level out the prices as far as grid capacity will allow.

Each model run covers one year in 15-minute-steps (35,040 steps and result data sets per year
calculated) or one-hour-steps (8,760 per year). However due to limitations of the processing time it is
set to one-hour-steps for this project. The input parameters will be varied for different scenario runs.
The given output parameters are shown in Table 1.

Table 1: output parameters given by renpass

                 Output parameter (per time interval)                        Unit
                 Power production per technology                             [MW]
                 Cable flow/grid usage                                       [MW]
                 Direction of flow and frequency of changes in direction     [-]
                 Approximate prices in each grid region                      [€/MWh]
                 Approximate prices in each grid region (after exchange
                                                                             [€/MWh]
                 between the grid regions)
                 Filling level of storage reservoirs                         [Mio. m³]
                 Water spillage                                              [Mio. m³]
                 Pumping power per pump                                      [MW]
                 Renewable energy curtailment                                [MW]
                 Excess demand                                               [MW]

The main output of the scenario calculations is hourly data on the electricity production for every
country and every production technology. Other indicatirs are data on the exchange between the
countries including various prices and the influence of the exchange on the electricity price. Although
at the current development stage of the model the price does not equal a “real” electricity price. It is
rather an indicator for the balance or imbalance between the grid regions with regards to exchange
capacities.

Furthermore, hourly data on the carbon dioxide emissions, the possibly resulting overdemand and
the residual load are given as results by the model. The reduction of renewable energies and the
influence of storage capacities on this reduction and the resulting filling level of the hydro storage
capacities are outputs as well. All the results are stored in form of tables in the MySQL data base,
which makes a detailed analysis possible. To get a first impression about the most important
outcomes of the model some of the outputs are visualized in graphs which are automatically created
for every scenario by the modeling tool.

Although the program is able to model any kind of future scenario, the underlying idea is to show
how a possible sustainable electricity system could look like.

                                                     -3-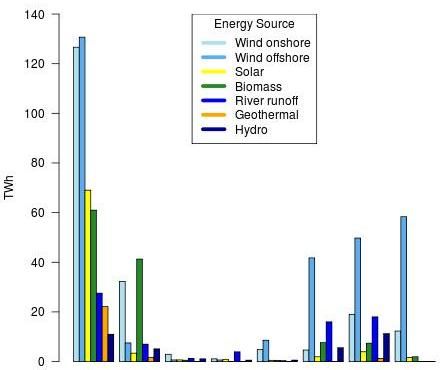
Modeling Sustainable Electricity Systems of the Baltic Sea Region
Modeling data input

3 Modeling data input
The input data which are required to calculate the scenarios are primarily data which describe the
status quo of the electricity system in each country. Variations of the values for each coutry also
define the respective scenarios for the future. The parameters characterising the electricity systems
are the production capacities of fossil power plants and renewable energies, the demand as well as
the grid and storage capacities. Additional important information is the representative weather data.

3.1 Fossil Power Plants
The fossil power plants data base defines the status quo for the year of 2010. It is based on
information by the U.S. Energy Information Administration (U.S. Energy Information Administration,
2012), the International Energy Agency (International Energy Agency (EIA), 2012), the European
Commission (European Commission (Directorate-General for Energy and Transport), 2008) and the
German Federal Network Agency (Bundesnetzagentur, 2012).

Whereas for Germany the Bundesnetzagentur’s database includes power plant sharp information
(e.g. with the year of construction) the sources for the other countries only include summarized
production capacities by technology. To calculate the virtual phase-out of those power plants it was
assumed that with an average lifetime of 30 years and an average construction year of 1990 each
year from 1975 to 2005 (i.e. 1990 +/- 15 years) a 30th of the overall capacity has been installed. If for
example a country has 30 GW of coal power plants each year from 1975 to 2005 1 GW were
assumably installed and subsequently beginning in 2005 until 2035 each year 1 GW will be
decommissioned after 30 years of lifetime. Furthermore it is assumed that in order to achieve a 100%
renewable electricity supply by 2050 retired fossil power plants will not be substituted with new
power plants. Thus fossil energy production slowly fades out linearly as given by the respective
lifetimes of the individual power plants. Figure 3 shows the installed capacities of fossil power plants
in 2010.

Figure 3: Installed fossil fuel capacity in 2010

                                                   -4-
Modeling Sustainable Electricity Systems of the Baltic Sea Region
Modeling data input
3.2 Renewable energy potential
Similar to the database of the installed fossil power plants a database with the currently installed
capacity of renewable energies has been collected for each country based on different studies (the
European Wind Energy Association, the International Energy Agency or the Geothermal Energy
Association). Additionally various sources have been analysed to determine possible scenarios for
different extension pathways for the installation of renewable capacities until 2050 (technical,
economic and political potential, see Figure 4).
Figure 4: Different types of potentials (adapted from (Resch, Faber, Haas, Ragwitz, Held, & Konstantinaviciute, 2006, p.
16))
Data for en economic potential of the different countries in the Baltic Sea region has been taken
from a study by the German Aerospace Centre (DLR, (Trieb, et al., 2006)). The economic potential is
defined as “those with a sufficiently high performance indicator that will allow new [power] plants in
the medium and long term to become competitive with other renewable and conventional power
sources, considering their potential technical development and economies of scale” (Trieb, et al.,
2006, p. 44). The economic potential includes data for wind onshore, wind offshore, photovoltaic,
biomass plants, run-of-river and geothermal energy. The tables 2 and 3 show the current installed
capacity and the assumed economic potentials for the extension of the installed renewable capacity
in 2050.
Table 2: Currently installed capacity (in GW)
2011
Country Wind Wind PV Biomass Run-of- Geothermal Total
Onshore Offshore river
Germany 27.1 0.1 24.9 4.9 4.3 0.01 61,3
Poland 1.1 - - 0.1 0.8 - 2,0
Lithuania 0.2 - - 0.02 0.1 - 0,3
Latvia 0.03 - - 0.01 1.5 - 1,5
Estonia 0.2 - - - 0.01 - 0,2
Finland 0.2 0.03 0.01 1.8 3.1 - 5,1
Sweden 2.0 0.2 0.02 3.2 3.2 - 8,6
Denmark 2.9 0.9 0.02 0.6 0.01 - 4,4
Total 33,7 1,2 25,0 10,6 13,0 0,01 83,6
-5-Modeling Sustainable Electricity Systems of the Baltic Sea Region
Modeling data input
Table 3: Assumed economic potential in 2050 (in GW)
2050
Country Wind Wind PV Biomass Run-of- Geothermal Total
Onshore Offshore river
Germany 50.8 32.0 67.2 10.4 5.2 3.0 168,6
Poland 14.0 2.0 3.4 6.8 1.3 0.2 27,7
Lithuania 1.4 0.2 0.7 1.7 0.2 - 4,2
Latvia 0.8 0.2 0.7 0.4 0.7 - 3,4
Estonia 1.8 2.0 0.5 0.5 0.1 - 4,9
Finland 2.1 10.0 2.1 7.0 3.0 - 24,2
Sweden 8.0 11.0 4.7 10.4 3.4 0.2 37,7
Denmark 3.5 12.0 1.4 0.9 0.01 - 17,8
Total 82,4 69,4 80,7 38,1 13,9 3,4 288,5
The technical potential for each country was derived from (Trieb, et al., 2006) and (European
Environment Agency (EEA), 2009). Additional data for the political potential (i.e. the political
extension goals) have been taken from the respective National Renewable Energy Action Plans
(NREAP) of each country (European Commission, 2010). Both potentials were primarily used as
reference points for the variation of different scenario parameters in order to achieve a stable
electricity production (see chapter 4.1).
Figure 5: Exemplary comparison of the status quo of installed onshore wind capacities with economic, policital and
technical potentials
3.3 Demand
Data for the demand of each country are based on the ENTSO-E databases (European Network of
Transmission System Operators for Electricity (ENTSO-E), 2012). Complete data for all Baltic countries
could be retrieved for 2010 and 2011. For the modelling only data for 2010 was used due to the fact
that the weather data (see 3.7) for the same year were the most consistent. Figure 6 shows the
-6-Modeling Sustainable Electricity Systems of the Baltic Sea Region
Modeling data input
summarized daily consumption of all Baltic countries over the year 2010. The maximal demand was
174.9 GW, the minimal demand 74.6 GW.
Daily demand[GWh]
Figure 6: Summarized daily consumption for the Baltic region 2010
Figure 7: Consumption 2010 by country
3.4 Grid
In order to model and illustrate the hourly load flows between the Baltic countries, the transmission
capacities and their future development must be determined. Due to the simplification of the model
only the interconnection capacities with 110kV or more between the countries could be taken into
account. The grid structures within the countries as well as low-voltage interconnectors with less
than 110kV were not considered.
Existing transmission lines and their voltages were analyzed from ENTSO-E’s grid map ( European
Network of Transmission System Operators for Electricity (ENTSO-E), 2011). Since transmission lines
with the same voltages do not necessarily have the same capacity, further research on the capacity
of each interconnecting line was necessary. For the Scandinavian countries and their neighbors,
-7-Modeling Sustainable Electricity Systems of the Baltic Sea Region
Modeling data input
NORDEL, the former association of Scandinavian transmission system operators (TSO), could provide
this information (NORDEL, 2008, p. 13). Similarly, but in a more detailed structure, the former Union
for the Coordination of the Transmission of Electricity (UCTE) published data for its continental
European member states (Union for the Coordination of the Transmission of Electricity (UCTE), 2009,
p. 155 ff.). Table 4 shows the determined summarized interconnector capacities between the
considered countries and their characteristics
Table 4: Summarized interconnector capacities
Country 1 Country 2 Electric flow Capacity 1 -> 2 Capacity 2 -> 1 type
[MW] [MW]
Germany Poland AC 3,408 3,408 land
Germany Denmark AC 1,650 1,100 land
Germany Denmark DC 600 600 sea
Germany Sweden DC 600 600 sea
Poland Lithuania AC 1,000 1,000 land
Poland Sweden DC 600 600 sea
Lithuania Latvia AC 1,950 1,750 land
Lithuania Sweden DC 700 700 sea
Latvia Estonia AC 1,050 1,100 land
Estonia Finland DC 1,000 1,000 sea
Finland Sweden AC 1,280 1,680 land
Finland Sweden DC 1,350 1,350 sea
Sweden Denmark AC 1,350 1,750 sea
Sweden Denmark DC 740 680 sea
As there is a constant development within the European grid the plans for a future enhancement of
transmission lines were analyzed. Only projects which are planned or under construction and will be
operating until around 2015 were considered (cp. ( European Network of Transmission System
Operators for Electricity (ENTSO-E), 2011)). Grid losses have been assumed with 8%.
3.5 Storage
The storage data base is calculated on the capacity values of power and storage of the U.S. Energy
Information Administration (U.S. Energy Information Administration, 2012), the International Energy
Agency (International Energy Agency (EIA), 2012) and the European Commission (European
Commission (Directorate-General for Energy and Transport), 2008).
The data comprise figures of total installed storage power capacity per country. The actual storage
capacity had to be additionally calculated using an average factor of power to energy capacity on the
basis of German pump storage power plants. The average value is 0.19, which means that the energy
capacity is about 5 times higher than the turbine power (i.e. a pump storage power plant can
produce on average about 5 hours on full load before the storage is empty).
Regarding the enlargement of pump storage facilities it is assumed that all hydroelectric power
plants and reservoirs are also used as pumped storage power plants. Their power and capacity was
calculated as described above. In addition the usage of other storage technologies e.g. battery
systems, compressed air or power to gas are assumed based on different studies (e.g. by the German
Federal Ministry for the Environment, Nature Conservation and Nuclear Safety) and geological and
geographical information for the countries. Due to already very high pump storage capacities no
additional storage capacity was added for Sweden, Latvia and Lithuania. The storage capacity was
-8-Modeling Sustainable Electricity Systems of the Baltic Sea Region
Modeling data input
calculated with a power to energy factor of 0.2 (i.e. 5 hours storage capacity at full load). The
assumed different storage capacities are shown in Figure 8.
[GW]
Figure 8: Assumed storage capacity scenarios for 2050
3.6 Costs
Data were collected for the investment and running cost of the fossil and renewable energy
production facilities, grid components and storage technologies (see Table 5). Assumptions for the
renewable energy technologies were derived from the study “Energy scenarios for an energy concept
of the German government” (Schlesinger, Lindenberger, & Lutz, 2010, pp. 38 -39). Compared to
other studies these assumptions can be considered as rather conservative, especially looking at the
costs of run-of-river power plants. The fuel prices were already implemented in the underlying model
data and initially taken from the “Pilot Study 2010” by the German Federal Ministry for the
Environment, Nature Conservation and Nuclear Safety (Nitsch, et al., 2010). Table 5 shows the cost
assumptions for the year 2050.
Table 5: Assumptions for investment and running costs of power plants and fuel prices in 2050
Technology Investment costs Running costs Fuel prices
[€2008/kW] [€2008/MWh] [€2008/GJ]
1
Hard coal - 6 22.82
1
Lignite - 5.6 5.44
1
Gas - 2.5 47.09
1
Oil - 5.6 62.21
1
Nuclear - 10.8 2.23
Run-of-river 4,345 50 -
Wind onshore 950 38 -
Wind offshore 1,350 74 -
Photovoltaic 1,000 26 -
Biomass 2,075 140 50.00
Geothermal energy 9,000 320 -
1
No additional fossil power plants assumed (see chapter 3.1)
Costs for pump storage facilities are based on the costs for run-of-river power plants, assuming the
same investment and running costs. The costs for other non-hydro storage options are estimated
based on a redox-flow battery according to one manufacturer (Prudent Energy, 2011). The
investment costs are given with 1,320 €/kW.
-9-Modeling Sustainable Electricity Systems of the Baltic Sea Region
Modeling data input
The grid costs are based on the data given in the recently published plan for the German grid
development (Feix, Obermann, Hermann, & Zeltner, 2012, p. 331), see Table 6. The lifetime of cables
is expected to be 40 years while overhead lines are considered to last for 80 years (Oswald, 2005).
Interest rates were generally fixed at 8%.
Table 6: Grid costs assumption
Cable type type Cable costs Converter costs (DC to AC)
[Euro/(MW*km)] [Euro/MW]
AC underground 2,800 -
AC overhead 560 -
DC sea 800 130
DC underground 700 130
DC overhead 700 130
3.7 Weather Data
In order to calculate the electricity production of renewable energy plants weather data, especially
the solar radiation and the wind speed, have to be considered on an hourly basis. For each country
weather data was used from five weather stations (MeteoGroup Deutschland GmbH, 2012). The
stations were mainly selected according to their geographical position within the countries to assure
a preferably even distribution which evens out extreme differences in the weather conditions (see
Figure 9). Weather data for five German stations was already implemented in the database
(Deutscher Wetterdienst (DWD), 2012).
Figure 9: Location of the chosen weather stations (white: onshore, blue: offshore)
- 10 -Modeling Sustainable Electricity Systems of the Baltic Sea Region
Modeling data input
One of the weather stations was always close to the shore to estimate the offshore wind potential.
For a better calculation of the offshore wind energy wind data from three German offshore research
platforms was used additionally. Data was provided by the R&D Centre Kiel University of Applied
Sciences (Forschungs- und Entwicklungszentrum Fachhochschule Kiel GmbH, 2012).
The weather database includes hourly information of wind speed, solar radiation and precipitation
(used for the filling level of pump storages and the calculation of the run-of-river). Data were
available for the years 1998, 2003 and 2010. 1998 was a particularly windy year whereas 2003 was
quite sunny.
The offshore wind data for each country was calculated as the mean value from two of the three
stations (for Germany and Denmark) or as the mean value from one of the offshore stations and the
onshore station which is the closest to the shore (for Sweden and Poland). In all other cases where
this approach did not make any sense due to the geographical location of the stations the data of the
onshore stations closest to the shore was used for the offshore calculations.
- 11 -Modeling Sustainable Electricity Systems of the Baltic Sea Region
Scenario development
4 Scenario development
Based on the analysed input data a number of scenarios for the year 2050 have been simulated in
which different parameters have been varied. In order to keep a focus on a sustainable electricity
scenario, three key research aspects were established:
1. Renewable energies: Which energy mix of renewable energies would provide the best
outcome for the scenario? How much additional renewable capacity has to be installed? Are
the economic potentials sufficient?
2. Grid: Which extension of the grid is necessary? Where is grid extension necessary? Where
are sensitivities in the grid network? Where are essential grid corridors?
3. Storage: How much storage enlargement is necessary? Is a system without import from the
Norwegian hydro storages possible? To what extend can flexible biomass power plants
replace other storage options?
4.1 Scenario parameter
In order to find a stable electricity system a number of scenarios and scenario parameters had to be
varied to find the optimal combination of configurations. Varied scenario parameters were the
expansion of installed renewable energy capacities and the development of the demand until 2050
as well as the development of the grid and storage infrastructure.
Table 7: Overview over parameter scenarios (colour code indicates pessimistic (red) to optimistic (green) assumptions)
Parameter scenario name Parameter scenario description
Renewable energy capacity
Economic Economic potentials
Self-Supply 1 Slight adjustment of the economic potentials to meet the countries respective
demands
Self-Supply 2 Cheap technologies: assumptions as in Self-Supply 1 scenario, but only expansion of
the three cheapest technologies in 2050 (according to (Faulstich, et al., 2011): wind
on- and offshore plus run-of-river (biomass, PV and geothermal energy capacities fixed
at 2011 status quo)
Self-Supply 3 More wind: assumptions as in Self-Supply 1 scenario, but no PV expansion and more
wind energy (on- and offshore)
1
Demand
Linear growth +30% growth in demand compared to 2010
Moderate No growth in demand (assumption: use of energy efficiency technologies)
efficiency
High -20 % growth in demand, assumption: forced use of energy efficiency technologies
efficiency (based on EU goal until 2020, delayed implementation until 2050)
2
Grid
Conservative Conservative: no additional enhancements over status quo 2015
Moderate Enhancements of grid by 30% until 2050
Extensive Extensive grid enhancements by 100% until 2050
1
Linear growth assumes specific growth rates for each country. For the high efficiency scenario given figures are average
changes over the whole Baltic region.
2
The given enhancements are assumed to be implemented across-the-board. No specific grid corridors were considered.
- 12 -Modeling Sustainable Electricity Systems of the Baltic Sea Region
Scenario development
Storage facilities
Status quo Storage capacities and technologies fixed at 2012 status quo
Upgrade All status quo (2012) hydroelectric power plants and reservoirs are also used as
hydro pumped storage power plants
All Assumptions as in upgrade hydro scenario, additional use of other storage
technologies technologies (e.g. battery systems, compressed air or power to gas)
Other minor parameters were the initial decision on the use of the weather data, the lifetime of
existing fossil power plants and the development of the fuel prices. For the weather year the use of
the data for 2010 was decided because it is the most average year in the existing data. The lifetimes
of fossil power plants were set to an average of 35 years. The fuel price development was considered
as moderate.
Bio-flex parameter
In order to examine the influence of flexible biomass as a potential replacement for grid or storage
enhancements a so-called “bio-flex parameter” was introduced as an additional indicator. With its
help the installed biomass capacity could be varied. It therefore represents a ratio between the
installed biomass production capacity (in MW) and the available energy from biomass (in MWh). The
underlying assumption is that the operation of biomass power plants can either be designed to feed-
in steadily or flexible depending on the residual load. The latter of which is related to higher
investment costs but offers the opportunity to be used as flexible electricity source because of the
larger installed capacity. Biomass will in this case just produce electricity when it can't be supplied by
weather dependant renewable energies like wind and PV.
Since the total amount of electricity that can be produced from biomass within a year is limited this
assumption implies less full load hours per biomass power plant. A bio-flex indicator of 2 for example
means that the installed capacity has been doubled compared to the economic potential, thus half as
much full load hours. However the total electricity produced by biomass will remain at the level of
the economic potential. Biomass can therefore be partly also considered as storage technology since
the biogas production or biomass harvest respectively can be continued and the energy be stored
while the biomass power plant itself might not be running constantly.
4.2 Parameter variations for a base scenario
The first step was to broadly determine a base scenario with a stable electricity supply. The aim was
to combine the above mentioned parameter variations in order to be able to match the demand for
every hour and every country as good as possible. This means that there should be as few power
shortages as possible in such a system. Additionally the aim was to limit the curtailment of the
renewable energy production which is the case when renewable energies could produce a lot of
energy while the demand is low and storage and grid transmission capacities are fully used. The
initial simulation combinations are shown in Table 8.
- 13 -Modeling Sustainable Electricity Systems of the Baltic Sea Region
Scenario development
Table 8: Initial combinations of parameter scenarios
Scenario name Renewable energy Demand Grid Storage
capacity
Conservative Economic Linear growth Conservative Status quo
Moderate Economic Moderate efficiency Moderate Upgrade hydro
Optimistic Self-Supply 3 High efficiency Extensive All technologies
Self supply Self-Supply 1 High efficiency Conservative All technologies
Ultra grid Self-Supply 2 Moderate efficiency Extensive Status quo
Base scenario Economic High efficiency Conservative Upgrade hydro
Based on the first simulation results and their analysis it turned out that the combination of the
economic potential of renewable energy capacities, a high efficiency concerning the demand (-20%
until 2050), a conservative grid expansion (expected status quo 2015), a moderately extended
storage status and a quite flexible electricity production from biomass met the criteria of the lowest
overdemand the best. This combination is henceforth referred to as the “base scenario”.
- 14 -Modeling Sustainable Electricity Systems of the Baltic Sea Region
Results for the base scenario
5 Results for the base scenario
5.1 Demand and Electricity Production
The total demand for all eight considered countries of the Baltic Sea region in 2050 is 740 TWh while
the total production from renewable sources sums up to 838 TWh. The result is an over production
of 98 TWh. Comparing to these yearly sums the demand and production has to be examined over the
course of the year. Figure 10 shows the demand and the electricity production by the different
renewable energy sources for the year 2050 for the whole Baltic Sea region.
Figure 10: Demand and renewable electricity production in 2050 for the whole Baltic Sea region
It can be seen that geothermal energy and run-of-river are used by the model as base load
throughout the year. Solar energy is able to cover a major share of the demand in the summer
months. Wind onshore and offshore is mostly used in the winter months when the wind speeds are
higher but is producing in the remaining months as well. There is an over production throughout the
year because the production of wind and solar electricity is higher than the electricity demand. The
situation occurs if there are not enough storage options or grid transmission capacities to
neighbouring countries. This leads to the forced shut-off of renewable energy production facilities.
The electricity production and demand summed up for each country is shown in Figure 11. Especially
Poland has to deal with a net overdemand because its production capacities are not big enough in
this scenario. The same applies to Sweden and Lithuania, although to a much lesser extent.
- 15 -Modeling Sustainable Electricity Systems of the Baltic Sea Region
Results for the base scenario
[TWh]
Germany Poland Lithuania Latvia Estonia Finland Sweden Denmark
Figure 11: Production and demand for each country in 2050
Figure 12 shows the electricity production by the different renewable energy sources for each
country in 2050. Wind offshore holds in total the biggest share of the different renewable energy
sources in 2050 with approximately 36 % followed by wind onshore with 24%. Biomass contributes
with 14%, PV with 10%, run-of-river with 9%, hydro storages with 4% and geothermal energy with
3 % to the production. Calculations for the intermediate years of 2020, 2030 and 2040 (see chapter
6.4) have shown that the solar and biomass energy shares were higher but have been replaced by
cheaper wind energy until 2050.
Germany Poland Lithuania Latvia Estonia Finland Sweden Denmark
Figure 12: Electricity production of the Baltic Sea region by source in 2050 in TWh
- 16 -Modeling Sustainable Electricity Systems of the Baltic Sea Region
Results for the base scenario
5.2 Residual Load and overdemand
The residual load describes the gap between the demand and the renewable energy production from
wind onshore and offshore, PV, run-of-river and geothermal sources. The overdemand is the
remaining gap after the flexible biomass and all available storages have been shaving off the residual
load peaks as far as possible. Figure 13 depicts the situation of the first week in January 2050.
Figure 13: Residual load and biomass production in GW for the Baltic Sea region in January 2050
The red line in Figure 13 shows the residual load that cannot be covered by wind, PV, river runoff and
geothermal sources. The maximum residual load during the depicted week reaches about 80 GW.
The green and blue areas show how flexible biomass and (hydro) storages can fill the gaps of the
residual load so that there is no overdemand during this week (there even is an over production
during the first two days).
One of the most important results of the base scenario is the use of flexible biomass. The calculations
of different scenario options have shown that no other storage system could cover the overdemand
in the same efficient way than a flexible biomass option. But it also has to be considered that the
installed biomass capacity has to be significantly increased and requires much higher investments.
5.3 Imports and exports
The balanced exchange of electricity between the different countries is shown in Figure 14. The
arrows indicate the amount of imported or exported electricity summed up over the year of 2050.
The numbers are given in TWh.
- 17 -Modeling Sustainable Electricity Systems of the Baltic Sea Region
Results for the base scenario
Figure 14: Net import 2050 in TWh
In absolute figures Germany for example has a net import from Denmark (totalling 8.6 TWh) as well
as net exports to Sweden (0.6 TWh) and Poland (12.5 TWh). Denmark as another example exports a
lot of electricity due to its high wind potentials and its comparatively low demand. The same holds
true for Estonia although on a lower level. Sweden and especially Poland are in contrast heavy
importers in absolute numbers. The figure shows as well that the grids in Germany, Finland and
Latvia are mostly used for transit in order to get the electricity from the centres of production to the
centres of the demand.
Especially Denmark seems to have a high dependency on its grid connections to Germany and
Sweden since its energy production is highly dependent on wind energy. Should there be a calm it
has little other options to substitute wind energy. Thus at times it can have an overdemand even
though Denmark is a net exporter of energy (see Table 9).
Table 9: Export and import countries
Export Produktion Export Import Demand Import
(TWh) (TWh) rate (TWh) (TWh) rate
Estonia -5,10 15,30 33% Lithuania 2,00 7,15 28%
Denmark -21,40 74,25 29% Poland 17,70 98,31 18%
Finland -1,30 77,60 2% Sweden 12,00 110,69 11%
Germany -4,50 447,99 1% (Latvia’s import/export rate is 0%)
- 18 -Modeling Sustainable Electricity Systems of the Baltic Sea Region
Results for the base scenario
5.4 Renewable energy reduction
The reduction of renewable energy production (i.e. their forced shut-off) is triggered in situations
when the demand and transmission capacities to neighbouring countries are not big enough to take
the renewable energy production (over production). As a result the production facilities have to be
shut off to avoid frequency problems in the grid. In comparison to the overdemand (demand >
production) the reduction can also be called over production (demand < production). Figure 15
shows the yearly development of the over production in 2050.
Figure 15: Renewable energy shut-off for the Baltic Sea region in GW
The calculated base scenario still has some hours over the course of the year with a small
overdemand (see 5.2). In contrast hours with an over production are much higher (approx. 5100
hours). During these times electricity of 77 TWh and up to a maximum of 88 GW cannot be used.
These figures seem to be very high but the consideration of only the Baltic Sea region countries
without any connections to neighbouring countries totally disregards such balancing exchange
possibilities. The bigger and more diverse the scope region is the more balanced will be overdemand
and production.
5.5 Costs
The costs calculations are based on the assumptions explained in chapter 3.6 and are not part of the
renpass optimization process (i.e. renpass at its current state optimizes the operation of installed
capacity but does not yet find the cost-optimal electricity system). The costs are only calculated after
the renpass model finishes its optimization. Investment costs are assumed to be at the 2050 level.
Technology-specific lifetimes are considered whereas interest rates and energy taxes are not.
Therefore the costs have to be taken as qualitatively rather than as absolute figures. Thus the costs
are especially useful for the comparison of different options. For this purpose the comparable cost
indicator of the so-called “levelized costs of electricity” (LCOE) was calculated. The levelized cost is
the price at which electricity must be generated from a specific source to break even over the
lifetime of the power plant.
- 19 -Modeling Sustainable Electricity Systems of the Baltic Sea Region
Results for the base scenario
Figure 16: Technology-specific levelised costs of electricity by type
In Figure 16 shows the technology-specific LCOE. In 2050 wind offshore is the cheapest technology
with around 25 €/MWh, followed by wind onshore and run-of-river (approx. 30 and 55 €/MWh
respectively). It is especially striking and reasonable at the same time that the LCOE of biomass
electricity are especially high since there has to be installed three times the capacity to achieve the
desired flexibility. Still biomass only contributes less than half the electricity than offshore wind
energy facilities do (see 5.1) and at the same time is more than eight times more expensive. But it
seems to be a necessary evil to secure a stabile system.
The total LCOE (i.e. the price at which the electricity can be produced in 2050) are at about
55€/MWh (5.5 ct/kWh) for the simulated system of the Baltic Sea region. In comparison the average
stock market price of electricity in Germany in 2011 was at 60 Euros/MWh (Brost, Rosenfeld, &
Vorholz, 2012). Of these 55€/MWh about 50€ fall upon the actual electricity production whereas the
storage costs make up only about 5 €/MWh. This is due to the cheap pump storage and because of
the fact that the flexible biomass actually serves as energy storage but appears as renewable energy
costs. Furthermore the grid costs are almost insignificant, tending close to 0€. This is mainly due to
the fact that the lifetimes of the grid components are very long and costs can be written off over long
time periods.
- 20 -Modeling Sustainable Electricity Systems of the Baltic Sea Region
Base scenario sensitivities and results
6 Base scenario sensitivities and results
Following the determination of a base scenario and the analysis of the results several minor
adjustments had to be made in order to identify more detailed sensitivities for the calculation of
additional scenarios and concerning the proposed research questions (see tables 10 to 13). Only
slight adjustments had to be made respectively to look at specific details.
6.1 Capacity and mix of renewable energies
With regard to the first research aspect (see chapter 4) it could be already seen from the initial
scenarios that the use of only the economic potentials seems to be enough to cover the demand.
Notwithstanding some slight adjustments for Poland had to be made as well as the bio-flex factor
varied (see Table 10).
Table 10: Scenario matrix for the analysis of sensitivities of renewable energy capacities
Scenario name Year RE Demand Grid Storage Bio-
capacity flex
Base scenario 2050 Economic High efficiency Conservative Upgrade hydro 3
Adjustment Poland 2050 Economic* High efficiency Conservative* Upgrade hydro 3
Static biomass 2050 Economic High efficiency Conservative Upgrade hydro 2
Flexible biomass 2050 Economic High efficiency Conservative Upgrade hydro 4
1) Scenario adjustment Poland:
Dissenting from the regular economic potential, the wind capacities for Poland and the grid
transmission capacities between Poland and Germany have been increased because
especially Poland could not fully cover its demand from renewable sources in the base
scenario. But it turned out that even with a higher production and exchange capacity
Poland’s overdemand remains almost unchanged.
2) Scenarios static and flexible biomass:
For those scenarios the bio-flex indicator was decreased (to 2) and increased (to 4)
respectively compared to the assumption in the base scenario (bio-flex = 3). The result is that
with a less flexible biomass production the peak overdemand increases from 9 to 20 GW. In
contrast the little overdemand in the base scenario could be totally covered with a highly
flexible biomass production.
It can be stated that the high flexibility of biomass production plays an important role in covering
peak demands. It can be also seen that especially Poland might possibly get problems covering its
demand at times because of the relatively low energy production potentials compared to a high
demand (subject to a more detailed look at the potentials and further simulation scenarios).
- 21 -You can also read