The influence of riders physical fitness domains on riding performance: A cross-sectional study
←
→
Page content transcription
If your browser does not render page correctly, please read the page content below
Masterarbeit
 MScPT 2015 ZHAW

 The influence of
 riders physical fitness domains
 on riding performance:
 A cross-sectional study

Autorin: Andrea Martina Aegerter1
Betreuungsperson: Christoph Michael Bauer1
 1
Beteiligte Institutionen: Zürcher Hochschule für Angewandte Wissenschaften,
 Departement Gesundheit, Institut für Physiotherapie,
 Technikumstrasse 71, CH-8400 Winterthur
 Vetsuisse-Fakultät Universität Zürich, Departement für Pferde,
 Winterthurstrasse 260, CH-8057 Zürich
Datum: 20.05.2018
Anzahl Zeichen: 19‘050
Inhaltsverzeichnis
I Manuskript .............................................................................................................................. 3
 TITLE PAGE ............................................................................................................................ 4
 ABSTRACT .............................................................................................................................. 5
 INTRODUCTION...................................................................................................................... 6
 METHODS ............................................................................................................................... 7
 RESULTS .............................................................................................................................. 11
 DISCUSSION......................................................................................................................... 14
 CONCLUSION ....................................................................................................................... 16
 AKNOWLEDGMENTS ........................................................................................................... 17
 COMPETING INTERESTS .................................................................................................... 17
 FUNDING .............................................................................................................................. 17
 REFERENCES ...................................................................................................................... 18
 SEPARATE FILE ................................................................................................................... 21
 SUPPLEMENTARY FILES ..................................................................................................... 22
 Supplementary file 1........................................................................................................ 22
 Supplementary file 2........................................................................................................ 24
II Appendix .............................................................................................................................. 27
 APPENDIX 1: AUTORENRICHTLINIEN DES GEWÄHLTEN JOURNALS ............................. 28
 APPENDIX 2: EIGENSTÄNDIGKEITSERKLÄRUNG ............................................................. 35
 APPENDIX 3: KRITISCHE WÜRDIGUNG DER EIGENEN ARBEIT....................................... 36
 APPENDIX 4: ERGÄNZENDE MATERIALIEN ....................................................................... 39
 APPENDIX 5: ETHIKKOMISSION-BEWILLIGUNG ................................................................ 48
 APPENDIX 6: BESTÄTIGUNG DER BETREUUNG ............................................................... 49
 APPENDIX 7: CURRICULUM VITAE DER VERFASSERIN ................................................... 50

Masterarbeit Andrea Aegerter 2
I Manuskript

Masterarbeit Andrea Aegerter 3
TITLE PAGE
The influence of riders physical fitness domains on riding performance: A cross-sectional
study
Andrea Martina Aegerter1, Michael Andreas Weishaupt2, Barbara Gubler1, Selma Latif2, Fabian
Marcel Rast1, Carole Pauli1, and Christoph Michael Bauer1
1
 Institute of Physiotherapy, School of Health Professions, Zurich University of Applied Sciences,
Winterthur, Switzerland; 2 Equine Department, Vetsuisse Faculty, University of Zurich, Zurich, Swit-
zerland.

Correspondence address
Andrea Aegerter, c/o Christa Wachter, Technikumstrasse 71, CH-8400 Winterthur, Switzerland |
christa.wachter@zhaw.ch | Phone: +41 (0) 58 934 64 89

Journal / Alternate journal
The British Journal of Sports Medicine / BMJ Open Sport & Exercise Medicine

Type of the manuscript
Original article

Word count
2898/3000

Masterarbeit Andrea Aegerter 4
ABSTRACT
Objectives Poor riding performance (RP) can be caused by medical issues of the horse and vari-
ous factors such as inadequate equipment and deficiencies in the training schedule or intensity.
The most neglected factor in current research is the physical fitness (PF) of the rider. The aim of
this study is therefore to investigate the influence of PF on the RP.
Methods 115 Swiss equestrians underwent a measurement of PF and RP. Seven domains of PF
(balance, endurance, flexibility, reaction time, speed, strength, symmetry) were assessed by a
physiotherapist. RP included the rating of a riding program by two national riding judges (RJs). The
riders’ demographics were collected using an online-survey. A linear model for RP that included
the domains of PF and potential confounders was fitted to the data. Inter-rater reliability of the RJs
was investigated by calculating the intraclass correlation coefficient.
Results The domains endurance, strength, and symmetry positively influence the RP, whereas
flexibility has a negative influence. Their explanation of variance in RP is 19.1 %. The regression
model and its coefficients are significant ( < 0.05) with the exception of the domain symmetry. No
such proof was found for the domains balance, speed, and reaction time. The inter-rater reliability
of the RJs can be interpreted as “good” to “excellent”.
Conclusion Findings suggest that PF is influencing the RP. PF training should therefore be in-
cluded in current training concepts. Future research should investigate whether similar conclusions
could be drawn with regard to equestrian promoting among the youth and top athletes.

Key words physical fitness, performance, regression analysis, equestrian, riding judge

Masterarbeit Andrea Aegerter 5
INTRODUCTION
More than 1.7% of the Swiss population rides occasionally.[1] Poor riding performance (RP) is of-
ten caused by medical issues with the horse.[2] In addition to these medical issues, factors such
as inadequate equipment, deficiencies in the training schedule, or intensity of training might reduce
the RP. However, the most neglected factor in current research is the rider himself/herself.[3]
A rider’s ability to ride not only requires practice and sensitivity to a horse’s movement, but it also
depends on his or her physical fitness (PF).[3] The two PF domains which were investigated the
most in past decades are flexibility and symmetry.[4-6] Flexibility is regarded as a precondition for
a supple seat whereas the symmetry of the rider is important for the stability of the horse and the
rider.[6-8] Both are considered very important with regard to RP.[4-6] In contrast, little considera-
tion is given to the physical domains of balance, endurance, reaction time, speed, and strength,
which are equally important.[9, 10]
To quantify the PF of the rider, a sport-specific test was created.[11] This test includes twelve tasks
for examining the motor skills of the riders. Disadvantageously, it is designed for juniors, particular
elements are not transmittable to equitation, and symmetry is not considered. Due to this low ap-
plicability, a revision of the existing sport-specific test is needed. This idea is supported by the
Swiss Federal Office of Sport and the Swiss Federal Institute of Sport, both of which focused on
performance diagnostics between the years of 2017-2020.[12]
So far, no study has yet investigated the influence of PF on RP quantitatively and it is still unclear
which domain of PF is the most important in horse riding. The results of this study could confirm
what the Swiss Olympic Association found: the result of sport-specific tests has a high predictive
validity to success on the elite level.[13]
From a physiotherapeutic point of view, the findings could be integrated in equestrian promoting
among the youth and added to current training concepts. Through this, the reputation of physio-
therapy in rider-specific issues could be strengthened and an interdisciplinary approach to riding
training could be sought. For the professional branch of physiotherapy, this could result in an ex-
tension of special fields and topics.
Therefore, the main question of this study is the following: What is the influence of the PF of the
Swiss equestrian population on the RP when it is measured by a test that includes the domains of
balance, endurance, flexibility, reaction time, speed, strength, and symmetry? It is hypothesized
that a higher PF leads to a better RP. No full justification of RP is expected from the PF.

Masterarbeit Andrea Aegerter 6
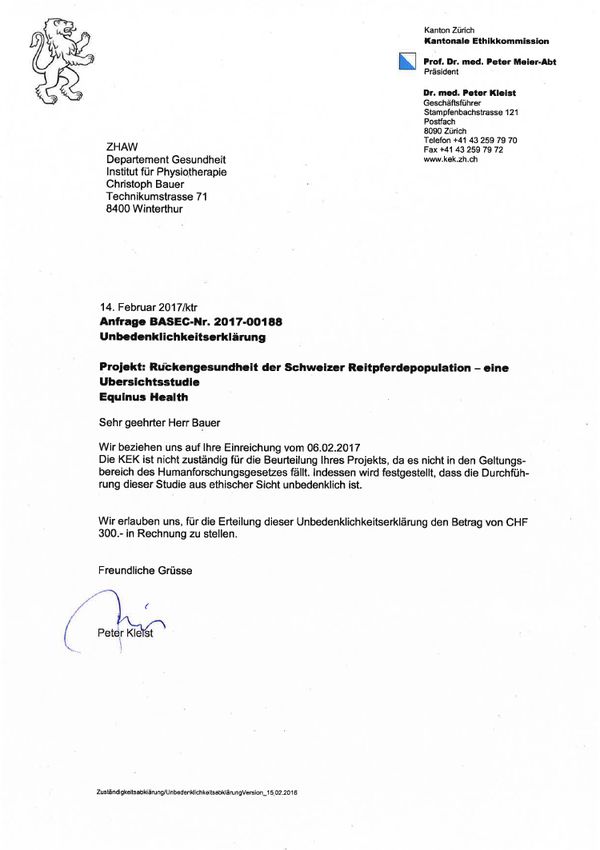
METHODS Setting The present work is a sub-study of the study “Back health of the Swiss riding horse population – a survey study” (ARAMIS-No. 2.16.10). A cross-sectional study was conducted from June to November 2017 at five different locations in the German and French speaking part of Switzerland.[14] The study is juristically verified by the local ethics committee (BASEC-No. 2017-00188). All participants gave written informed consent prior to the study. Participants A total of 120 Swiss equestrians (110 female and 10 male) were recruited through the official jour- nal of the Swiss Equestrian Federation. Inclusion and exclusion criteria are listed in Table 1. Volun- tary participants who fulfilled the criteria were randomly selected by an assistant and stratified to the sex of the horses, the distribution of the region, and riding-discipline, according to the Switzer- land-wide prevalence of horses in 2014.[1] Exclusion criteria were assessed by a veterinarian and a physiotherapist (PT) prior to the study. The required sample size was n ≥ 106 (Supplementary file 2).[15] Table 1: Inclusion and exclusion criteria Inclusion criteria Exclusion criteria being the main rider of the participating horse (at mini- discipline race-riding mum 2/ 3 of the time, at minimum one hour per week) acute illness, injury or other issues which restrict the age equestrian ≥ 18 self-determined usual riding ability of the participant age horse ≤ 18 horse or equestrian Procedure Experimental set-up The test conditions were standardized. All measurements were conducted blindly by the same three raters, one PT specialized in musculoskeletal disorders, and two national and independent riding judges (RJs). All of them underwent a training-session of at least eight hours. Physical fitness (PF) This one-hour test consisted of exercises for assessing the six main domains of PF (balance, en- durance, flexibility, reaction time, speed, strength) and the domain symmetry (Supplementary file 1).[16] It was carried out by the PT. Flexibility of the hip (flexion, extension, internal/external rota- tion, and abduction), knee (flexion) and foot (dorsiflexion) was measured on both sides by a digital goniometry (Halo Medical Devices, Perth, Australia). Balance was quantified on a three dimen- sional chair (BALIMO®WOOD; ADVIVINOVA GmbH, Quickborn, Germany) while performing static and dynamic balance exercises. Strength of the lower extremities (hip flexors, hip extensors, hip Masterarbeit Andrea Aegerter 7
abductors, hip adductors, and knee flexors), the back, and the core was assessed using the
handheld dynamometer microFET2® (Hoggan scientific, Salt Lake City, Utah, USA). Therefore,
the measurement process was adapted.[17] The smarTracks diagnostic sensor system from HU-
MOTION® (Humotion GmbH, Münster, Germany) was used for evaluating speed and reaction time
of the lower extremities. For upper extremities, the reaction time was compiled by the conventional
reaction test with a ruler.[18] A three-minute step test was performed to assess endurance.[19]

Riding performance (RP)
The ten-minute riding program included all paces (halt, walk, rising/sitting trot, and canter) at both
riding directions (Supplementary file 1). The program was read out loud and recorded by an auto-
follow camera (PIXIO®, MOVE’N SEE, Brest, France).

Demographics and confounders
Each participant’s background was collected with the use of an online survey to obtain data on
their experience (in years) in horse riding, frequency of practice (in hours per week), RP self-as-
sessment, and other demographics.

Variables and data processing
Primary outcomes
Physical fitness (PF)
The data of the six main domains of PF underwent a z-transformation (maximum: 100%). Sym-
metry was quantified using the symmetry index SI (Supplementary file 2) from the domains bal-
ance, flexibility, reaction time and strength.[20] In contrast to the other domains, absolute sym-
metry was set at 0%, asymmetry was associated with a higher percentage (> 0 %).

Riding performance (RP)
Retrospectively and independently from one another, each video was rated by two RJs. The rating
of the RP included twenty criteria (eg. rider’s seat), each of which was rated on a numeric rating
scale from one (not executed) to ten (excellent). The maximum of RP was 400 points (Supplemen-
tary file 1).

Secondary outcomes
Demographics and confounders
Nominal variables were presented as absolute and relative frequencies. For continuous variables,
means and standard deviations (SD) were given. Possible confounders, which were not included in
the statistical model for a theoretical reason, were analysed separately.

Reliability
The ratings of the two RJs were compared by calculating their inter-rater reliability.

Missing or incomplete data were excluded from the study.

Masterarbeit Andrea Aegerter 8
Statistics
Multiple regression
A linear model for RP that included the domains of PF, the potential confounders of body mass in-
dex (BMI), experience, and hours practiced were fitted to the data. Thus, the first model for each
observation of was
 = 0 + 1 + 2 + 3 + 4 + 5
 + 6 ℎ + 7 + 8 + 9 + 10 +
with 0 representing the intercept, the weight of the predictors and the independent and nor-
mal distributed errors ~ (0, 2 ).
A stepwise regression was performed backwards with optimisation by removing the predictor with
the smallest partial correlation with RP ( − − ≥ 0.1). The model was re-
duced to a set which provided the best possible and least complex understanding of the factors in-
volved in RP. To validate whether the predictors offer an explanation of RP, the significance of the
regression model was calculated with an F-test, and unpaired t-tests were used to obtain the signif-
icance of the regression coefficients. The coefficient of determination ( 2) specified the amount of
the variance of RP, which can be explained through the predictors. An explanation of 20-30% of
the variance in field research can be interpreted as good.[21] The meaningfulness of 2 was calcu-
lated by the effect size 2, which estimates the amount of variance that is explained by the model
(Supplementary file 2). Pearson correlation ( ) and linear regression should confirm that the re-
maining predictors are not independent of each other. To test for further confounder, Pearson cor-
relation of test motivation and the PF was calculated. In addition, Pearson correlation of RP and
RP self-assessment was investigated. Pearson correlation of = 0.1 indicates small, = 0.3 me-
dium and = 0.5 large linear relation.[22] Significance was set at ≤ 0.05.

Assumptions for multiple regression
Linearity between the RP and each predictor was investigated with a partial regression plot. A ran-
dom sample selection was based on the recruitment process. A scatter plot of the regression
standardised predicted value and regression standardised residuals were created to validate
whether the errors of the predictors have a mean of zero, ∑[ ]=0, and whether their variance
demonstrates homoscedasticity, ( ) = 2 < ∞. Autocorrelation of the error term is proven with
Durbin-Watson statistic, ( , ) = 0, ∀ ≠ , normal distribution of the error term by the consider-
ation of the histogram of the standardised residuals. Multicollinearity of the predictors was calcu-
 1
lated by the variance inflation factor VIF, = 1− 2.

Masterarbeit Andrea Aegerter 9
Reliability
Intraclass correlation coefficient ( ) estimates and their 95% confident intervals (CI) were calcu-
lated based on a single rating, absolute agreement, two-way mixed effects model.[23] values ≥
0.9 indicate excellent reliability, and values between ≥ 0.75 and < 0.9 indicate good reliabil-
ity.[24]

All data were analysed with SPSS 24 (IBM, Armonk, NY, USA).

STROBE Statement checklist was used for strengthening the reporting of observational stud-
ies.[25]

Masterarbeit Andrea Aegerter 10
RESULTS
Participants
Five participants were excluded: two due to short-term cancellation of the rider, two due to lame-
ness of the horse, and one due to missing data. 115 participants (106 female, 9 male) remained for
analysis. Table 2 shows the characteristics of the participants.

Multiple regression
Main result
The best possible and least complex regression model is shown in Equation 1. This equation illus-
trates that endurance, flexibility, strength, and symmetry are in fact influencing the RP. The coeffi-
cients of flexibility and symmetry are negative, which means that the direction of correlation is re-
versed (Table 3). The regression model and its coefficients are significant (p < 0.05) with the ex-
ception of the predictor symmetry (Table 3). 19.1 % of the variance in RP is explained by the four
aforementioned domains of PF (Table 4). The effect size 2 was medium ( 2 = 0.24; Supplemen-
tary file 2).

Assumptions of multiple regression
The assumptions of multiple regression are given. According to the recruitment process, a random
sample selection was carried out. Figure 1 shows the mean and the homoscedasticity of the error,
both of which are considered good. According to the Durbin-Watson statistic of 1.63 in Table 4, au-
tocorrelation of the error was not found. The histogram (Figure 2) in the Supplementary file 2 illus-
trates the normal distribution of the error. Multicollinearity of the predictors was not detected ( ≤
10, Table 3).

Linear regression and Pearson correlation
Graphically not shown, the Pearson correlation of the four predictors remaining in the model were
calculated. A correlation is only found between the domains strength and symmetry
( = −0.236, < 0.05). Linear regression of RP and each predictor except flexibility would be main-
tainable. The direction of correlation would remain the same, but model’s appropriateness and effi-
cacy would be smaller than in multiple regression ( 2 ≤ 0.112, 2 ≤ 0.13).
Pearson correlation of RP and RP self-assessment was = 0.269, = 0.001. Only small linear re-
lation was found between the test motivation and the domains of PF ( ≤ 0.158, ≥ 0.091).

Reliability
The level of inter-rater reliability of the two RJs can be interpreted as “good” to “excellent” ( =
0.901, 95% 0.856 − 0.931; Table 5).[24]

Masterarbeit Andrea Aegerter 11
Table 2: Descriptive statistics of the riders

 Riding performance (RP) Mean SD
 RP (0-400 points) 224.21 42.88
 RP riding judge 1 (0-200 points) 113.30 20.63
 RP riding judge 2 (0-200 points) 110.91 23.22
 RP self-assessment (NRS 0-10) 6.51 1.11
 Physical fitness (PF) Mean SD
 balance (%) 50.79 16.15
 endurance (%) 51.53 28.10
 flexibility (%) 50.47 13.57
 reaction time (%) 51.87 19.20
 speed (%) 49.72 20.96
 strength (%) 49.30 19.82
 symmetry (%) 34.01 18.32
 PF test motivation (NRS 0-10) 8.81 1.62
 Characteristics Mean SD
 age (years) 35.69 10.62
 body mass index (kg/m2) 23.15 3.45
 experience horse riding (years) 24.45 9.71
 practise horse riding (h/week) 8.24 3.51
 Further characteristics absolute frequencies (N) relative frequencies (%)
 sex
 female 106 92.2
 male 9 7.8
 riding level
 brevet 83 72.2
 licence 56 48.7
 riding discipline
 show jumping 39 33.9
 leisure riding 34 29.6
 dressage 30 26.1
 eventing 6 5.2
 endurance 3 2.6
 western 3 2.6
 Legend: N = number of participants, NRS = numeric rating scale, SD = standard deviation

 Equation 1: Regression model
 = 219.68 + 0.518 ∗ − 0.613 ∗ + 0.433 ∗ ℎ − 0.369 ∗ +

Masterarbeit Andrea Aegerter 12
Table 3: Regression coefficient, t-test and variance inflation factor

 regression coefficient 95%CI SE t Sig. VIF
 RP 219.680 180.185; 259.174 19.929 11.023 0.000
 endurance 0.518 0.259; 0.776 0.130 3.969 0.000 1.029
 flexibility -0.613 -1.153;-0.073 0.273 -2.249 0.027 1.049
 strength 0.433 0.060; 0.807 0.188 2.298 0.023 1.069
 symmetry -0.369 -0.777; 0.038 0.205 -1.798 0.075 1.086

 Legend: CI = confidence interval, RP = riding performance, Sig. = significance, SE = standard error, t = t-Test, VIF =
 variance inflation factor

 Table 4: Adjusted R Square and Durbin-Watson statistic

 Adjusted R Square Durbin-Watson
 Model 0.191 1.630

 Legend: R Square = coefficient of determination

 Table 5: Intraclass correlation coefficient

 ICC 95%CI Sig.
 RJ 1 & 2 0.901 0.856; 0.931 0.000

 Legend: CI = confidence interval, ICC = intraclass correlation coefficient, RJ = riding judge, Sig. = significance

Masterarbeit Andrea Aegerter 13
DISCUSSION
Summary
The findings show that the predictors endurance, flexibility, strength and symmetry influence the
RP. Thereby, endurance and strength positively influence the RP whereas the influence of flexibil-
ity and symmetry on RP is negative. Quantified, the RP rises by 0.518 percent or 0.433 percent if
endurance or strength rises by one percent. On the contrary, the RP decreases by 0.613 percent
or 0.369 percent if flexibility or symmetry rises by one percent. All of these examples are only appli-
cable if the other variables remain constant. It must be noted that due to the definition of symmetry
in this work, its scaling and interpretation is reversed to all other domains of PF. The lower the SI,
the better the symmetry of the rider. Therefore, a positive influence of greater symmetry on the RP
can be stated. No influence on RP was found with regard to riders balance, reaction time, speed,
BMI, experience or practice in horse riding. A low linear relation of test motivation and the domains
of PF were found. Linear relation of RP and RP self-assessment was medium. The inter-rater relia-
bility of the RJs is considered as “good” to “excellent”.[24]

Interpretation and comparison with the literature
Physical fitness
Theoretically, it is reasonable to conclude that better endurance, flexibility, strength, and symmetry
are associated with higher RP. Similar to other sports, good aerobic endurance is beneficial in
horse riding.[11] A physiological adaption of flexibility due to riding could explain its negative pre-
diction on RP. Another explanation could be that the flexibility is low in favor of stability of the horse
rider. Both assumptions do not quite resemble other research, which regards flexibility as a precon-
dition for a supple seat.[7, 8] In order to consistently adjust in response to the movement of the
horse, the rider requires strong muscles.[26] Core and back strength endurance is responsible for
an upright sitting position.[11] Strength endurance of the thighs is needed for the aids and the ris-
ing trot.[11] It cannot be evaluated in this study whether the activity of core stabilizing muscles are
higher in experienced riders.[27] Different authors recognized rider’s asymmetry as a negative pre-
dictor for RP,[5, 28] which is also confirmed in this study. It is assumed that the rider’s symmetry
can improve the stability of the horse and rider, which would then lead to better harmony and riding
performance.[6] In contrast to theory, this work shows that rider’s balance, reaction time, speed,
practice and experience of horse riding do not interact with the RP.[3, 11, 29] Two reasons could
be responsible for this result: On the one hand, a theoretical overestimation of these factors. On
the other hand, a wrong test selection.

Reliability
The “good” or “excellent” ICC should enhance the reputation of the RJs. At the same time, this re-
sult shows that deviations in the judgement of horse riding must be expected.

Masterarbeit Andrea Aegerter 14
Appropriateness of the model
The achieved 19.1 % of explanation of variance is slightly below the 20-30%, which can be re-
garded as good in field research.[21] The reason could be that the requirement profile of a rider
comprises more skills than those examined in this study. Cognitive skills, such as anticipation and
decision making, seem to be essential.[9, 11, 30] In addition, coordinative skills, rhythm, and a se-
lectivity are demanded.[9, 11] Further factors outside of the rider’s body could have been consid-
ered within the study, for example the saddle and the health of the horse.

Limitations
The recruitment procedure required initiative on behalf of the rider and therefore could have intro-
duced a selection bias. Potential confounders of RP could be nervousness of horse and rider due
to the unusual conditions. The judgement of RP could be biased through a video-recording of only
two-dimensions and a riding program with a predominance of dressage criteria. The self-reporting
of the riders’ qualifications could lead to an information bias. In the statistical analysis, the interac-
tions between the predictors were not considered to reduce complexity of the model and improve
interpretability. Due to the low number of male riders and variety of disciplines, no subgroups were
made. Other relevant factors, such as the horse itself or the saddle, were not taken into account. If
so, then the results could only be generalized to hobby riders and not to all equestrians. Juniors or
top athletes, especially, were not given enough consideration in this work.

Masterarbeit Andrea Aegerter 15
CONCLUSION Findings suggest that PF is influencing the RP. The PF domains endurance, strength, and sym- metry positively influence the RP, whereas flexibility has a negative influence. No such proof was found for factors such as rider’s balance, reaction time, speed, BMI, practice and rider’s experi- ence. Further factors could have been considered outside the rider, such as the saddle and health of the horse. Further research PF in non-riders and different bilateral sports should be examined for comparing groups. Relation of back to core muscles or hip abductors to hip adductors as well as the SI would be worth men- tioning in particular. In addition, cognitive and coordinative skills should be investigated. Due to the interdisciplinary nature of the main project, further correlations with the saddle or the health of the horse should be considered. Physiotherapeutic relevance Besides sports PT, the Swiss Olympic Association and athletic coaches could be interested in the results of this study, which state a higher consideration of the riders PF. Thus, current training con- cepts should be adapted and PF training should be included. Special attention should be given in the domains endurance, flexibility, strength, and symmetry. Future research should investigate whether similar conclusions could be drawn with regard to equestrian promoting among the youth and top athletes. Summary box The PF domains endurance, flexibility, strength, and symmetry are influencing the RP. No influence was found in the PF domains balance, reaction time, and speed. Further factors would have been sought outside the rider. Masterarbeit Andrea Aegerter 16
AKNOWLEDGMENTS
We would like to express special thanks to Mr. Andreas Klose and Ms. Bettina Friedrich for their
help with the composition of the PF test.

Many thanks and appreciations also go to Ms. Monika Gutscher for her support during the whole
process of our data collection.

COMPETING INTERESTS
The authors declare that there are no conflicts of interest.

FUNDING
This work was supported by the Swiss Federal Food Safety and Veterinary Office (ARAMIS-No.
2.16.10).

Masterarbeit Andrea Aegerter 17
REFERENCES
1. Bianchi G. Sicherheitsanalyse zum Pferdesport in der Schweiz: Unfall-, Risikofaktoren und
 Interventionsanalyse. Bern: bfu – Beratungsstelle für Unfallverhütung 2014. ISBN 978-3-
 906173-44-3
2. Zimmerman M, Dyson S, Murray R. Close, impinging and overriding spinous processes in
 the thoracolumbar spine: the relationship between radiological and scintigraphic findings and
 clinical signs. Equine Vet J 2012;44(2):178-84. doi:10.1111/j.2042-3306.2011.00373.x
3. Greve L, Dyson S. The horse-saddle-rider interaction. Vet J 2013;195(3):275-81.
 doi:10.1016/j.tvjl.2012.10.020
4. Symes D, Ellis R. A preliminary study into rider asymmetry within equitation. Vet J
 2009;181(1):34-7. doi:10.1016/j.tvjl.2009.03.016
5. Hobbs SJ, Baxter J, Broom L, et al. Posture, Flexibility and Grip Strength in Horse Riders. J
 Hum Kinet 2014;42(1):113-25. doi:10.2478/hukin-2014-0066
6. Gandy EA, Bondi A, Hogg R, et al. A preliminary investigation of the use of inertial sensing
 technology for the measurement of hip rotation asymmetry in horse riders. Sports
 Technology 2014;7(1-2):79-88. doi:10.1080/19346182.2014.905949
7. Meyners E, Putz M. Fachpraktische Hinweise für den Ausbilder. In: Deutsche Reiterliche
 Vereinigung e.V., eds. Sportlehre Lehren, Lernen und Trainieren im Pferdesport. Warendorf:
 FN-Verlag 1992. ISBN 3-885-42251-4
8. Heipertz-Hengst C. Fit fürs Pferd. Gesundheit - Leistung - Sicherheit. Das Trainingsbuch für
 Reiter. Lüneburg: Cadmos 2002. ISBN 978-3-861273-75-2
9. Weineck J. Optimales Training: Leistungsphysiologische Trainingslehre unter besonderer
 Berücksichtigung des Kindes- und Jugendtrainers. Baldingen: Spitta 2007. ISBN 3-932-
 75398-4
10. Notz H. Trainerausbildung: Anforderungsprofil Reiten. Bern: Swiss Olympic Association
 1999.
11. Koch LM, Peiler C, Riedel M. Sportmotorischer Test für Reiter - Testanleitung. Warendorf:
 Deutsches Olympiade-Komitee für Reiterei. Available from: https://www.pferd-
 aktuell.de/files/2/67/708/734/Kaderinformation_Testanleitung.pdf [accessed 11.05.2018].
12. Swiss Federal Office of Sport. Forschungskonzept "Sport und Bewegung" 2017-2020.
 Magglingen: BASPO 2017. Available from: https://www.baspo.admin.ch/de/bildung-und-
 forschung/forschung/forschungskonzept.html [accessed 11.05.2018].
13. Swiss Olympic Association. Manual Talentdiagnostik und -selektion. Bern: Swiss Olympic
 2008. Available from: https://www.mobilesport.ch/wp-
 content/uploads/2011/02/Manual_Talentdiagnostik_und_-selektion_230309.pdf [accessed
 11.05.2018].

Masterarbeit Andrea Aegerter 18
14. Seo HJ, Kim SY, Lee YJ, et al. A newly developed tool for classifying study designs in
 systematic reviews of interventions and exposures showed substantial reliability and validity.
 J Clin Epidemiol 2016;70(1):200-5. doi:10.1016/j.jclinepi.2015.09.013
15. Green SB. How Many Subjects Does It Take To Do A Regression Analysis. Multivariate
 Behav Res 1991;26(3):499-510. doi:10.1207/s15327906mbr2603_7
16. Hegner J, Hotz A, Kunz H. Erfolgreich trainieren! Zürich: vdf, Hochschulverlag an der ETH
 2000. ISBN 978-3-7281-2948-2
17. Stoll T. Isometric Muscle Strength Measurement. Stuttgart, New York: Thieme 2002. ISBN
 978-3-131278-51-7
18. Del Rossi G, Malaguti A, Del Rossi S. Practice effects associated with repeated assessment
 of a clinical test of reaction time. J Athl Train 2014;49(3):356-9. doi:10.4085/1062-6059-
 49.2.04
19. Bohannon RW, Bubela DJ, Wang YC, et al. Six-minute Walk Test versus Three-minute Step
 Test for Measuring Functional Endurance (Alternative Measures of Functional Endurance). J
 Strength Cond Res 2015;29(11):3240-4. doi:10.1519/jsc.0000000000000253
20. Robinson RO, Herzog W, Nigg BM. Use of force platform variables to quantify the effects of
 chiropractic manipulation on gait symmetry. J Manipulative Physiol Ther 1987;10(4):172-6.
21. Persike M. Mathematische und statistische Methoden. Mainz: Johannes Gutenberg
 Universität 2012. Available from: http://methodenlehre.sowi.uni-
 mainz.de/download/Lehre/WS2011_2012/StatistikI/2012_01_17_VL.pdf [accessed
 11.05.2018].
22. Cohen J. Statistical Power Analysis for the Behavioral Sciences. 2 ed. Hillsdale: Lawrence
 Erlbaum Associates 1988. ISBN 978-0-12-179060-8
23. McGraw KO, Wong SP. Forming inferences about some intraclass correlation coefficients.
 Psychological Methods 1996;1(1):30-46. doi:10.1037/1082-989X.1.1.30
24. Koo TK, Li MY. A Guideline of Selecting and Reporting Intraclass Correlation Coefficients for
 Reliability Research. J Chiropr Med 2016;15(2):155-63. doi:10.1016/j.jcm.2016.02.012
25. Von Elm E, Altman DG, Egger M, et al. Strengthening the Reporting of Observational Studies
 in Epidemiology (STROBE) statement: guidelines for reporting observational studies. Bmj
 2007;335(7624):806-8. doi:10.1136/bmj.39335.541782.AD
26. Heipertz W. Orthopädische Aspekte des Reitsports. In: Deutsche Reiterliche Vereinigung,
 eds. Reiten – Gesundheitliche Betätigung lebenslang: Eine Sportart stellt sich vor.
 Warendorf: FN-Verlag 1991.
27. Terada K. Comparison of Head Movement and EMG Activity of Muscles between Advanced
 and Novice Horseback Riders at Different Gaits. J Equine Sci 2000;11(4):83-90.
 doi:10.1294/jes.11.83

Masterarbeit Andrea Aegerter 19
28. Nevison CM, Timmis MA. The effect of physiotherapy intervention to the pelvic region of
 experienced riders on seated postural stability and the symmetry of pressure distribution to
 the saddle: A preliminary study. J Vet Behav 2013;8(4):261-4.
 doi:10.1016/j.jveb.2013.01.005
29. Lagarde J, Kelso JA, Peham C, et al. Coordination dynamics of the horse-rider system. J Mot
 Behav 2005;37(6):418-24. doi:10.3200/jmbr.37.6.418-424
30. McBride S, Mills D. Psychological factors affecting equine performance. BMC Vet Res
 2012;8(1):180. doi:10.1186/1746-6148-8-180
31. Cohen J. A power primer. Psychol Bull 1992;112(1):155-9. doi:10.1037/0033-2909.112.1.155

Masterarbeit Andrea Aegerter 20
SEPARATE FILE

 Legend: RP = riding performance
 Figure 1: Mean and homoscedasticity of the error

Masterarbeit Andrea Aegerter 21
SUPPLEMENTARY FILES
Supplementary file 1
Exclusion criteria and online-survey for demographics
The questionnaire for exclusion criteria and the online-survey used to collect demographic data
can be obtained from the author on request (here: Appendix 4).

PF and RP
A detailed test description of the PF and RP can be requested from the author (here: Appendix 4).
A summary is shown in Table 6 and Table 7.

Table 6: Test description of riding performance (RP)

 No. item criteria units of measurement

 1 halt [0-10]; interval

 2 walk, right [0-10]; interval

 3 rising trot, right [0-10]; interval

 4 sitting trot, right seat [0-10]; interval
 influence of the rider
 5 canter, right [0-10]; interval
 obedience
 6 walk, left precision of the figures [0-10]; interval

 7 rising trot, left [0-10]; interval

 8 sitting trot, left [0-10]; interval

 9 canter, left [0-10]; interval

 10 rider position, balance, suppleness [0-10]; interval

 11 rider aids: correctness of application, timing, influence, sensitivity [0-10]; interval

 12 horse gait: clearness, tactfulness, rhythm [0-10]; interval

 13 horse engagement, impulsion, activity [0-10]; interval

 14 horse connection: released, activity of the mouth, collection, elevation [0-10]; interval

 15 horse alignment, bending of body [0-10]; interval

 16 horse back activity, elasticity [0-10]; interval

 17 horse obedience: concentration, attention, motivation [0-10]; interval

 18 overall impression synchronousness: equal movement of horse and rider [0-10]; interval

 19 overall impression appearance, proportion of dimensions [0-10]; interval

 20 overall impression harmony: satisfaction horse, confidence [0-10]; interval

 Legend: 10 = excellent, 9 = very good, 8 = good, 7 = fairly good, 6 = satisfactory, 5 = sufficient, 4 = insufficient, 3 =
 fairly bad, 2 = bad, 1 = very bad, 0 = not executed

Masterarbeit Andrea Aegerter 22
Table 7: Test description of physical fitness (PF)

 No. item outcome, units of measurement

 flexibility

 1&2 knee: flexion joint angle right & left [°]; ratio

 3&4 hip: flexion joint angle right & left [°]; ratio

 5&6 hip: abduction joint angle right & left [°]; ratio

 7 -10 hip: rotation (internal, external) joint angle right & left [°]; ratio

 11 & 12 hip: extension joint angle right & left [°]; ratio

 13 & 14 feet: dorsiflexion joint angle right & left [°]; ratio

 balance

 15-26 static, unilateral [number of completed tasks]; ordinal

 27-32 static, bilateral [number of completed tasks]; ordinal

 33-36 dynamic, unilateral [number of completed tasks]; ordinal

 37& 38 dynamic, bilateral [number of completed tasks]; ordinal

 speed

 39 & 40 tapping frequencies, maximum & mean [Hz&ms]; ratio

 41-43 jumps height [cm]; ratio

 reaction time

 44 reaction time: legs reactive force [cm²/ms]; ratio

 45 & 46 reaction time: hand right & left [cm]; ratio

 strength

 47 & 48 hip: extension maximal strength right & left [lbs]; ratio

 49 back maximal strength [lbs]; ratio

 50 core maximal strength [lbs]; ratio

 51 & 52 hip: flexion maximal strength right & left [lbs]; ratio

 53 - 54 hip: abduction maximal strength right & left [lbs]; ratio

 55 - 56 hip: adduction maximal strength right & left [lbs]; ratio

 57 & 58 knee: flexion maximal strength right & left [lbs]; ratio

 endurance

 59 3-minute-step-test difference: maximum bpm and after one minute of recovery, [bpm]; ratio

Masterarbeit Andrea Aegerter 23
Supplementary file 2
Further statistical equations referenced in the study

 Equation 2: Symmetry index,[20]

 −
 = ∗ 100%
 0.5 ∗ ( + )

 SI = symmetry index
 XD = variable of the dominant side (hand or leg)
 XA = variable of the adominant side (hand or leg)

 Equation 3: Effect size f2 and interpretation of f2,[31]

 2
 2 =
 1 − 2

 f2 = effect size
 R2 = coefficient of determination

 interpretation:
 f2 = 0.02, small effect
 f2 = 0.15, medium effect
 f2 = 0.35, large effect

 Equation 4: Intraclass correlation coefficient,[23]

 −
 =

 + ( − 1) + ( − )

 ICC = Intraclass correlation coefficient
 MSR = mean square for rows
 MSE = mean square for error
 MSC = mean square for columns
 n = number of subjects
 k = number of raters

 Equation 5: Sample size calculation,[15]

 = 50 + 8 ∗

 N = number of subjects
 m= number of predictors

 In this study:
 N ≥ 106 (m = 7)

Masterarbeit Andrea Aegerter 24
Further table referenced in the study

 Table 8: F-Test

 Model Sum of Squares df F Sig.
 Regression 45910.230 4 7.714 0.000
 Residual 163664.761 110
 Total 209574.991 114

 Legend: df = degrees of freedom, F = F-test, Sig. = significance

Further figure referenced in the study

 Legend: RP = riding performance
 Figure 2: Normal distribution of the error

Masterarbeit Andrea Aegerter 25
Figure 3: Partial regression plot of the predictors and riding performance (RP)

Masterarbeit Andrea Aegerter 26
II Appendix

Masterarbeit Andrea Aegerter 27
APPENDIX 1: AUTORENRICHTLINIEN DES GEWÄHLTEN JOURNALS The British Journal of Sports Medicine (BJSM) aims to highlight clinically-relevant original re- search, editorials, systematic reviews, consensus statements and commentary that will be of in- terest to the field of sport and exercise medicine. The journal is aimed at physicians, physiother- apists, exercise scientists and those involved in public policy. BJSM encourages the inclusion of Twitter usernames in an author’s information to encourage discussion and debate around each article. Please note that references will be published online only. Submission guidelines Please review the below article type specifications including the required article lengths, illustra- tions, table limits and reference counts. The word count excludes the title page, abstract, tables, acknowledgements, contributions and references. Manuscripts should be as succinct as possi- ble. For further support when making your submission please refer to the resources available on the BMJ Author Hub. Here you can also find general formatting guidelines across BMJ and a for- matting checklist. Original article Original Research should not exceed 3000 words; Additional data may be presented as supple- mentary information, which will be published online only should the article be accepted (this can be in any format: text, tables, images, videos, etc.). Main body of the paper: We encourage short introductions when the rationale of the study is obvious, i.e. it may be as short as 3 short para- graphs that addresses “Why we did it”. We encourage the use of subheadings in the methods, results and discussion. We find it hard to imagine a discussion that has fewer than two subhead- ings. Word count: up to 3000 words Abstract: up to 250 words and structured including the headings Objectives, Methods, Re- sults and Conclusion Tables/illustrations: up to 6 tables and/or figures Please include a summary box summarising in 3-4 bullet points “what are the new findings”. Formatting Guidelines Formatting your paper These are general formatting guidelines across BMJ, please always refer to journal-specific in- structions for authors for article type specifications. You can browse the titles on our Journals website. If you are looking to submit to The BMJ, please visit this section. To maximise the chances of your paper being accepted, it is a good idea to review and follow the formatting guidelines carefully. If your paper fits the journal’s format and article type specifications, busy ed- itors and reviewers will have a much easier job at considering your paper, and this will save time Masterarbeit Andrea Aegerter 28
in the long run. In order to reduce the chance of your manuscript being returned to you, please use the below checklist and guidelines. If you are unable to find the answer to your question, our editorial team will be on hand to offer assistance throughout the submission process. Contact details for the editorial team are on the journal’s Help page. Formatting checklist 1. Author information: Have you provided details of all of your co-authors? Is the information that you have entered into ScholarOne the same as the information on the manuscript title page? 2. Manuscript length and formatting: Have you provided your abstract in the correct format? Have you supplied any required additional information for your article type, such as key mes- sages? Have you checked that your manuscript doesn’t exceed the requirements for word count, number of tables and/or figures, and number of references? 3. Tables: Are your tables in an editable format? Have you embedded them into the main word document? Have they been cited in the text? Have you provided appropriate table legends? Have you uploaded any lengthy tables as supplementary files for online publication? 4. Figures: Have you uploaded figures separately from the text? Have they been supplied in an acceptable format and are they of sufficient quality? Are they suitable for black and white re- production (unless you intend to pay any required fees for colour printing)? Have the files been labelled appropriately? Have the figures been cited in the text? Have you provided ap- propriate figure legends? 5. References: Have all of the references been cited in the text? 6. Supplementary files: Have you supplied these in an acceptable format? Have they been cited in the main text? 7. Statements: Have you included the necessary statements relating to contributor ship, com- peting interests and funding, data sharing, patient consent and ethical approval? 8. Research reporting checklists: Have you either provided the appropriate statement for your study type, or explained why a checklist isn’t required? 9. Reproducing figures: Have you obtained permission from the copyright holder to re-use any previously published material? Has the source been acknowledged? Title page The title page must contain the following information: Title of the article. Full name, postal address, e-mail and telephone number of the corresponding author. Full name, department, institution, city and country of all co-authors. Word count, excluding title page, abstract, references, figures and tables. Masterarbeit Andrea Aegerter 29
Keywords Authors can usually opt to (or are required to) choose keywords relevant to the content of the manuscript during the submission process. This assists in the identification of the most suitable reviewers for the manuscript. The selected keywords should also be included in the abstract it- self. Manuscript format The manuscript must be submitted as a Word document (BMJ Case Reports and Veterinary Record Case Reports request that authors submit using a template which should also be in Word format). PDF is not accepted. The manuscript should be presented in the following order: Title page. Abstract, or a summary for case reports (Note: references should not be included in abstracts or summaries). Main text separated under appropriate headings and subheadings using the following hierar- chy: BOLD CAPS, bold lower case, Plain text, Italics. Tables should be in Word format and placed in the main text where the table is first cited. Ta- bles should also be cited in numerical order. Acknowledgments, Competing Interests, Funding and all other required statements. References. All references should be cited in the main text in numerical order. Figures must be uploaded as separate files (view further details under the Figures/illustrations section). All figures must be cited within the main text in numerical order and legends should be provided at the end of the manuscript. Online Supplementary materials should be uploaded us- ing the File Designation “Supplementary File” on the submission site and cited in the main text. Please remove any hidden text headers or footers from your file before submission. Style Acronyms and abbreviations should be used sparingly and fully explained when first used. Ab- breviations and symbols must be standard. SI units should be used throughout, except for blood pressure values which should be reported in mm Hg. Whenever possible, drugs should be given their approved generic name. Where a proprietary (brand) name is used, it should begin with a capital letter. Figures/illustrations Images must be uploaded as separate files. All images must be cited within the main text in nu- merical order and legends must be provided (ideally at the end of the manuscript). Masterarbeit Andrea Aegerter 30
Colour images and charges
 For certain journals, authors of unsolicited manuscripts that wish to publish colour figures in print
 will be charged a fee to cover the cost of printing. Refer to the specific journal’s instructions for
 authors for more information. Alternatively, authors are encouraged to supply colour illustrations
 for online publication and black and white versions for print publication. Colour publication online
 is offered at no charge, but the figure legend must not refer to the use of colours.

 File types
 Figures should be submitted in TIFF or EPS format. JPEG files are acceptable in some cases. A
 minimum resolution of 300 dpi is required, except for line art which should be 1200 dpi. Histo-
 grams should be presented in a simple, two-dimensional format, with no background grid. For
 figures consisting of multiple images/parts, please ensure these are submitted as a single com-
 posite file for processing. We are unable to accept figures that are submitted as multiple files.
 During submission, ensure that the figure files are labelled with the correct File Designation of
 “Mono Image” for black and white figures and “Colour Image” for colour figures. Figures are
 checked using automated quality control and if they are below the minimum standard you will be
 alerted and asked to resupply them. Please ensure that any specific patient/hospital details are
 removed or blacked out (e.g. X-rays, MRI scans, etc). Figures that use a black bar to obscure a
 patient’s identity are NOT accepted.

 Tables
 Tables should be in Word format and placed in the main text where the table is first cited. Tables
 must be cited in the main text in numerical order. Please note that tables embedded as Excel
 files within the manuscript are NOT accepted. Tables in Excel should be copied and pasted into
 the manuscript Word file. Tables should be self-explanatory and the data they contain must not
 be duplicated in the text or figures. Any tables submitted that are longer/larger than 2 pages will
 be published as online only supplementary material.

 Multimedia files
 You may submit multimedia files to enhance your article. Video files are preferred in .WMF or
 .AVI formats, but can also be supplied as .FLV, .Mov, and .MP4. When submitting, please en-
 sure you upload them using the File Designation “Supplementary File – Video”.

 References
 Authors are responsible for the accuracy of cited references and these should be checked be-
 fore the manuscript is submitted.

Masterarbeit Andrea Aegerter 31
Citing in the text
 References must be numbered sequentially as they appear in the text. References cited in fig-
 ures or tables (or in their legends and footnotes) should appear at the end of the reference list to
 avoid re-numbering if tables and figures are moved around at peer review/proof stage. Refer-
 ence numbers in the text should be inserted immediately after punctuation (with no word spac-
 ing)—for example,[6] not [6]. Where more than one reference is cited, these should be sepa-
 rated by a comma, for example,[1, 4, 39]. For sequences of consecutive numbers, give the first
 and last number of the sequence separated by a hyphen, for example,[22-25]. References pro-
 vided in this format are translated during the production process to superscript type, and act as
 hyperlinks from the text to the quoted references in electronic forms of the article. Please note
 that if references are not cited in order the manuscript may be returned for amendment before it
 is passed on to the Editor for review.

 Preparing the reference list
 References must be numbered consecutively in the order in which they are mentioned in the
 text. Only papers published or in press should be included in the reference list. Personal com-
 munications or unpublished data must be cited in parentheses in the text with the name(s) of the
 source(s) and the year. Authors should request permission from the source to cite unpublished
 data. Journals from BMJ use a slightly modified version of Vancouver referencing style (see ex-
 ample below, or download here). Note that The BMJ uses a different style.

 BMJ reference style
 List the names and initials of all authors if there are 3 or fewer; otherwise list the first 3 and add
 ‘et al.’ (The exception is the Journal of Medical Genetics, which lists all authors). Use one space
 only between words up to the year and then no spaces. The journal title should be in italic and
 abbreviated according to the style of Medline. If the journal is not listed in Medline then it should
 be written out in full. Example references:

 Journal article
 13 Koziol-Mclain J, Brand D, Morgan D, et al. Measuring injury risk factors: question reliability in a statewide sample.
 Inj Prev 2000;6:148–50.

 Chapter in book
 14 Nagin D. General deterrence: a review of the empirical evidence. In: Blumstein A, Cohen J, Nagin D, eds. Deter-
 rence and Incapacitation: Estimating the Effects of Criminal Sanctions on Crime Rates. Washington, DC: National
 Academy of Sciences 1978:95–139.

 Book
 15 Howland J. Preventing Automobile Injury: New Findings From Evaluative Research. Dover, MA: Auburn House
 Publishing Company 1988:163–96.

Masterarbeit Andrea Aegerter 32
Abstract/supplement
 16 Roxburgh J, Cooke RA, Deverall P, et al. Haemodynamic function of the carbomedics bileaflet prosthesis [ab-
 stract]. Br Heart J 1995;73(Suppl 2):P37.

 Electronic citations
 Websites are referenced with their URL and access date, and as much other information as is available. Access date
 is important as websites can be updated and URLs change. The “date accessed” can be later than the acceptance
 date of the paper, and it can be just the month accessed.

 Electronic journal articles
 Morse SS. Factors in the emergency of infectious diseases. Emerg Infect Dis 1995 Jan-Mar;1(1).
 www.cdc.gov/nciod/EID/vol1no1/morse.htm (accessed 5 Jun 1998).

 Electronic letters
 Bloggs J. Title of letter. Journal name Online [eLetter] Date of publication. url eg: Krishnamoorthy KM, Dash PK. Novel
 approach to transseptal puncture. Heart Online [eLetter] 18 September 2001. http://heart.bmj.com/cgi/elet-
 ters/86/5/e11#EL1

 Legal material
 Toxic substances Contro Act: Hearing on S776 Before the Subcommittee of the Environment of the Senate Comm. on
 Commerce, 94th Congress 1st September (1975).
 Washington v Glucksberg 521 US 702 (1997)

 Law references
 The two main series of law reports, Weekly Law Reports (WLR) and All England Law Reports (All ER) have three vol-
 umes a year.

 For example:
 Robertson v Post Office [1974] 1 WLR 1176
 Ashcroft v Mersey Regional Health Authority [1983] 2 All ER 245
 R v Clarence [1868] 22 QBD 23
 Wimpey Construction UK Ltd v Poole (1984) Times, 3 May

 There are good historical precedents for the use of square and round brackets. Since 1891, round ones have referred
 to the date of the report, square ones to the date of publication of the report. Apart from not italicising the name of the
 case, we use the lawyers’ style; be careful with punctuation. Here are some more examples:
 Caparo Industries plc v Dickman and others [1990] 1 All ER 568-608.
 R v Clarence [1888] 22 QBD 23.
 Finlayson v HMAdv 1978 SLT (Notes) 60
 Block v Martin (1951) 4 DLR 121

 Official Journal of the European Communities: at the top of the page it gives the No, vol, and page and, at the other
 side of the header, the date. The abbreviation for the title is given in parentheses under the title. Jiggle these elements
 around to get, eg: Council Directive of 14 June 1989. Offical Journal of the European Communities No L 1989 June
 28:181/44-6. (89/831/EEC.

Masterarbeit Andrea Aegerter 33
Digital Object Identifier (DOI)
 A DOI is a unique string created to identify a piece of intellectual property in an online environ-
 ment and is particularly useful for articles that are published online before appearing in print (and
 therefore have not yet been assigned the traditional volume, issue and page number refer-
 ences). The DOI is a permanent identifier of all versions of an article, whether raw manuscript or
 edited proof, online or in print. Thus the DOI should ideally be included in the citation even if you
 want to cite a print version of an article. How to cite articles with a DOI before they have ap-
 peared in print:
 1. Alwick K, Vronken M, de Mos T, et al. Cardiac risk factors: prospective cohort study. Ann
 Rheum DisPublished Online First: 5 February 2004. doi:10.1136/ard.2003.001234
 How to cite articles with a DOI once they have appeared in print
 1. Vole P, Smith H, Brown N, et al. Treatments for malaria: randomised controlled trial. Ann
 Rheum Dis2003;327:765–8 doi:10.1136/ard.2003.001234 [published Online First: 5 February
 2002].

 PLEASE NOTE: RESPONSIBILITY FOR THE ACCURACY AND COMPLETENESS OF REF-
 ERENCES RESTS ENTIRELY WITH THE AUTHOR.

 Online only supplementary material
 Additional figures and tables, methodology, raw data, etc may be published online only as sup-
 plementary material. If your paper exceeds the word count you should consider if any parts of
 the article could be published online only. Please note that these files will not be copyedited or
 typeset and will be published as supplied, therefore PDF files are preferred. All supplementary
 files should be uploaded using the File Designation “Supplementary File”. Please ensure that
 any supplementary files are cited within the main text of the article. Some journals also encour-
 age authors to submit translated versions of their abstracts in their local language, which are
 published online only alongside the English version. These should be uploaded using the File
 Designation “Abstract in local language”.

Masterarbeit Andrea Aegerter 34
You can also read