The Influence of Skin Thickness on Flash Glucose Monitoring System Accuracy in Dogs with Diabetes Mellitus
←
→
Page content transcription
If your browser does not render page correctly, please read the page content below
animals
Article
The Influence of Skin Thickness on Flash Glucose Monitoring
System Accuracy in Dogs with Diabetes Mellitus
Francesca Del Baldo, Alessia Diana * , Claudia Canton, Nikolina Linta, Roberto Chiocchetti
and Federico Fracassi

                                          Department of Veterinary Medical Sciences, University of Bologna, Ozzano dell’Emilia, 40064 Bologna, Italy;
                                          francesca.delbaldo2@unibo.it (F.D.B.); claudia.canton@studio.unibo.it (C.C.); nikolina.linta2@unibo.it (N.L.);
                                          roberto.chiocchetti@unibo.it (R.C.); federico.fracassi@unibo.it (F.F.)
                                          * Correspondence: alessia.diana@unibo.it

                                          Simple Summary: A flash glucose monitoring system (FGMS) has been validated for use in dogs with
                                          diabetes mellitus and diabetic ketoacidosis. It continuously measures the glucose in the interstitial
                                          fluid through a small filament (5 mm long) inserted under the skin. Interstitial glucose concentrations
                                          are reportedly comparable to whole blood glucose concentrations. However, several factors can
                                          influence the performance of interstitial sensors, including the proportion of interstitial fluid in a
                                          tissue. The influence of skin thickness on flash glucose monitoring system accuracy has not been
                                          investigated in previous studies; therefore, the aim of this study was to evaluate whether FGMS
                                          accuracy is affected by skin thickness. On the basis of our results, skin thickness seems to affect
                                FGMS measurements; the mean bias was significantly inversely correlated (p = 0.02; r = −0.6) with
                                   the mean skin thickness, and clinical accuracy according to ISO 15197:2013 criteria was observed
Citation: Del Baldo, F.; Diana, A.;       only in dogs with skin thickness > 5 mm, with 99% of the results falling in zone A + B of the Parkes
Canton, C.; Linta, N.; Chiocchetti, R.;   consensus error grid analysis. In dogs with thin skin ( 5 mm (Group 2). On days 1, 7 and 14, glucose curves
M. Alexander                              were obtained simultaneously using the FGMS and a validated portable blood glucose meter. Paired
Received: 1 December 2020                 measurements were used to calculate the mean bias and to determine accuracy according to ISO
Accepted: 2 February 2021                 15197:2013 criteria. The mean bias was significantly inversely correlated (p = 0.02; r = −0.6) with the
Published: 5 February 2021                mean skin thickness. Clinical accuracy was observed only in Group 2, with 99% of the results in zone
                                          A + B of the Parkes consensus error grid analysis. In conclusion, skin thickness seems to affect FGMS
Publisher’s Note: MDPI stays neutral      measurements, and the device is accurate in dogs with thicker skin (>5 mm); in dogs with thin skin
with regard to jurisdictional claims in   (
Animals 2021, 11, 408 2 of 12
distinguish it from existing sensor technology. It provides comprehensive glucose data
without the need for calibration, and it can be worn for up to 14 days. The hand-held
reader is used to scan the sensor to receive a glucose result along with historic results with
a 15-min frequency for up to 8 h.
Interstitial glucose (IG) concentrations are reportedly comparable to whole blood
glucose concentrations in humans and other animals as a result of an equilibrium that
develops between the glucose concentration in the blood and in the interstitium [3–11].
However, several factors can influence the performance of interstitial sensors, including
the proportion of interstitial fluid in a tissue, which is lower and more variable in subcu-
taneous tissue and dependent on the size of adipocytes and subsequent adipocyte blood
flow [12]. Moreover, in humans, tissue glucose concentration nadirs in muscle have been
reported to be delayed in time and lower in magnitude relative to glucose concentrations in
adipose tissue and blood, especially during insulin-induced hypoglycemia [13,14]. There-
fore, decreased thickness of the subcutaneous adipose tissue layer may result in closer
sensor proximity to the underlying muscle tissue and, consequently, in inaccurate glucose
concentration results. Despite the evidence that the FGMS is accurate for evaluating IG
in dogs, the influence of skin thickness on sensor readings has not been reported in the
veterinary literature. Therefore, the aim of this study was to assess the influence of skin
thickness on FGMS measurements.
2. Materials and Methods
2.1. Diabetic Dogs
Fourteen client-owned diabetic dogs on insulin treatment were included in the study.
The median age was 10 years (7–14 years). The median body weight was 9.9 kg (5.3–30.6 kg),
and the median body condition score (BCS) was 5 (4–8). The median hematocrit was 44%
(39–55%). There were 8 mixed-breeds, 2 English Setters and one each of the following
breeds: Pinscher, Bichon Poodle, Maltese and Labrador Retriever. Three dogs had concur-
rent hypothyroidism and were receiving levothyroxine (Canitroid, Dechra Pharmaceuticals,
Northwich, UK) supplementation, while 4 dogs had concurrent pituitary-dependent hy-
percortisolism and were receiving trilostane (Vetoryl, Dechra Pharmaceuticals, Nortwich,
UK). Table 1 shows the most relevant clinical data of each dog.
Table 1. Clinical data, skin thickness and absolute mean bias of each dog.
Age BCS Concurrent Initial Skin Final Skin Absolute Mean
Breed Weight (kg) Disease Thickness (mm) Thickness (mm) Bias (mmol/L)
Patient 1 9y5m Pinscher 6 5 / 3.045 3.073 8.33
Patient 2 12y2m English Setter 16.7 5 Hypothyroidism 3.376 3.328 4.21
Patient 3 9y5m Small mixed 11.8 5 / 6.303 5.286 1.32
breed
Patient 4 10y5m Bichon Poodle 7.4 6 / 5.583 5.255 3.79
Patient 5 7y2m Maltese 6.5 6 Hypercortisolism 5.510 4.950 5.11
Large mixed
Patient 6 7y8m 26.5 8 Hypothyroidism 5.858 7.770 3.60
breed
Large mixed
Patient 7 11y 30.6 6 / 6.028 / 1.25
breed
Patient 8 13y8m Small mixed 6.1 5 / 4.675 5.306 2.44
breed
Patient 9 13y2m English setter 22.3 6 / 6.201 7.023 1.51
Patient 10 9y8m Small mixed 5.3 5 Hypercortisolism 4.978 3.995 5.22
breed
Patient 11 10y3m Small mixed 8 4 5.591 3.48
breed Hypothyroidism /
Patient 12 10y3m Medium mixed 16.2 5 Hypercortisolism 3.241 / 4.33
breed
Patient 13 13y6m Labrador 29.4 5 / 6.936 7.263 0.03
retriever
Patient 14 10y6m Small mixed 6.3 4 Hypercortisolism 2.248 2.015 2.71
breedAnimals 2021, 11, 408 3 of 12
Based on skin thickness measured by ultrasonography (US) at T0 and according to the
length of the sensor filament (5 mm), the dogs were divided into two groups: dogs with a
skin thickness < 5 mm (Group 1) and dogs with a skin thickness > 5 mm (Group 2).
The study protocol was approved by the Ethical Committee of the University of
Bologna (ID1009/18), and informed consent was obtained from the owners.
2.2. Data Collection
Three separate glucose curves (GCs) were obtained for each dog during the recording
period of their respective FGMS. On days 1, 7 and 14, paired in-hospital GCs were obtained
using the FGMS (FreeStyle Libre, Abbott, UK) and a validated portable blood glucose meter
(PBGM) (Optium Xceed, Abbott, UK) device [15]. This PBGM underestimates the real BG
concentration in the euglycemic and hyperglycemic range, with a mean difference between
capillary BG measured by the PBGM and serum BG obtained using the reference method
(hexokinase method) of −0.26 mmol/L (4.8 mg/dL) and −4.11 mmol/L (74 mg/dL),
respectively. Conversely, in the hypoglycemic range, this PBGM overestimates the BG
concentration, with a mean difference of 0.37 mmol/L (6.8 mg/dL) [15]. On day 1 of the
study, the dogs were hospitalized after food and insulin were given at home. Immediately
after arrival in the hospital, an ultrasound (US) of the dorsal side of the neck (regio colli
dorsalis) was performed, and immediately after that, the sensor was placed in the same
clipped and cleaned area. In particular, an area of around 5 × 5 cm, halfway between
the margin of the occipital bone and the dorsal margin of the scapula, was clipped and
cleaned with chlorhexidine and 70% alcohol. The sensor was inserted with the aid of the
applicator provided by the manufacturer. After positioning, it was fixed with extra tape
(PIC Solution Soft Fix, Pikdare S.p.A., Casnate con Bernate, Como, Italy), and a cotton
and an elastic body bandage (Vetrap RM, 3M Italia Srl, Pioltello, Milano, Italy) were used
to secure the sensor to the body [1]. The sensor measures the IG concentration through
a small catheter (5 mm long × 0.4 mm wide) inserted under the skin. The sensor has a
1-h period of initialization. The detection limits range from 1.1 to 27.7 mmol/L (20 and
500 mg/dL); when the IG concentration is 1.1 mmol/L (≤20 mg/dL) and ≥27.7 mmol/L
(500 mg/dL), the reader shows “LO” (≤1.1 mmol/L; 20 mg/dL) and “HI” (≥27.7 mmol/L;
500 mg/dL), respectively. For a total of 10–12 h, IG measurements were recorded using the
FGMS on a two-hourly basis. Capillary blood glucose was obtained from the pinna every
2 h using the PBGM during the same period. On days 7 and 14, food and insulin were
given at home; the paired GCs were started after the dog arrived at the clinic (≤1 h after
insulin administration) using the same protocol. The paired measurements thus obtained
were used to calculate the mean bias and to determine the analytical and clinical accuracy
of the FGMS in the two groups of dogs using the ISO 15197:2013 criteria.
2.3. Ultrasonography of the Neck
Ultrasonography of the dorsal skin of the neck was carried out by the same expe-
rienced sonographer (AD) using a real-time ultrasound machine (Epiq 5G Ultrasound
System; Philips Healthcare, Monza, Italy) equipped with a broadband high-frequency
linear-array transducer (5–18 MHz) immediately before the sensor application (T0) and
after its removal (T1) in all dogs. The transducer was placed in the area previously de-
scribed in the data collection section. The gain control was set at 36–40%, and the focal
zone was placed at the level of the skin. Ultrasound examination of the skin was carried
out as previously described [16,17]. Longitudinal and transverse scans were obtained, and
the images of the skin were recorded in DICOM format for subsequent offline analysis. The
description and the measurements of the US images were obtained using specific imaging
software (OsiriX Imaging Software; Pixmeo, Geneva, Switzerland). The appearance of
the US skin pattern of each dog was compared to the normal aspect of the canine skin
pattern previously reported [16,17]. Measurements of the skin were made starting from the
outer side of the skin surface (epidermal echo entry-E) to the clearly recognizable acoustic
interface between the dermal (D) and the subcutaneous (S) layers (Figure 1). ConsideringAnimals 2021, 11, 408 4 of 12
the absence of statistical difference between measurements obtained in longitudinal and
transverse planes, the mean value of the 3 measurements obtained in both the longitudinal
Animals 2021, 11, x and the transverse planes for the two different time points (T0 and T1) was used for4 ofthe
12
statistical analysis.
Figure 1. Ultrasonographic
Figure 1. Ultrasonographic appearance
appearance of
of the
the neck
neck skin
skin of
of aa dog
dog with
with aa skin
skin thickness
thickness 5 mm (B). Three distinct layers are clearly recognizable: the epidermal echo entry (E), the dermis (D) and the
thickness > 5 mm (B). Three distinct layers are clearly recognizable: the epidermal echo entry (E), the dermis (D) and
subcutaneous tissue (S). Note that the echogenicity of the second layer (D) is not uniform, and two distinct bands (*) with
the subcutaneous tissue (S). Note that the echogenicity of the second layer (D) is not uniform, and two distinct bands (*)
different echogenicities are recognizable. Measurements of the skin (the dotted lines) showed notably different skin thick-
with
nessesdifferent
betweenechogenicities
the two dogs.are recognizable.
The Measurements
focal zone (white of the
bar) and the skin (thescale
graduated dotted lines)
(0–1 showed
= 1 cm) notably different
are displayed skin
on the right
thicknesses between
of each image. the two dogs. The focal zone (white bar) and the graduated scale (0–1 = 1 cm) are displayed on the
right of each image.
2.4. Statistical Methods
2.4. Statistical
The data Methods
were analyzed using commercial statistical software packages (GraphPad
PrismThe7® , data were analyzed
San Diego, using
California, USA commercial statistical
and R software versionsoftware
3.6.2, Rpackages
core Team,(GraphPad
Vienna,
Prism 7 ® , San Diego, California, USA and R software version 3.6.2, R core Team, Vienna,
Austria). Data distribution was evaluated using the D’Agostino and Pearson tests, and
Austria). Data
parametric distribution was
or non-parametric evaluated
tests were used using the D’Agostino
accordingly. and Pearson
Non-normal data aretests, and
reported
parametric
as medians and or non-parametric tests were
ranges, while normal dataused accordingly.
are expressed Non-normal
as the data aredeviation
mean ± standard reported
as medians
(SD). and ranges,
Skin thickness while
values at normal
T0 weredata are expressed
correlated as the
to the BCS mean
using the±Spearman
standard deviation
test. Skin
(SD). Skinvalues
thickness thickness
at T0values at T0
and T1 were
were correlated
compared to the
using theBCS using
paired the in
t-test Spearman test. both
cases where Skin
thickness values at T0 and T1 were compared using the paired t-test
measurements were available. Moreover, the Mann–Whitney U test was used to compare in cases where both
measurements
the skin thicknesswere available.
between Moreover,
Group the Mann–Whitney
1 and Group U test as
2. The bias, defined wastheused to compare
absolute value
of the difference between interstitial glucose concentration obtained with the FGMSvalue
the skin thickness between Group 1 and Group 2. The bias, defined as the absolute and
of the difference
corresponding between
blood interstitial
glucose glucoseobtained
concentrations concentration
with theobtained
PBGM,with the FGMS and
was calculated. For
corresponding
each dog, the meanbloodbias
glucose
wasconcentrations
calculated as the obtained
mean with
of the the PBGM,
biases was calculated.
obtained from all Forthe
each dog, the mean bias was calculated as the mean of the biases obtained
paired values, and it was correlated to the mean skin thickness using the Pearson test. The from all the
paired values, and it was correlated to the mean skin thickness using
unpaired t-test was used to compare the mean bias between Group 1 and Group 2. The the Pearson test. The
unpaired t-test was
Mann–Whitney used
U test wasto compare the meanthe
used to compare biasbody
between Group
weights 1 and Group
between Group 2. The
1 and
Mann–Whitney U test was used to compare
Group 2. p < 0.05 was considered significant. the body weights between Group 1 and Group
2. p < 0.05 was considered significant.
Analytical and clinical accuracy within the 2 groups of dogs was evaluated by com-
Analytical and clinical accuracy within the 2 groups of dogs was evaluated by com-
paring the results of the PBGM measurements and those obtained from the FGMS using
paring the results of the PBGM measurements and those obtained from the FGMS using
the ISO 15197:2013 criteria. Both of the following minimum criteria for acceptable system
the ISO 15197:2013 criteria. Both of the following minimum criteria for acceptable system
accuracy should be met: (1) 95% of the results must be within ±0.8 mmol/L (15 mg/dL) of
accuracy should be met: (1) 95% of the results must be within ±0.8 mmol/L (15 mg/dL)
the BG concentration for a BG concentration < 5.5 mmol/L (100 mg/dL) and within ±15%
of the BG concentration for a BG concentration < 5.5 mmol/L (100 mg/dL) and within
of the BG concentration for a BG concentration > 5.5 mmol/L (100 mg/dL) and (2) 99% of
±15% of the BG concentration for a BG concentration > 5.5 mmol/L (100 mg/dL) and
the individual BG measured values should fall within zones A and B of the Parkes con-
(2) 99% of the individual BG measured values should fall within zones A and B of the
sensus error grid analysis (EGA) for type 1 diabetes mellitus (DM) [18]. Fisher’s exact test
Parkes consensus error grid analysis (EGA) for type 1 diabetes mellitus (DM) [18]. Fisher’s
was used to compare the percentage of IG values fulfilling the ISO 15197:2013 require-
exact test was used to compare the percentage of IG values fulfilling the ISO 15197:2013
ments between Group 1 and Group 2. Significance was set at a value of p < 0.05.
requirements between Group 1 and Group 2. Significance was set at a value of p < 0.05.
3.
3. Results
Results
All
All sensors
sensors reported
reported IG
IG concentrations within 60
concentrations within 60 min
min post-application.
post-application. In
In 5/14
5/14 dogs,
dogs,
the
the sensor
sensor recorded
recorded for
for 14
14 days,
days, while in 9/14
while in 9/14dogs,
dogs,the
thesensor
sensorstopped
stopped recording
recording IG
IG before
before
14 days due to accidental detachment (2/14) or because the hand-held reader persistently
showed “LO” or “ERR” (the reader is unable to communicate with the sensor) (7/14). In
these dogs, the recording period of the sensor was 13 days in 2/14, 12 days in 1/14, 10 days
in 4/14, 6 days in 1/14 and 2 days in 1/14. Ultrasonographic examination of the skin was
available in 14/14 and 11/14 dogs at T0 and T1, respectively (Table 2).Animals 2021, 11, 408 5 of 12
14 days due to accidental detachment (2/14) or because the hand-held reader persistently
showed “LO” or “ERR” (the reader is unable to communicate with the sensor) (7/14). In
these dogs, the recording period of the sensor was 13 days in 2/14, 12 days in 1/14, 10 days
in 4/14, 6 days in 1/14 and 2 days in 1/14. Ultrasonographic examination of the skin was
available in 14/14 and 11/14 dogs at T0 and T1, respectively (Table 2).
Table 2. Ultrasonographic characteristics of the skin of each dog at T0 and T1. * Dogs that developed macroscopic erythema
at T1. (Nothing of relevance = consistent with normal features reported in previous studies.).
Day 1 of Monitoring (T0) End of Monitoring (T1)
Patient 1 * Entry echo not well defined and irregular Entry echo not well defined and irregular
Presence of oblique and hyperechogenic bands in the Presence of oblique and hyperechogenic bands in the
Patient 2
dermis dermis
Entry echo not well defined and irregular, double
Patient 3 Double dermal layer
dermal layer
Entry echo not well defined and irregular and double Entry echo not well defined and irregular and
Patient 4
dermal layer double dermal layer
Entry echo not well defined and irregular and double
Patient 5 Double dermal layer
dermal layer
Patient 6 Nothing of relevance Entry echo not well defined and irregular
Entry echo not well defined and irregular and double
Patient 7 No ultrasound examination
dermal layer
Patient 8 * Nothing of relevance Nothing of relevance
Presence of oblique and hyperechogenic bands in the Entry echo not well defined and irregular, presence
Patient 9
dermis and double dermal layer of oblique and hyperechogenic bands in the dermis
Patient 10 * Nothing of relevance Entry echo not well defined and irregular
Patient 11 Double dermal layer No ultrasound examination
Patient 12 Nothing of relevance No ultrasound examination
Entry echo not well defined and irregular and
Patient 13 Entry echo not well defined and irregular
double dermal layer
Patient 14 Double dermal layer Double dermal layer
In 3/14 dogs, US examination after sensor removal was not performed due to poor
owner compliance. In 8/11 dogs, the US examination was carried out immediately after
sensor removal on day 14. Among these, there were the 5 dogs in which the sensor
lasted for 14 days, the 2 dogs in which the sensor lasted for 13 days and the 1 dog in
which the sensor lasted for 12 days. In 2/11 dogs, the sensor was detached and therefore
removed by the owner on day 10, and the US evaluation was carried out 4 days later.
In one dog, the sensor was removed on day 6, and the US was performed on day 7. At
T1, 3/14 dogs showed mild self-limiting erythema at the point of the sensor application
(Table S1, Supplementary Materials).
The ultrasonographic features of the canine skin showed a consistent pattern charac-
terized by three distinct layers (i.e., epidermal entry echo, dermal layer and subcutaneous
layer) in all dogs and at both time points. At T0, an irregular entry echo and double-layered
appearance of the dermis were appreciable in 5/14 dogs and in 7/14 dogs, respectively
(Figure 1) (Table 2).
At T1, the epidermal entry echo was irregular in 7/11 dogs, and 5/11 dogs showed
the double-layered appearance of the dermal layer. The skin thickness was not correlated
with the BCS (r = 0.48; p = 0.08). Mean skin thickness was 5 ± 1.4 and 5 ± 1.8 mm at T0 and
T1, respectively. The difference was not significant (p = 0.84). Six dogs had a skin thickness
< 5 mm (Group 1), while eight dogs had a skin thickness > 5 mm (Group 2). The median
skin thickness was 3.3 mm (3.0–4.9) in Group 1 and 5.9 mm (5.5–6.9) in Group 2. TheAnimals 2021, 11, 408 6 of 12
difference was significant (p = 0.0007). Group 1 included the following breeds: 1 Pinscher,
1 English Setter, 3 small mixed-breeds and 1 medium mixed-breed. Group 2 included 1
English Setter, 1 Labrador Retriever, 1 Maltese, 1 Bichon Poodle, 2 small mixed-breeds and
2 large mixed-breeds. The median weight in Group 1 was 6.05 kg (5.4–16.7), and in Group
2, it was 17.05 kg (6.5–30.6) (p = 0.04).
A total of 127 paired glucose measurements were available for analysis, of which 48
Animals 2021, 11, x 6 of 12
were obtained from Group 1 and 79 were from Group 2. Considering all the dogs, the
mean bias between the glucose concentrations obtained using the FGMS versus those
obtained using the PBGM was 3.4 mmol/L (±2.11) (61 mg/dL ± 38), and the biases were
significantly inversely correlated with the skin thickness (r = −0.6; p = 0.02) (Figure 2).
Figure 2. Correlation between skin thickness and absolute mean bias between the glucose concentra-
Figure 2. Correlation between skin thickness and absolute mean bias between the glucose concen-
tions obtained using the flash glucose monitoring system (FGMS) versus those obtained using the
trations obtained using the flash glucose monitoring system (FGMS) versus those obtained using
portable blood glucose meter (PBGM) of each dog.
the portable blood glucose meter (PBGM) of each dog.
The mean bias of the FGMS versus PBGM in Group 1 was 4.1 (±2.6) (74 mg/dL ± 47),
Theand
mean bias of 2,
in Group the FGMS
it was versus
0.33 mmol/L PBGM in Group
(±3.77) (6 mg/dL1 was±4.1
68).(±2.6) (74 mg/dLwas
The difference ± 47),
significant
and in Group 2, it
(p < 0.0001).was 0.33 mmol/L (±3.77) (6 mg/dL ± 68). The difference was significant
(p < 0.0001). Considering the ISO 15197:2013 requirements, in Group 1, the percentages of val-
Considering
ues within the±ISO
0.8315197:2013
mmol/L (15 requirements,
mg/dL) ofinthe Group 1, the percentages
BG concentration of values
for BG concentration
within ±0.83
< 5.55 mmol/L (100 mg/dL) and within ±15% of the BG concentration for 5.5of the BG concentration
mmol/L (100 mg/dL)for wereBG67%
concentra-
(4/6) and 48%
tion > 5.5(35/73),
mmol/L respectively
(100 mg/dL) were 67% (4/6) and 48% (35/73), respectively (Figure
(Figure 3B). These percentages were significantly different 3B). These (p = 0.03).
percentages were significantly different (p = 0.03).
Figure 3. Bland–Altman plots represent the differences between the glucose concentrations obtained by the use of the
FGMS versus those obtained using the PBGM in (A) Group 1 and (B) Group 2. The PBGM glucose values plotted againstwithin ±0.83 mmol/L (15 mg/dL) of the BG concentration for BG concentration < 5.55
mmol/L (100 mg/dL) and within ±15% of the BG concentration for BG concentration ≥ 5.5
mmol/L (100 mg/dL) were 0% (0/4) and 32% (14/44), respectively (Figure 3A). In Group 2, the
percentages of values within ±0.83 mmol/L (15 mg/dL) of the BG concentration for BG concen-
tration < 5.5 mmol/L (100 mg/dL) and within ±15% of the BG concentration for BG concentra-
Animals 2021, 11, 408 7 of 12
tion > 5.5 mmol/L (100 mg/dL) were 67% (4/6) and 48% (35/73), respectively (Figure 3B). These
percentages were significantly different (p = 0.03).
Figure 3.
Figure 3. Bland–Altman
Bland–Altmanplots plotsrepresent
representthe differences
the differencesbetween
betweenthe the
glucose concentrations
glucose obtained
concentrations by thebyuse
obtained theofuse
the FGMS
of the
FGMS versus those obtained using the PBGM in (A) Group 1 and (B) Group 2. The PBGM glucose values plottedabsolute
versus those obtained using the PBGM in (A) Group 1 and (B) Group 2. The PBGM glucose values plotted against against
errors forerrors
absolute each corresponding value are value
for each corresponding x-axis.
on theare Thex-axis.
on the standard
The required
standardlimits are defined
required bydefined
limits are the black bysymmetric
the black
line: at ±0.83
symmetric mmol/L
line: at ±0.83 (15 mg/dL)
mmol/L from thefrom
(15 mg/dL) reference value for
the reference glucose
value determinations
for glucose < 5.5 mmol/L
determinations (100 mg/dL)
< 5.5 mmol/L and
(100 mg/dL)
and ±15% from the reference value for glucose determination > 5.5 mmol/L (100 mg/dL). Percentages
±15% from the reference value for glucose determination > 5.5 mmol/L (100 mg/dL). Percentages express the number of express the number
Animals
of 2021, 11, xwithin the limits when the reference determination was < or >5.5 mmol/L (100 mg/dL) and for the total number7 of 12
samples
samples within the limits when the reference determination was < or >5.5 mmol/L (100 mg/dL) and for the total number of
of measurements
measurements (central
(central % value).
% value).
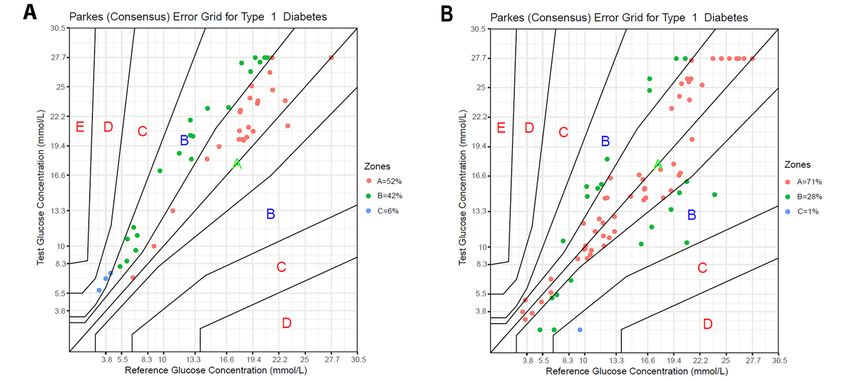
Evaluationofofthe
Evaluation the data
data using
using the the Parkes
Parkes consensus
consensus EGA showed
EGA showed that
that 94% 94%and
(45/48) (45/48)
99%
and 99%
(78/79) of (78/79)
the FGMSof results
the FGMS results
fell in zonesfell
A +inB zones A + 1B and
in Groups in Groups 1 and 2,(Figure
2, respectively respectively
4A,B).
(Figurepercentages
These 4A,B). These
didpercentages did not differ(psignificantly
not differ significantly = 0.15). (p = 0.15).
Figure 4. Parkes consensus error grid analysis (EGA) representation of the percentage of values within the different zones
in (A) Group 11 and
and(B)
(B)Group
Group22dogs.
dogs.The
Thereference
reference glucose
glucosevalues (blood
values (bloodglucose
glucoseobtained by by
obtained a PBGM), on the
a PBGM), x-axis,
on the are
x-axis,
plotted against the interstitial glucose (IG) measurements obtained by the FGMS, on the y-axis. The different
are plotted against the interstitial glucose (IG) measurements obtained by the FGMS, on the y-axis. The different zones zones desig-
nate the magnitude
designate of risk:
the magnitude no effect
of risk: on clinical
no effect action
on clinical (zone
action A);A);
(zone altered clinical
altered clinicalaction—little
action—littleororno
noeffect
effect on
on the
the clinical
clinical
outcome (zone B); altered clinical action—likely to affect the clinical outcome (zone C); altered clinical action—could have
outcome (zone B); altered clinical action—likely to affect the clinical outcome (zone C); altered clinical action—could have a
a significant medical risk (zone D); and altered clinical action—could have dangerous consequences (zone E). ISO
significant medical risk (zone D); and altered clinical action—could have dangerous consequences (zone E). ISO 15197:2013
15197:2013 requires that 99% of the values fall within zones A + B for a device to be considered accurate.
requires that 99% of the values fall within zones A + B for a device to be considered accurate.
4. Discussion
4. Discussion
The results of this study reveal that skin thickness can affect FGMS readings and, in
particular, that the
The results accuracy
of this studyofreveal
the device is higher
that skin in dogs
thickness canwith
affectthicker
FGMSskin.
readings and, in
All the dogs in this study showed the typical US skin pattern
particular, that the accuracy of the device is higher in dogs with thicker characterized
skin. by three
echogenic
All thelayers
dogsasin previously described
this study showed theintypical
clinically
US normal dogs characterized
skin pattern [16,17,19]. Thebyirregu-
three
larity of thelayers
echogenic epidermal entry echodescribed
as previously detected in several dogs
clinically at both
normal dogstime[16,17,19].
points might
Thereflect
irreg-
skin irritation induced by the clipper, corneal desquamation or inflammation induced by
the sensor. In several dogs, a two-layered appearance of the dermis was evident. In hu-
mans, this aspect reflects a demarcation between the papillary dermis (containing fine
connective tissue) and the reticular dermis (composed of large bundles of fibers in a water-
rich interstitial medium) [20]. Dermal echogenicity depends on the amount of collagenAnimals 2021, 11, 408 8 of 12
ularity of the epidermal entry echo detected in several dogs at both time points might
reflect skin irritation induced by the clipper, corneal desquamation or inflammation in-
duced by the sensor. In several dogs, a two-layered appearance of the dermis was evident.
In humans, this aspect reflects a demarcation between the papillary dermis (containing
fine connective tissue) and the reticular dermis (composed of large bundles of fibers in
a water-rich interstitial medium) [20]. Dermal echogenicity depends on the amount of
collagen fibers (which increase dermis echogenicity) and water influx (which decreases
dermal echogenicity), probably through distension of the fiber network [21,22]. Therefore,
the two ultrasonographic patterns identified in the dermal layer of the dogs reported herein
might be related to the differing amounts of dermal fluid storage (different hydration state),
which influences its echogenicity [17]. Unfortunately, the hydration state of the dogs was
not assessed in this study, preventing this evaluation.
Mean skin thickness during the wearing period ranged from 5 ± 1.4 mm (T0) to
5 ± 1.8 mm (T1); differences between the two time points were not observed. This evalua-
tion was carried out in order to detect whether inflammation induced by the FGMS sensor
could influence skin thickness and, consequently, FGMS accuracy during the wearing
period of the sensor. It can be assumed that, even if a mild inflammation develops, skin
thickness is not affected. Skin thickness in dogs is reported to vary from 0.5 to 5.0 mm
depending on several factors, such as the cutaneous site [23] and the state of hydration [17],
as well as individual factors related to breed, age and sex [23–25]. The average skin thick-
ness in this study was greater than has previously been reported [16,17,26–29]. A possible
explanation is that the dorsum of the neck is one of the areas reported to have the thickest
skin [23,24]. Further, previous studies in which skin thickness in dogs was investigated
were performed in healthy dogs or in dogs with hyperadrenocorticism, an endocrinopathy
associated with a reduced skin thickness [29]. In contrast, our study includes dogs with
naturally occurring DM, which, in humans, is associated with scleredema diabeticorum [30],
a dermatologic complication characterized by thickening of the skin affecting the posterior
neck. Although this dermatologic complication has never been documented in diabetic
dogs, similar skin changes might affect diabetic dogs too and, therefore, might have been
the reason for the higher skin thickness reported in this population of diabetic dogs.
Considering that the length of the sensor is 5 mm, our results suggest that the sensor
is also capable of reading IG at the dermal level instead of the subcutaneous level, as
described for human beings, where the skin thickness at the level of sensor application
(lateral aspect of the arm) is approximately 1 mm [31]. However, this is only speculation
because the location of the sensor in the dermis was not confirmed. Indeed, due to technical
reasons (i.e., reverberation artifact created by the metallic filament and limited skin surface),
it was not possible to perform a US after the application of the sensor. The median body
weight in Group 2 was significantly higher as compared to Group 1. However, both groups
included small- and large-breed dogs, and BCS was not correlated with the mean skin
thickness. Hence, it can be assumed that there is a wide individual variability in the skin
thickness, which is difficult to predict on the basis of the breed and size or BCS of the dog.
An inverse correlation between mean bias and mean skin thickness was found; more-
over, the mean bias in Group 1 was significantly higher as compared to Group 2. In both
Group 1 and Group 2, analytical accuracy based on ISO 15197:2013 requirements was not
obtained. However, in Group 2, a significantly higher percentage of IG values fell within
the desired ranges. A previous study found better results for the analytical accuracy of
the FGMS in stable diabetic dogs [1], while the results in the present study are similar to
those seen in another study in which the FGMS was used in unstable diabetic dogs [2].
These differences may be due to the fact that, in the study of Corradini et al., the accuracy
of the FGMS was evaluated by comparing the glucose measurements of the FGMS with the
plasma glucose measured using the hexokinase method, whereas, in the present study, as
well as in the Malerba et al. study, the same PBGM was used as a reference. Human PBGMs,
like the one used in this study, are plasma calibrated to enable a better comparison between
laboratory and PBGM device measurements. As the amount of glucose within erythrocytesAnimals 2021, 11, 408 9 of 12
in dogs is lower than that in humans, the human PBGM device tends to underestimate
the “true” BG concentration [32]. Therefore, in this study, the use of PBGM as reference
method might have resulted in a greater overestimation and lower underestimation of the
IG values.
The Parkes EGA showed good clinical accuracy for Group 2, with 99% of the FGMS
readings in zones A + B, while the clinical accuracy was lower in Group 1, with 94% of
FGMS readings in zones A + B. Considering all of the above results, it can be assumed
that the accuracy of the FGMS is lower in dogs with thinner skin, although ISO 15197:2013
requirements were not completely fulfilled in either group of dogs. A possible explanation
could be the fact that, in dogs with a greater skin thickness, the sensor measures the IG in
the reticular dermis (instead of the interstitial subcutaneous fluid), which is rich in water
as well as in arteriolar and venular supply [22], and it contains a third of the interstitial
fluid volume [33]. According to human studies, the hypodermis is not an ideal location for
reliable and fast glycemia tracking due to its heterogeneity and the scarce local distribution
of capillaries compared to the dermal region [34]. Indeed, interstitial fluid is more abundant
in the dermis, and dermal glucose concentration dynamics more closely follow oscillation
in the blood [35,36]. Hence, in dogs with thicker skin (>5 mm), the sensor reaches the
dermis (instead of the subcutaneous tissue), where there might be a more rapid equilibrium
due to the presence of the microcirculatory bed [23] between the blood glucose and the IG,
which makes the FGMS readings more accurate. In humans, no studies have evaluated
the influence of skin thickness on FGMS accuracy, and FGMS readings did not appear
to be affected by the BMI [37]. However, the accuracy of a different CGMS was slightly
greater in subjects with a higher BMI than in those with a lower BMI [38]. A possible
explanation is that, in human patients with lower BMI values, the reduced thickness of the
subcutaneous adipose tissue layer may result in closer sensor proximity to the underlying
muscle tissue [38]. Tissue glucose nadirs in muscle have been reported to be delayed in
time and reduced in magnitude relative to glucose in adipose tissue and blood, especially
during insulin-induced hypoglycemia [13,14]. The differences in adipose tissue blood flow
observed in subjects with different BMIs may also contribute to the apparent effect of the
BMI on accuracy [38,39]. Nevertheless, these considerations are likely not applicable to the
findings in the present study since, as stated above, in dogs, the sensor should reach the
dermal layer instead of the subcutaneous tissue where the adipose tissue is located.
At T1, a moderate erythema at the point of the sensor application was observed in three
dogs. In all dogs, the skin reaction was self-limiting without the need for any medication.
In dogs, the development of a mild erythema at the site of the sensor application has been
reported in 50% of dogs [1] and in 7% of dogs [2]. In humans, skin reactions to the FGMS
have been described in several reports [40–44] and can be irritative or allergic skin lesions.
Irritation is more common, and it is usually due to individual and physical factors [45].
Allergic contact dermatitis is less common but of greater clinical significance [46]. It is
thought to be due to the isobornyl acrylate contained in the sensor itself, which can migrate
into the adhesive part of the device and as such comes into contact with the skin, leading
to an allergic type 4 reaction [42].
There were several limitations in the present study. First, capillary BG concentrations
obtained using a PBGM not calibrated for dogs, and not using the hexokinase method,
were used as a reference to evaluate the accuracy of the FGMS. The PBGM used is known to
underestimate the real BG concentration and to be affected by the low hematocrit (anemic
dogs had greater readings than BG concentration measured by the reference method) [15];
however, in this study, no dog was anemic. Second, the small number of dogs included in
the study could have influenced the power of the statistical analysis and might have affected
the reliability of the results. According to ISO 15197:2013, evaluation of system accuracy
should be performed with at least 100 capillary blood samples from different subjects, and
the glucose levels in these samples should be distributed into defined glucose concentration
intervals between ≤2.77 mmol/L (50 mg/dL) and >22.2 mmol/L (400 mg/dL). In this
study, no samples in the hypoglycemic range were included, and the number of samplesAnimals 2021, 11, 408 10 of 12
for each group was less than 100. However, the accuracy of the FGMS in dogs has already
been studied [1]. Third, the authors did not evaluate whether the accuracy of the system
varied during the entire wearing period. However, some studies from human medicine
have demonstrated that the accuracy of the device remains stable during the 14 days
of use [37,47–49], although another study showed that after 1 week of use, the glucose
sensors produce an inflammatory reaction, which seems to compromise their accuracy [50].
Furthermore, in the previous study in which the FGMS was used in diabetic dogs, the mean
absolute relative difference (MARD) on day 14 was only slightly higher as compared to the
MARD on day 1 [1]. Considering that, in this study, skin thickness did not change during
the wearing period of the sensor, the development of mild skin inflammation should not
affect FGMS accuracy. Further, the hydration state can affect skin thickness and FGMS
accuracy [51]; however, in this study, the hydration state of the dogs was not assessed,
preventing additional analysis. Finally, concurrent diseases such as hypercortisolism and
hypothyroidism could interfere with glycemic control, contributing to glycemic variability
and influencing FGMS accuracy regardless of skin thickness. However, both groups
included dogs with concurrent diseases (four dogs in Group 1 and three dogs in Group
2), so concurrent diseases are unlikely to be responsible for the decreased accuracy of the
FGMS detected in dogs with skin thickness < 5 mm.
5. Conclusions
In conclusion, the FGMS readings seem to be affected by skin thickness and, in
particular, dogs with thicker skin have more accurate readings as compared to dogs with
thinner skin. Considering the difficulty in predicting skin thickness on the basis of dog size
and BCS, the authors recommend checking BG concentration whenever unexpected FGMS
results are obtained.
Supplementary Materials: The following are available online at https://www.mdpi.com/2076-261
5/11/2/408/s1, Table S1: Skin thickness, lifespan of the sensor, removal day of the sensor and day of
US examination at T1. NA = not applicable.
Author Contributions: Conceptualization, F.F., F.D.B. and A.D.; Methodology, F.F. and F.D.B.; formal
analysis, F.D.B. and C.C.; Investigation, F.D.B., C.C., N.L. and A.D.; Data curation, F.D.B. and
C.C.; Writing-original draft preparation, F.D.B.; writing—review and editing, F.D.B., A.D., F.F. and
R.C.; Supervision, F.F. and A.D. All authors have read and agreed to the published version of
the manuscript.
Funding: This research received no external funding.
Institutional Review Board Statement: The study was conducted according to the guidelines of
the Declaration of Helsinki, and approved by the Ethics Committee of the University of Bologna
(protocol code 64551; 25.03.2019).
Conflicts of Interest: The authors declare no conflict of interest.
References
1. Corradini, S.; Pilosio, B.; Dondi, F.; Linari, G.; Testa, S.; Brugnoli, F.; Gianella, P.; Pietra, M.; Fracassi, F. Accuracy of a Flash
Glucose Monitoring System in Diabetic Dogs. J. Vet. Intern. Med. 2016, 30, 983–988. [CrossRef]
2. Malerba, E.; Cattani, C.; Del Baldo, F.; Carotenuto, G.; Corradini, S.; Golinelli, S.; Drudi, I.; Fracassi, F. Accuracy of a flash glucose
monitoring system in dogs with diabetic ketoacidosis. J. Vet. Intern. Med. 2019, 34, 83–91. [CrossRef]
3. Metzger, M.; Leibowitz, G.; Wainstein, J.; Glaser, B.; Raz, I. Reproducibility of glucose measurements using the glucose sensor.
Diabetes Care 2002, 25, 1185–1191. [CrossRef] [PubMed]
4. Davison, L.J.; Slater, L.A.; Herrtage, M.E.; Church, D.B.; Judge, S.; Ristic, J.M.E.; Catchpole, B. Evaluation of a continuous glucose
monitoring system in diabetic dogs. J. Small Anim. Pract. 2003, 44, 435–442. [CrossRef]
5. DeClue, A.E.; Cohn, L.A.; Kerl, M.E.; Wiedmeyer, C.E. Use of Continuous Blood Glucose Monitoring for Animals With Diabetes
Mellitus. J. Am. Anim. Hosp. Assoc. 2004, 40, 171–173. [CrossRef] [PubMed]
6. Wiedmeyer, C.; DeClue, A.E. Continuous Glucose Monitoring in Dogs and Cats. J. Vet. Intern. Med. 2008, 22, 2–8. [CrossRef]
7. Hafner, M.; Lutz, T.A.; Reusch, C.E.; Zini, E. Evaluation of sensor sites for continuous glucose monitoring in cats with diabetes
mellitus. J. Feline Med. Surg. 2013, 15, 117–123. [CrossRef]Animals 2021, 11, 408 11 of 12
8. Reineke, E.L.; Fletcher, D.J.; King, L.G.; Drobatz, K.J. Accuracy of a continuous glucose monitoring system in dogs and cats with
diabetic ketoacidosis. J. Veter-Emerg. Crit. Care 2010, 20, 303–312. [CrossRef]
9. Wiedmeyer, C.E.; Johnson, P.J.; Cohn, L.A.; Meadows, R.L. Evaluation of a continuous glucose monitoring system for use in dogs,
cats, and horses. J. Am. Veter-Med. Assoc. 2003, 223, 987–992. [CrossRef]
10. Wiedmeyer, C.E.; Johnson, P.J.; Cohn, L.A. Evaluation of a continuous glucose monitoring system for use in veterinary med-icine.
Diabetes Technol. Ther. 2005, 7, 885–895. [CrossRef]
11. Affenzeller, N.; Thalhammer, J.G.; Willmann, M. Home-based subcutaneous continuous glucose monitoring in 10 diabetic dogs.
Vet. Rec. 2011, 169, 206. [CrossRef]
12. Summers, L.K.M.; Clark, M.L.; Humphreys, S.M.; Bugler, J.; Frayn, K.N. The Use of Microdialysis to Monitor Rapid Changes in
Glucose Concentration. Horm. Metab. Res. 1999, 31, 424–428. [CrossRef]
13. Moberg, E.; Hagstrom-Toft, E.; Arner, P. Protracted glucose fall in subcutaneous adipose tissue and skeletal muscle com-pared
with blood during insulin-induced hypoglycaemia. Diabetologia 1997, 40, 1320–1326. [CrossRef]
14. Horejsi, R.; Möller, R.; Pieber, T.R.; Wallner, S.; Sudi, K.; Reibnegger, G.; Tafeit, E. Differences of subcutaneous adipose tissue
topography between type-2 diabetic men and healthy controls. Exp. Biol. Med. 2002, 227, 794–798. [CrossRef]
15. Fracassi, F.; Hadar, G.S.; Pietra, M. Assessment of two portable blood glucose meters for use in cats and dogs. J. Vet. Clin. Sci.
2009, 2, 108–121.
16. Diana, A.; Preziosi, R.; Guglielmini, C.; Degliesposti, P.; Pietra, M.; Cipone, M. High-frequency ultrasonography of the skin of
clinically normal dogs. Am. J. Vet. Res. 2004, 65, 1625–1630. [CrossRef]
17. Diana, A.; Guglielmini, C.; Fracassi, F.; Pietra, M.; Balletti, E.; Cipone, M. Use of high-frequency ultrasonography for evaluation
of skin thickness in relation to hydration status and fluid distribution at various cutaneous sites in dogs. Am. J. Vet. Res. 2008, 69,
1148–1152. [CrossRef] [PubMed]
18. Parkes, J.L.; Slatin, S.L.; Pardo, S.; Ginsberg, B.H. A new consensus error grid to evaluate the clinical significance of inaccuracies
in the measurement of blood glucose. Diabetes Care 2000, 23, 1143–1148. [CrossRef] [PubMed]
19. Zanna, G.; Fondevila, D.; Ferrer, L.; Espada, Y. Evaluation of ultrasonography for measurement of skin thickness in Shar-Peis.
Am. J. Vet. Res. 2012, 73, 220–226. [CrossRef] [PubMed]
20. Milner, S.M.; Memar, O.M.; Gherardini, G.; Bennett, J.C.; Phillips, L.G. The Histological Interpretation of High Frequency
Cutaneous Ultrasound Imaging. Dermatol. Surg. 1997, 23, 43–45. [CrossRef]
21. Szymańska, E.; Nowicki, A.; Mlosek, K.; Litniewski, J.; Lewandowski, M.; Secomski, W.; Tymkiewicz, R. Skin imaging with high
frequency ultrasound—preliminary results. Eur. J. Ultrasound 2000, 12, 9–16. [CrossRef]
22. Eisenbeiss, C.; Welzel, J.; Eichler, W.; Klotz, K. Influence of body water distribution on skin thickness: Measurements using
high-frequency ultrasound. Br. J. Dermatol. 2001, 144, 947–951. [CrossRef]
23. Miller, W.H. Structure and Function of the Skin. In Muller and Kirk’s Small Animal Dermatology, 7th ed.; Miller, W.H., Griffin, C.,
Campbell, K., Eds.; Saunders: Philadelphia, PA, USA, 2012; pp. 1–56.
24. Pavletic, M.M. Anatomy and circulation of the canine skin. Microsurgery 1991, 12, 103–112. [CrossRef]
25. Young, L.A.; Dodge, J.C.; Guest, K.J.; Cline, J.L.; Kerr, W.W. Age, Breed, Sex and Period Effects on Skin Biophysical Parameters for
Dogs Fed Canned Dog Food. J. Nutr. 2002, 132, 1695S–1697S. [CrossRef]
26. Rème, C.A.; Dufour, P. Effects of repeated topical application of a 0.0584% hydrocortisone aceponate spray on skin thickness in
beagle dogs. Int. J. Appl. Res. Vet. M 2008, 8, 1–6.
27. Mantis, P.; Tontis, D.; Church, D.; Lloyd, D.; Stevens, K.; Balomenos, D.; Gouletsou, P.G.; Gianoulopoulos, G.; Doukas, D.;
Galatos, A.D.; et al. High-frequency ultrasound biomicroscopy of the normal canine haired skin. Vet. Dermatol. 2014, 25, 176-e45.
[CrossRef] [PubMed]
28. Koenig, A.; Hoenig, M.E.; Jimenez, D.A. Effects of sensor location in dogs on performance of an interstitial glucose monitor. Am.
J. Vet. Res. 2016, 77, 805–817. [CrossRef]
29. Heo, S.; Hwang, T.; Lee, H.C. Ultrasonographic evaluation of skin thickness in small breed dogs with hyperadrenocorticism. J.
Vet. Sci. 2018, 19, 840–845. [CrossRef] [PubMed]
30. Murphy-Chutorian, B.; Han, G.; Cohen, S.R. Dermatologic manifestations of diabetes mellitus: A review. Endocrinol. Metab. Clin.
N. Am. 2013, 42, 869–898. [CrossRef] [PubMed]
31. Crisan, M.; Lupsor, M.; Crisan, D.; Boca, A.; Badea, R. Ultrasonographic assessment of skin structure according to age. Indian J.
Dermatol. Venereol. Leprol. 2012, 78, 519. [CrossRef] [PubMed]
32. Feldman, E.C.; Nelson, R.W.; Reusch, C.E.; Scott-Moncrieff, J.C.R. Canine and Feline Endocrinology, 4th ed.; Elsevier Saunders: St.
Louis, MO, USA, 2015; pp. 258–308.
33. Eichler, W.; Eisenbeiss, C.; Schumacher, J.; Klaus, S.; Vogel, R.; Klotz, K.F. Changes of interstitial fluid volume in superficial tissues
detected by a miniature ultrasound device. J. Appl. Physiol. 2000, 89, 359–363. [CrossRef]
34. Cengiz, E.; Tamborlane, W.V. A Tale of Two Compartments: Interstitial Versus Blood Glucose Monitoring. Diabetes Technol. Ther.
2009, 11 (Suppl. 1), S11–S16. [CrossRef]
35. Wang, P.M.; Cornwell, M.; Prausnitz, M.R. Minimally Invasive Extraction of Dermal Interstitial Fluid for Glucose Monitoring
Using Microneedles. Diabetes Technol. Ther. 2005, 7, 131–141. [CrossRef]
36. Groenendaal, W.; Schmidt, K.; Von Basum, G.; Van Riel, N.A.W.; Hilbers, P. Modeling Glucose and Water Dynamics in Human
Skin. Diabetes Technol. Ther. 2008, 10, 283–293. [CrossRef] [PubMed]Animals 2021, 11, 408 12 of 12
37. Bailey, T.; Bode, B.W.; Christiansen, M.P. The performance and usability of a factory-calibrated Flash Glucose Monitoring System.
Diabetes Technol. Ther. 2015, 17, 787–794. [CrossRef] [PubMed]
38. Weinstein, R.L.; Schwartz, S.L.; Brazg, R.L.; Bugler, J.R.; Peyser, T.A.; McGarraugh, G.V. Accuracy of the 5-Day FreeStyle Navigator
Continuous Glucose Monitoring System: Comparison with frequent laboratory reference measurements. Diabetes Care 2007, 30,
1125–1130. [CrossRef] [PubMed]
39. Larsen, O.A.; Lassen, N.A.; Quaade, F. Blood Flow through Human Adipose Tissue Determined with Radioactive Xenon. Acta
Physiol. Scand. 1966, 66, 337–345. [CrossRef]
40. Heinemann, L.; Kamann, S. Adhesive used for diabetes medical devices: A neglected risk with serious consequences? J. Diabetes
Sci. Technol. 2016, 10, 1211–1215. [CrossRef] [PubMed]
41. Herman, A.; Aerts, O.; Baeck, M. Allergic contact dermatitis caused by isobornyl acrylate in Freestyle_Libre, a newly in-troduced
glucose sensor. Contact Dermat. 2017, 77, 367–373. [CrossRef] [PubMed]
42. Kamann, S.; Aerts, O.; Heinemann, L. Further Evidence of Severe Allergic Contact Dermatitis from Isobornyl Acrylate While
Using a Continuous Glucose Monitoring System. J. Diabetes Sci. Technol. 2018, 12, 630–633. [CrossRef] [PubMed]
43. Berg, A.K.; Norgaard, K.; Thyssen, J.P. Skin problems associated with insulin pumps and sensors in adults with Type 1 dia-betes:
A cross-sectional study. Diabetes Technol. Ther. 2018, 20, 475–482. [CrossRef]
44. Berg, A.K.; Simonsen, A.B.; Svensson, J. Perception and possible causes of skin problems to insulin pump and glucose sensor:
Re-sults from pediatric focus groups. Diabetes Technol. Ther. 2018, 20, 566–570. [CrossRef] [PubMed]
45. Tan, C.-H.; Rasool, S.; Johnston, G.A. Contact dermatitis: Allergic and irritant. Clin. Dermatol. 2014, 32, 116–124. [CrossRef]
46. Kamann, S.; Oppel, E.; Liu, F.; Reichl, F.-X.; Heinemann, L.; Högg, C. Evaluation of Isobornyl Acrylate Content in Medical Devices
for Diabetes Treatment. Diabetes Technol. Ther. 2019, 21, 533–537. [CrossRef]
47. Hoss, U.; Budiman, E.S. Factory-Calibrated Continuous Glucose Sensors: The Science Behind the Technology. Diabetes Technol.
Ther. 2017, 19, S44. [CrossRef]
48. Ji, L.; Guo, X.; Guo, L.; Ren, Q.; Yu, N.; Zhang, J. A Multicenter Evaluation of the Performance and Usability of a Novel Glucose
Monitoring System in Chinese Adults with Diabetes. J. Diabetes Sci. Technol. 2016, 11, 290–295. [CrossRef] [PubMed]
49. Ólafsdóttir, A.F.; Attvall, S.; Sandgren, U.; Dahlqvist, S.; Pivodic, A.; Skrtic, S.; Theodorsson, E.; Lind, M. A Clinical Trial of the
Accuracy and Treatment Experience of the Flash Glucose Monitor FreeStyle Libre in Adults with Type 1 Diabetes. Diabetes Technol.
Ther. 2017, 19, 164–172. [CrossRef] [PubMed]
50. Rigla, M.; Pons, B.; Rebasa, P.; Luna, A.; Pozo, F.J.; Caixàs, A.; Villaplana, M.; Subías, D.; Bella, M.R.; Combalia, N. Human
Subcutaneous Tissue Response to Glucose Sensors: Macrophages Accumulation Impact on Sensor Accuracy. Diabetes Technol.
Ther. 2018, 20, 296–302. [CrossRef] [PubMed]
51. Silva, D.; Cecci, G.; Biz, G.; Chiaro, F.; Zanutto, M. Evaluation of a flash glucose monitoring system in dogs with diabetic
ketoacidosis. Domest. Anim. Endocrinol. 2021, 74, 106525. [CrossRef]You can also read