The Integration and Testing Program for the Simons Observatory Large Aperture Telescope Optics Tubes
←
→
Page content transcription
If your browser does not render page correctly, please read the page content below
The Integration and Testing Program for the Simons
                                                       Observatory Large Aperture Telescope Optics Tubes
                                               Kathleen Harringtona , Carlos Sierrab , Grace Chesmoreb , Shreya Sutariyab , Aamir M. Alic ,
                                              Steve K. Choi d,e , Nicholas F. Cothardf , Simon Dickerg , Nicholas Galitzkih , Shuay-Pwu Patty
                                              Hoi , Anna M. Kofmang , Brian J. Koopmanj , Jack Lashnerk , Jeff McMahona,b,l,m , Michael D.
                                              Niemackd,e , John Orlowski-Schererg , Joseph Seiberth , Max Silva-Feaverh , Eve M. Vavagiakisd ,
                                                                              Zhilei Xug,n , and Ningfeng Zhug
arXiv:2102.02129v1 [astro-ph.IM] 3 Feb 2021

                                              a
                                               Department of Astronomy and Astrophysics, University of Chicago, Chicago, IL, 60637, USA
                                                            b
                                                               Department of Physics, University of Chicago, Chicago, IL 60637, USA
                                                     c
                                                       Department of Physics, University of California, Berkeley, Berkeley, CA, 94720, USA
                                                                 d
                                                                   Department of Physics, Cornell University, Ithaca, NY 14853, USA
                                                            e
                                                               Department of Astronomy, Cornell University, Ithaca, NY 14853, USA
                                              f
                                                Department of Applied and Engineering Physics, Cornell University, Ithaca NY, 14853, USA
                                              g
                                                Department of Physics and Astronomy, University of Pennsylvania, Philadelphia, PA, 19104,
                                                                                                USA
                                                    h
                                                      Department of Physics, University of California, San Diego, La Jolla, CA 92093, USA
                                                             i
                                                               Department of Physics, Stanford University, Stanford, CA 94305, USA
                                                               j
                                                                 Department of Physics, Yale University, New Haven, CT 06520, USA
                                                k
                                                  Department of Physics and Astronomy, University of Southern California, Los Angeles CA,
                                                                                            90089, USA
                                                  l
                                                    Kavli Institute for Cosmological Physics, University of Chicago, Chicago, IL 60637, USA
                                                            m
                                                               Enrico Fermi Institute, University of Chicago, Chicago, IL 60637, USA
                                                 n
                                                   MIT Kavli Institute, Massachusetts Institute of Technology, Cambridge, MA, 02139, USA
                                                                                                Dec. 15 2020

                                                                                               ABSTRACT
                                              The Simons Observatory (SO) will be a cosmic microwave background (CMB) survey experiment with three
                                              small-aperture telescopes and one large-aperture telescope, which will observe from the Atacama Desert in Chile.
                                              In total, SO will field over 60,000 transition-edge sensor (TES) bolometers in six spectral bands centered between
                                              27 and 280 GHz in order to achieve the sensitivity necessary to measure or constrain numerous cosmological
                                              quantities, as outlined in The Simons Observatory Collaboration et al. (2019). The 6 m Large Aperture Telescope
                                              (LAT), which will target the smaller angular scales of the CMB, utilizes a cryogenic receiver (LATR) designed
                                              to house up to 13 individual optics tubes. Each optics tube is comprised of three silicon lenses, IR blocking
                                              filters, and three dual-polarization, dichroic TES detector wafers. The scientific objectives of the SO project
                                              require these optics tubes to achieve high-throughput optical performance while maintaining exquisite control of
                                              systematic effects. We describe the integration and testing program for the SO LATR optics tubes that will verify
                                              the design and assembly of the optics tubes before they are shipped to the SO site and installed in the LATR
                                              cryostat. The program includes a quick turn-around test cryostat that is used to cool single optics tubes and
                                              validate the cryogenic performance and detector readout assembly. We discuss the optical design specifications
                                              the optics tubes must meet to be deployed on sky and the suite of optical test equipment that is prepared to
                                              measure these requirements.
                                                  Further author information: (Send correspondence to K.H: katieharrington@uchicago.edu)
1. INTRODUCTION
Observations of the cosmic microwave background (CMB) continue to revolutionize our understanding of the
contents and evolution of the universe1–8 and Simons Observatory (SO) is one of the next observatories dedicated
to extending these observations to new regimes.9 SO consists of one Large Aperture Telescope (LAT) optimized
to target smaller angular scale fluctuations in the CMB temperature and polarization and three Small Aperture
Telescopes (SATs) targeting the larger angular scales. The LAT will observe over 40% of the sky across six
frequency bands from 27 to 280 GHz, where the bands are chosen to span the Galactic foreground minima
and avoid regions of high atmospheric emission. The high resolution maps made by the LAT will contain the
damping tail of the CMB power spectra, enabling measurements of cosmological parameters such as the sum of
the neutrino masses.9 These maps will also measure the gravitational lensing of the CMB as it traverses the
universe and observe the thermal and kinematic Sunyaev–Zeldovich effects from thousands of galaxy clusters;
observations of the late time universe which can shed light on the current tension between early and late-time
measures of the Hubble parameter.10
     The LAT has two 6 m mirrors in a cross-Dragone configuration that focus light into the Large Aperture
Telescope Receiver (LATR) cryostat. This 2.4 m diameter cryostat is designed to hold up to 13 optics tubes,
seven of which will be populated for the initial phase of SO.11 Each optics tube uses three silicon lenses, anti-
reflection coated with meta-material layers diced into the surfaces,12 to reimage the incoming light onto a focal
plane comprised of three Universal Focalplane Modules (UFMs),13 that house the detectors and coupling optics
for each frequency band. Each pixel in the UFM is dichroic and dual-polarization, meaning three flavors of UFMs
at low, mid, and ultra-high frequency (LF, MF, and UHF, respectively) are required for the six frequency bands
used in SO. Each optics tube will contain three UFMs of the same flavor with AR coatings and low-pass edge
filters matched to those particular bands. In total, the seven optics tubes in the initial phase of SO will contain
nearly 32,000 transition edge sensor (TES) detectors14, 15 that will be read out using microwave multiplexing
(µMux) SMuRF electronics.16, 17
    The scientific goals of SO require high sensitivity maps with low levels of systematics effects. Achieving these
unprecedented requirements necessitates quality control at all levels of the design and integration process. Here
we discuss the integration and testing program for the SO LATR optics tubes. In Section 2 we describe the
single optics tube test cryostat that has been developed using an SAT cryostat to decouple the optical testing
from the development of the LATR cryostat and in Section 3 we provide an overview of the identified critical
metrics that require optics tube level testing before deployment to the SO site.

                  2. OPTICS TUBE TESTING PLATFORM: LATR TESTER
The optical testing of the LATR optics tubes was decoupled from the LATR integration and testing to optimize
the personnel and time resources before deployment. A fully loaded LATR cryostat is expected to take 35 days
to cool down to 100 mK.18 A quick turn around single-tube test cryostat will perform optical validation mea-
surements in parallel to LATR integration and allows for more and varied cool downs of optics tubes if design
changes are necessary. In addition, decoupling Optics Tube testing from LATR integration means Optics Tube
testing can continue after the LATR has been shipped to Chile and LAT commissioning has begun.
    This LATR tester (LATRt), shown in Figure 1, was built out of one of the SO SAT cryostats that is slated for
later deployment after LATR optics tube testing is completed. The design of the SAT cryostats was presented
in Galitzki et al. 2018.14 Each SAT cryostat has four temperature stages nominally at 40, 4, 1, and 0.1 Kelvin.
The “backend” of these cryostats contains the cryocoolers and the housekeeping and detector readout paths and
the “frontend” holds the different optical elements. Cooling power is provided by a Bluefors SD400 Dilution
Refrigerator∗ backed by a Cryomech PTC-420 cryocooler† and an additional PTC-420 mounted directly to the
backend 40 K and 4 K shells. In total, each SAT is expected to have 110 W of cooling power at 40 K, 4 W at
4 K, 10 mW at 1 K, and 400 µW at 100 mK.
   The mechanical design of the LATR was presented in Zhu et. al. 2018.11 When compared to the SAT, the
length of the LATR optics tubes is significantly longer. Converting an SAT into the LATRt required extending
   ∗
       https://bluefors.com/products/sd-dilution-refrigerator/
   †
       https://www.cryomech.com/products/pt420/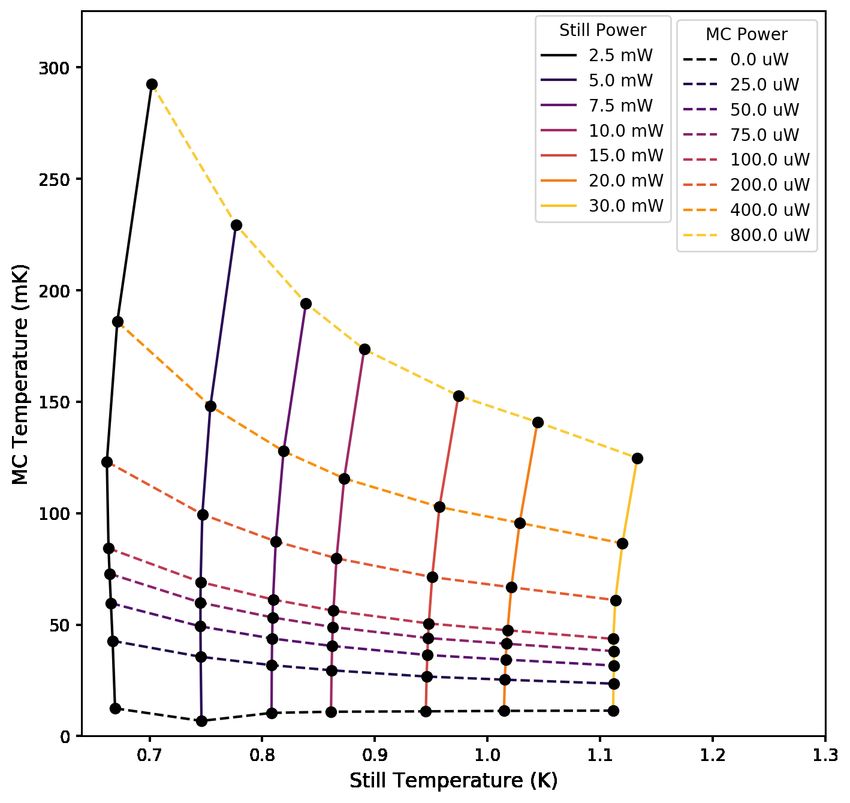
1025 mm
Vacuum Extension
Meta-material
Black Tiles in 40K Front
OT Front End Extension
1560 mm
4K Adapter
Plate for OT
Mounting
Heat strapping between SAT
DR and OT Cold Fingers
Two-piece LATR
80K pseudo-stage Front Emulator
with shield
Six G10
Support
NDF
Tabs
Mount
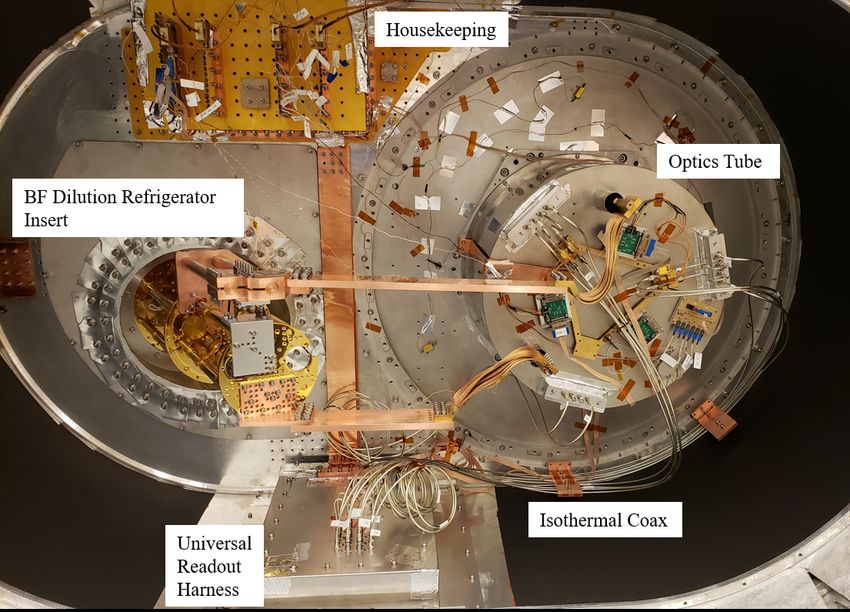
Figure 1. The upper figure shows a cross-section of the LATR-Tester cryostat while the lower figure shows a more detailed
section of the front-end developed to emulate the optical setup of the LATR cryostat. The various alterations made to
the SAT cryostat to enable LATR optics tube testing are indicated.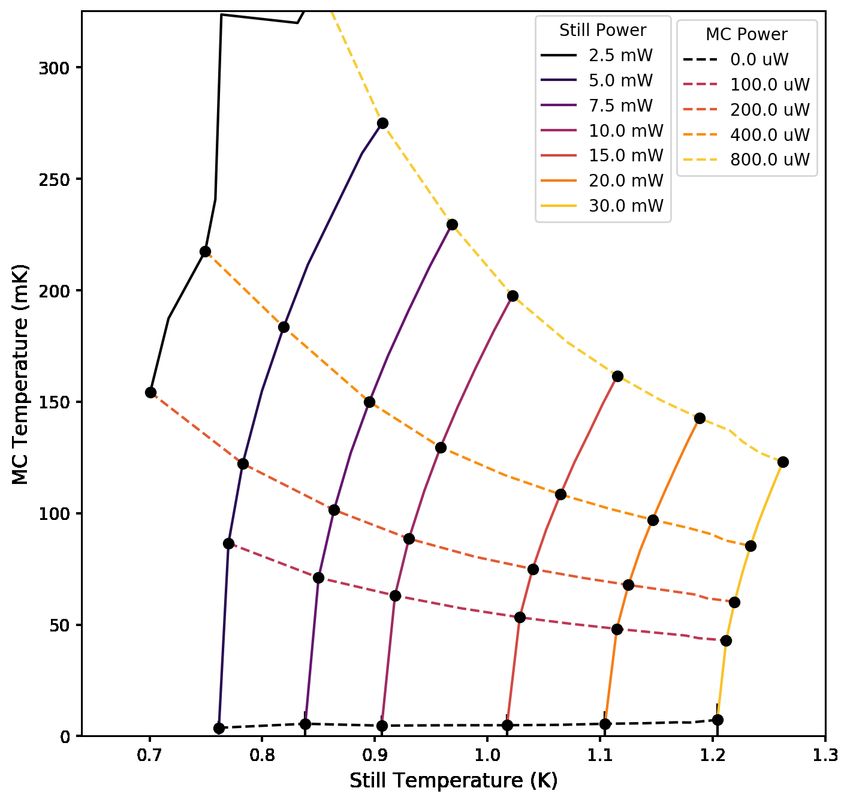
Figure 2. Load curves taken with the LATRt Bluefors SD400 Dilution Refrigerator (left) held vertically before installation
in the LATRt cryostat and (right) held at 27.5◦ after installation in the LATRt but with no connections on the still or
mixing chamber.

both the frontend vacuum shell and the 40 K frontend. This was accomplished by replacing the vacuum shell
intended for the SAT half-waveplate with a longer version that placed the window the correct distance from the
UFMs. The LATR window plate is about 6 cm thick, a thickness that is required due to its 2.3 m diameter.
This thickness is unnecessary in the LATRt, so a second aluminum piece is attached to the vacuum side of the
LATRt window plate to emulate that thickness and hold the 300 K double-sided IR (DSIR) filters19 in positions
to match the LATR.
    In addition to the extra required length, the LATR has an addition temperature stage, nominally at 80 K,
cooled by single-stage Cryomech P90 pulse-tube coolers. This stage holds additional DSIR filters and a meta-
material AR coated alumina IR absorbor. Six G10 standoffs are used to build a pseudo-80 K stage in the LATRt,
this stage is thermally connected to the 40 K stage via four two-layer heat-straps of 5N Aluminum. In practice,
this stage is completely thermally coupled to the 40 K stage below. Lastly, a 4 K optics tube mounting plate
was installed on the 4 K backend and the SAT frontend 4 K shell was removed to further emulate the LATR
cryogenic setup.
   Housekeeping and detector readout is achieved with very few changes compared to the SAT and optics tube
architecture. This is due to the interchangeability between the LATR and SAT systems. The warm and cold
thermometry breakout boards and wiring for both cryogenic systems are nearly identical; only one additional
cryogenic cable is required to incorporate LATR optics tube housekeeping into the SAT system. Similarly, the
µMux readout for the LATR and SAT cryostats use identical universal readout harnesses (URHs)20 for readout
components between 300 K and 4 K. Connecting the LATR optics tube cold readout assembly20 to the SAT
URH only required 12 additional runs of isothermal hand-flexible coaxial cables.
   The LATRt completed several integration and calibration cooldowns before the first optics tube installation.
The installations of the pulse-tube cryocooler and the dilution refrigerator were validated. Load curves at all
stages were taken before the optics tube was installed in the LATRt. Figure 2 shows the Bluefors SD400 DR
capacity map before it was installed in the LATRt (left) and after it was installed in the LATRt (right). In
the LATRt it operates at a 27.5◦ angle with respect to gravity,‡ which reduces its cooling capacity. The base
temperature before installation was below 7 mK and it was about 12 mK in the LATRt without an optics tube
attached. Even tilted at 27.5◦ and set inside a 4 K shell, the DR mixing chamber has 400 µW of available cooling
   ‡
       The tilting of the DR is due to the in-lab setup, the deployment configuration for the SAT DRs is close to 0◦ .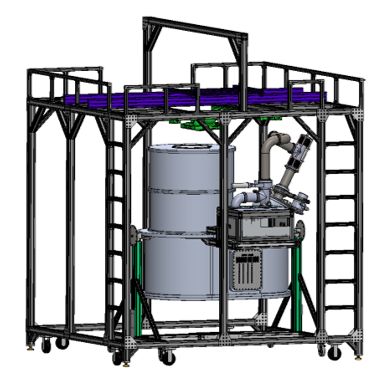
power at 100 mK. This level of cooling power is nearly equal to that of the LATR DR21 and completely sufficient
for running one LATR optics tube.
     In subsequent tests, the LATRt has been used to measure the cryogenic optical loading of the front-end
filtering scheme for the LATR. The combined optical loading on the 80 K and 40 K stage was 9.7 W for the set
of filters tested in the LATRt.§ This was higher than the expected loading of 3.9 W and was traced to a higher
than expected blue-leak above the DSIR cutoff frequency. The optics tube and URH were also installed and the
parasitic cryogenic loading from the optics tube was measured to be 4.2 ± 0.2 µW on the 100 mK stage, in good
agreement with expectations and measurements in the LATR. With this final set of validations complete, the
LATRt is ready to proceed with the LATRt optics tube testing program.

                      3. REQUIREMENTS FOR INTEGRATION TESTING
The LATRt testing program is designed to ensure the LATR Optics Tube design achieves, at a minimum, the
baseline noise requirements laid out in Simons Observatory Collaboration et al.9 Discounting survey parameters,
such as scan pattern and integration time, the noise levels in SO maps will be determined by the array Noise
Equivalent Temperatures (NETs) of each deployed optics tube. As discussed in Hill et al.,22 if every detector in
an array has the same properties, the array NET is
                                                  q
                                              Γ    NEP2ph + NEP2g + NEP2read
                                    NETarr   =√             √              .                                      (1)
                                                2        dP
                                                                Y Ndet
                                                       dTCMB

In this √
        equation, the Noise Equivalent Power (NEP)s are the contributions to the total single-detector NEP
(in W/ Hz units) from photons, thermal carrier noise, and readout noise, respectively, dTdP      CMB
                                                                                                      is the end-to-end
optical efficiency that is used to convert between units of power and temperature, Ndet is the number of detectors
in the array, Y is the yield, the fraction of working detectors, and Γ is the level of optical white noise correlations.
The LATRt testing program focuses on the aspects of this equation that depend on the performance of the LATR
Optics Tubes and cannot be tested at smaller scales (i.e. testing of individual detector modules). The testing
program will validate the designs of the different flavors (LF, MF, and UHF) of optics tube, meaning one tube
per flavor will undergo the tests laid out below.

3.1 Sensitivity
The denominator of Equation 1 has a few different factors that affect the overall sensitivity of the array. The
Y Ndet combination represents the number of working detectors in any array. This will be measured for individual
detector modules (UFMs), and again once the the UFMs have been integrated into the Optics Tube with all
the associated readout components.20 Each MF and UHF UFM will contain 864 optical detectors per frequency
band while each LF UFM will have 74 optical detectors per band. The SO baseline noise projections assume a
70% yield across all arrays.
    Each Optics Tube tested in the LATRt will be cooled down with a blank-off plate and a cold load at the end
of the optics tube at 4 K. IV curves, saturation powers, and dark noise levels will be measured for all detectors
in this configuration to ensure the arrays have been successfully integrated into the optics tube.
    The blank-off plate will be removed and replaced with up to three different neutral density filters (NDFs)
designed to cut the optical loading on the detectors to less than 1/2 of the detector’s saturation power. This will
enable in-lab optical testing where the ∼293 K environment is much brighter than the ∼10 K atmospheric signal
expected during normal operations at the Atacama site. The NDFs used will be primarily absorptive, made out
machinable Eccosorb¶ of various loss levels and thicknesses which will be tuned to the frequency bands under
test. The 4 K NDF mounting plate is designed to allow changes between different NDF options in situ, without
removal of the entire optics tube. Successive cool-downs with different NDF properties can be used to further
   §
     A similar level of loading was observed for this filter set in the LATR21
   ¶
     https://www.laird.com/products/absorbers/
injection-molded-machined-cast-liquids-and-microwave-absorbing-thermoplastic/eccosorb-mf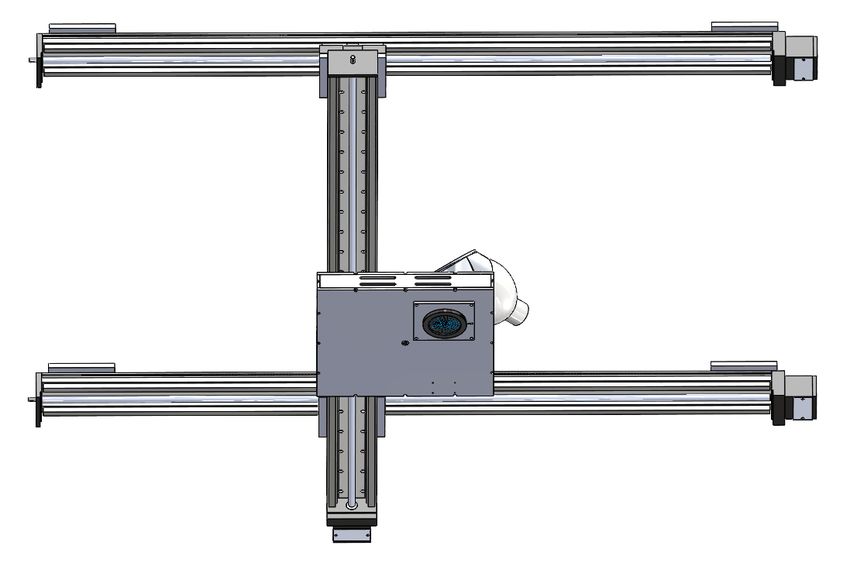
calibrate the transmission of the NDFs or to optimize the optical loading between the upper and lower bands on
each UFM.
     The end-to-end optical efficiency, the dP/dTcmb factor in the denominator of Equation 1, is a component
that cannot be tested without a fully integrated optics tube. As described in Hill et. al.,22 the end-to-end optical
efficiency accounts for the transmission through every optical element as well as the stop efficiency and the
detector efficiency. This factor will be measured using chops of beam filling thermal loads ranging from 293 to
350 Kelvin. These thermal loads are 1 m by 1 m plates covered with meta-material absorbing black tiles (see Ref.
23) mounted on sliders positioned above the window of the cryostat. Heater elements on the back of these plates
will actuate the temperatures of the tiles and an infrared thermometer will be used to measure the temperatures
on the side of the plates facing the cryostat window. These measurements will be performed with multiple NDF
options in front of the same detector/optical setup to simultaneously calibrate the NDF transmission and the
optical efficiency of the rest of the system. The combined in-lab measurements of detector yield and end-to-end
optical efficiency must be sufficient to achieve the baseline array NETs required for the SO science goals.

3.2 Detector Noise Equivalent Power
The numerator of Equation 1 contains the different contributions to the single-detector NEPs for the array.
Simons Observatory, as with most CMB experiments, aims to be photon noise limited, meaning the NEP due
to photons is larger than the thermal carrier noise and readout noise. For the wavelengths of interest here, both
shot noise and wave noise contribute to NEPph , but both of these factors depend on the total optical loading on
the detectors.
    Due to the nature of in-lab characterizations, including the need for NDFs and absence of the 6 meter LAT
mirrors, the optical loading during optics tube testing will not match the expected on-sky loading. However,
several instrument performance parameters that are expected to impact the on-sky optical loading can be verified
in-lab. The two of these that are most important for the science goals of the LAT are end-to-end bandpass and
spill to 300 K.

3.2.1 Bandpass
The end-to-end bandpasses of a CMB instrument affects both the overall sensitivity of the instrument and more
systematic effects such as the separation of galactic foregrounds emission from the CMB signals. Investigating the
galactic foreground separation requirements leads to a final on-sky bandpass calibration requirement of better
than 0.5%24 for the SO instruments. However, the requirements for in-lab validation measurements are less
stringent because these measurements are primarily concerned with ensuring the sensitivity of the instrument.
   A Fourier Transform Spectrometer (FTS) in the style of the PIXIE25 instrument with refractive coupling
optics will be used to measure the end-to-end bandpasses for the optics tubes. The band-edges for the integrated
optics tube and UFMs must be within 2% of the designed values, ensuring the edges are far enough from
atmospheric absorption features to achieve the desired on-sky optical loading. The measured bandpasses will be
propagated through the SO instrument sensitivity tracking, which must result in projected noise levels consistent
with those in Simons Observatory Collaboration et al.9 High precision bandpass calibrations will be performed
on-site where NDFs are unnecessary.

3.2.2 Spill to 300 K
The fraction of the beam that spills to 300 Kelvin has a significant effect on the optical loading on the detectors.
During the design of the LAT instrument, it was found that spill to 300 K was one of the main drivers in the
projected sensitivity overall and that reducing this spill could significantly reduce the noise in the resulting SO
maps.
   As described in Gudmundsson et al.,26 a substantial effort has gone into controlling the scattering inside the
optics tubes to reduce this warm spill, including the design of meta-material absorbing black tiles11 that will
be used instead of baffles blackened with carbon-loaded Stycast‖ in the upper region of the optics tubes. The
LATRt will be verifying that these efforts were successful before the optics tubes are deployed to the site.
   ‖
       https://www.henkel-adhesives.com/us/en/product/loctite_stycast_2850ft.html
Figure 3. (Left) The instrument mounting structure designed to hold the different sets of optical test equipment and
roll over the LATRt cryostat during operation. Sliders, shown in blue, will be used to measure the end-to-end optical
efficiency through chopping of beam-filling thermal sources at different temperatures. (Right) The XY-stage with 150 cm
of travel in both directions which mounts to the underside of the instrument mounting structure and will be used for both
thermal and holographic beam mapping.
The upgraded optics tube baffling design reduces the expected scattering at large angles (& 30◦ ) from -25 dB
to -50 dB levels. Similarly, constraining the spill outside of the secondary mirror to a 1% level will require
mapping the beam down to about -33 dB to measure a significant enough fraction of the total beam.
The LATRt will use two different types of beam mapping to verify the efficacy of the black tiles and constrain
the expected warm spill. First, we use a 600◦ C IR source mounted behind a spinning chopper wheel with an
adjustable aperture. The source will be mounted on an XY stage with 150 cm of travel in both directions. With
this source, a 25 mm aperture, and a 5% transmissive NDF, we expect to require 1 second of integration time to
measure a -36 dB signal at a signal-to-noise ratio of one. This sensitivity is expected to be sufficient to verify that
the black tiles perform better than the carbon-loaded stycast simulations and to map the beam to low enough
levels to constrain the warm spill to a 1% level.
Measuring the amount of scattering expected from the black tiled optics tube requires measuring the beams
down to a -50 to -60 dB level. This is unlikely to be possible with thermal sources in lab but may be possible
with holographic measurements of the detector beams. This measurement uses a coherent source and receiver
to measure the amplitude and phase of the electric fields across a two-dimensional surface in front of the optics
tube window. A coherent receiver will be mounted on a feedhorn array at the optics tube focal plane, with
signals transmitted through the cryogenic coaxial cables used for the SMuRF µMux system. The source will be
mounted on the same XY stage used for the thermal beam mapping. These beam maps will be compared to
simulations of the expected beams at the measurement plane to verify the effectiveness of the black tiles.
4. STATUS AND OUTLOOK
At the time of these proceedings, the LATRt cryostat, pictured in Figure 4, has been integrated and cryogenically
tested with all major components except UFMs (detectors) and the optics tube IR filters. Those will be installed
next and the LATRt Testing program will begin characterizing the performance of the first MF optics tube. In
depth testing is currently planned for one of each flavor (LF, MF, UHF) of optics tube to verify the design ofFigure 4. The backend of the integrated LATRt cryostat, showing the installed optics tube, universal readout harness, housekeeping, and Bluefors DR insert. Custom heat straps are used to connect the DR stages to the optics tube cold fingers that provided a cooling path the the 1 K and 100 mK stages.
each of type of optics tube. Testing on the other four optics tubes that are part of the nominal-SO plan will
depend on hardware availability and deployment schedules.

                                        ACKNOWLEDGMENTS
This work was funded by the Simons Foundation (Award #457687, B.K.). KH was supported by the U.S.
Department of Energy, Office of Science, under Award Number DE-SC0015799. ZX is supported by the Gordon
and Betty Moore Foundation.

                                              REFERENCES
 [1] Planck Collaboration et al., “Planck 2018 results. VI. Cosmological parameters,” ArXiv e-prints (July 2018).
 [2] Choi, S. K., Hasselfield, M., Ho, S.-P. P., Koopman, B., Lungu, M., et al., “The Atacama Cosmology
     Telescope: A Measurement of the Cosmic Microwave Background Power Spectra at 98 and 150 GHz,” arXiv
     e-prints , arXiv:2007.07289 (July 2020).
 [3] Aiola, S., Calabrese, E., Maurin, L., Naess, S., Schmitt, B. L., et al., “The Atacama Cosmology Telescope:
     DR4 Maps and Cosmological Parameters,” arXiv e-prints , arXiv:2007.07288 (July 2020).
 [4] Louis, T. et al., “The Atacama Cosmology Telescope: two-season ACTPol spectra and parameters,” Journal
     of Cosmology and Astro-Particle Physics 2017, 031 (June 2017).
 [5] Omori, Y. et al., “A 2500 deg2 CMB Lensing Map from Combined South Pole Telescope and Planck Data,”
     ApJ 849, 124 (Nov. 2017).
 [6] Henning, J. W. et al., “Measurements of the Temperature and E-mode Polarization of the CMB from 500
     Square Degrees of SPTpol Data,” ApJ 852, 97 (Jan. 2018).
 [7] Adachi, S. et al., “A measurement of the CMB E-mode angular power spectrum at subdegree scales from
     670 square degrees of POLARBEAR data,” arXiv e-prints , arXiv:2005.06168 (May 2020).
 [8] Abazajian, K. N. et al., “CMB-S4 Science Book, First Edition,” arXiv e-prints , arXiv:1610.02743 (Oct
     2016).
 [9] Simons Observatory Collaboration et al., “The Simons Observatory: science goals and forecasts,” J. Cos-
     mology Astropart. Phys. 2019, 056 (Feb. 2019).
[10] Verde, L., Treu, T., and Riess, A. G., “Tensions between the early and late Universe,” Nature Astronomy 3,
     891–895 (Sept. 2019).
[11] Zhu, N. et al., “Simons Observatory large aperture telescope receiver design overview,” in [Millimeter,
     Submillimeter, and Far-Infrared Detectors and Instrumentation for Astronomy IX], Zmuidzinas, J. and
     Gao, J.-R., eds., Society of Photo-Optical Instrumentation Engineers (SPIE) Conference Series 10708,
     1070829 (July 2018).
[12] Golec, J. E. et al., “Design and Fabrication of Metamaterial Anti-Reflection Coatings for the Simons Ob-
     servatory,” in [Society of Photo-Optical Instrumentation Engineers (SPIE) Conference Series], (Dec. 2020).
     in preparation.
[13] Healy, E. et al., “Assembly development for the Simons Observatory focal plane readout module,” in [Society
     of Photo-Optical Instrumentation Engineers (SPIE) Conference Series], (Dec. 2020). in preparation.
[14] Galitzki, N. et al., “The Simons Observatory: instrument overview,” in [Millimeter, Submillimeter, and Far-
     Infrared Detectors and Instrumentation for Astronomy IX ], Zmuidzinas, J. and Gao, J.-R., eds., Society of
     Photo-Optical Instrumentation Engineers (SPIE) Conference Series 10708, 1070804 (July 2018).
[15] Stevens, J. R. et al., “Characterization of Transition Edge Sensors for the Simons Observatory,” Journal of
     Low Temperature Physics 199, 672–680 (Feb. 2020).
[16] Henderson, S. W. et al., “Highly-multiplexed microwave SQUID readout using the SLAC Microresonator
     Radio Frequency (SMuRF) electronics for future CMB and sub-millimeter surveys,” in [Millimeter, Sub-
     millimeter, and Far-Infrared Detectors and Instrumentation for Astronomy IX], Zmuidzinas, J. and Gao,
     J.-R., eds., 10708, 170 – 185, International Society for Optics and Photonics, SPIE (2018).
[17] Sathyanarayana Rao, M. et al., “Simons Observatory Microwave SQUID Multiplexing Readout: Cryogenic
     RF Amplifier and Coaxial Chain Design,” Journal of Low Temperature Physics 199, 807–816 (Mar. 2020).
[18] Coppi, G. et al., “Cooldown strategies and transient thermal simulations for the Simons Observatory,” in
[Millimeter, Submillimeter, and Far-Infrared Detectors and Instrumentation for Astronomy IX ], Zmuidzinas,
J. and Gao, J.-R., eds., Society of Photo-Optical Instrumentation Engineers (SPIE) Conference Series
10708, 1070827 (July 2018).
[19] Pisano, G., Tucker, C., Ade, P. A. R., Moseley, P., and Ng, M. W., “Metal mesh based metamaterials for
millimetre wave and thz astronomy applications,” in [2015 8th UK, Europe, China Millimeter Waves and
THz Technology Workshop (UCMMT) ], 1–4 (2015).
[20] Sathyanarayana Rao, M. et al., “Simons Observatory Microwave SQUID Multiplexing Readout: Cryogenic
RF Amplifier and Coaxial Chain Design,” Journal of Low Temperature Physics 199, 807–816 (Mar. 2020).
[21] Xu, Z., Bhandarkar, T., Coppi, G., Kofman, A., Orlowski-Scherer, J. L., Zhu, N., et al., “The Simons Ob-
servatory: the Large Aperture Telescope Receiver (LATR) Integration and Validation Results,” in [Society
of Photo-Optical Instrumentation Engineers (SPIE) Conference Series], (Dec. 2020). in preparation.
[22] Hill, C. A. et al., “BoloCalc: a sensitivity calculator for the design of Simons Observatory,” in [Millimeter,
Submillimeter, and Far-Infrared Detectors and Instrumentation for Astronomy IX ], Zmuidzinas, J. and Gao,
J.-R., eds., Society of Photo-Optical Instrumentation Engineers (SPIE) Conference Series 10708, 1070842
(July 2018).
[23] Xu, Z. et al., “The Simons Observatory: Metamaterial Microwave Absorber (MMA) and its Cryogenic
Applications,” arXiv e-prints , arXiv:2010.02233 (Oct. 2020).
[24] Ward, J. T., Alonso, D., Errard, J., Devlin, M. J., and Hasselfield, M., “The effects of bandpass variations
on foreground removal forecasts for future cmb experiments,” The Astrophysical Journal 861, 82 (Jul 2018).
[25] Kogut, A., Fixsen, D. J., Chuss, D. T., et al., “The Primordial Inflation Explorer (PIXIE): a nulling
polarimeter for cosmic microwave background observations,” J. Cosmology Astropart. Phys. 2011, 025
(July 2011).
[26] Gudmundsson, J. E. et al., “The Simons Observatory: Modeling Optical Systematics in the Large Aperture
Telescope,” arXiv e-prints , arXiv:2009.10138 (Sept. 2020).You can also read