Optical Mapping of the Fusarium oxysporum f. sp. melongenae Genome
←
→
Page content transcription
If your browser does not render page correctly, please read the page content below
Optical Mapping of the Fusarium oxysporum f. sp.
melongenae Genome
Duygu Ates
Ege University: Ege Universitesi
Hacer Handan Altinok
Erciyes University: Erciyes Universitesi
Bahattin Tanyolaç ( bahattin.tanyolac@ege.edu.tr )
Ege Universitesi https://orcid.org/0000-0002-4368-0988
Research Article
Keywords: Fusarium oxysporum f. sp. melongenae, optical mapping, bionano, eggplant, genome,
sequencing
Posted Date: September 24th, 2021
DOI: https://doi.org/10.21203/rs.3.rs-915548/v1
License: This work is licensed under a Creative Commons Attribution 4.0 International License.
Read Full License
Page 1/11Abstract
Optical mapping approaches are widely preferred and applied in different branches of genomic studies
because of their accuracy, low cost, and high efficiency. In the current study, a sequence orientation of the
Fusarium oxysporum f. sp. melongenae (FOMG) genome that is deposited in GenBank NCBI under
accession number MPIL00000000 was used as the reference genome, which we checked with Bionano
Genomics (BNG) optical mapping approaches. BNG optical mapping produced 103 contigs, the longest
of which was 3.05 Mb. The N50 value of BNG contigs is 0.85 Mb. The sequences of the FOMG reference
genome and BNG optical map mainly match each other. Results obtained in the current study indicate
that BNG optical mapping can be used to construct complete and gapless assemblies of the FOMG
genome. It also can be applied to validate a previous genome assembly.
1. Introduction
Eggplant (Solanum melongena, 2n = 24) is an economically important vegetable crop, especially in warm
and tropical climate locations. Comparable to tomatoes in total nutritional value, it is a rich source of
various vitamins and minerals [1]. FOMG is the causal agent of fusarium wilt on eggplant, and it is one of
the most important and widespread fungal diseases that limit the production of eggplant around the
world [1–4]. This disease reported in Japan [5], Kenya [6], the Netherlands [7], USA [8, 9], Italy [10], Greece
[11], Korea [12], Spain [13], China [14], and Turkey [1, 2, 15]. This disease arises under suitable
environmental conditions, and eggplants that are affected by this fungus present with characteristic
vascular wilt symptoms that primarily consist of slight vein clearing and chlorosis of the leaf on the outer
leaflets. The leaves turn yellow and eventually fall off. Discoloration of xylem is observed in the following
period and finally the above-ground parts of the eggplant die [1]. Control of this disease is very difficult,
and the fungus can spread widely and remain in the soil for years. Furthermore, suppression of this
fungus is difficult due to the limited availability of recommended registered fungicides [1]. Therefore,
control of fusarium wilt requires the development of FOMG-resistant eggplant varieties.
Having sufficient information about the genetic structure of a pathogen is the most important
requirement for developing resistant varieties. Recent genetic research on FOMG has benefited from a
partially ordered draft genome sequence assembly that was uploaded to GenBank from the National
Center for Biotechnology Information (NCBI) since in 2017 [16]. However, there are some limitations in
these currently available data, and these limitations are usually the direct results of two typical genomic
properties: (i) too many repetitive and transposable elements [17], and (ii) significantly decreased meiotic
recombination frequency in pericentromeric regions [18]. The F. oxysporum genome contains core and
lineage-specific regions [19]; core regions are conserved in all strains of F. oxysporum, while lineage-
specific regions generally include high numbers of repetitive and transposable elements [17, 20, 21].
These elements can cause severe mis-orientation of the genome sequences from the raw data sequences
generated from the sequencing process [22]. They also restrict the contiguity of whole genome
assemblies to kilobase (kb)-sized sequences that originate from low copy regions of the FOMG genome.
Therefore, detailed research on the repetitive and transposable elements of the FOMG genome has not
Page 2/11been conducted. To address these genome assembly problems while improving the quality of sequence
data, an approach that combines long reads and optical mapping can be used.
Optical mapping involves the physical mapping of a genome. It produces high-resolution restriction maps
that generate the correct genome orientation by comparing genome sequences. To construct a high-
resolution sequence motif map, this approach uses the distance between restriction sites [22] Optical
mapping is also more precise because its output is based on a physical consequence. Optical mapping,
combined with de novo assembly, can determine the actual orientation of genome contigs. Thus, this
combination of techniques can predict the position and size of gaps [22]. Optical mapping approaches
have also been applied in the analysis of the structural variation of the human genome [23, 24].
Therefore, the objective of the current study was to check the sequence orientation of the FOMG genome
using optical mapping approaches.
2. Materials And Methods
2.1. Fungal Isolate and High-Quality Megabase-Sized DNA
Extraction
Pathogenic strains of FOMG were isolated from infected vascular tissues of eggplant collected from
Menemen, Izmir (Turkey). A highly virulent single-spore isolate (FOMG109) was selected for the study. We
followed the protocol of Zhang et al. [25], with some minor modifications, to extract high-quality
megabase-sized DNA from FOMG109. Fungal DNA was extracted from a total of 20 g mycelia that were
obtained from seven days old culture grown on half-strength potato dextrose agar (Detroit, MI, USA).
Inocula from this culture were transferred aseptically to 55 ml potato dextrose broth (Detroit, MI, USA) and
shaken in an Orbital shaker at ∼110 rpm and 28°C for six days. The mycelia were separated by vacuum
filtration through sterilized filter paper in a Buchner funnel. After 20 g of FOMG109 mycelium is obtained,
intact nuclei from this fungal tissue was prepared following the method of option-A in the protocol of
Zhang et al. [25] and this nuclei was embedded in agarose plugs (low melting point) [25]. Finally, high-
quality megabase-sized DNA was extracted from these agarose plugs [25] and stored in tris-EDTA (TE)
buffer solution for further analyses. Purity of this extracted DNA was visually assessed by electrophoresis
using 1% agarose gel.
2.2. Map Assembly via BioNano Genomics
The nicking endonuclease enzyme, Nt.BspQ1 [(GCTCTTC), (New England BioLabs, Ipswich, MA, USA)]
was preferred in order to nick DNA of FOMG at particular sequence motifs. These nicked molecules of
FOMG were first labeled and then stained following the steps of IrysPrep Reagent Kit (BioNano Genomics,
CA, USA) as defined in the protocol of Luo et al. [26]. Irys platform of BioNano Genomics was used in
order to construct optical map of the FOMG genome. Prepared samples were loaded onto the IrysChip
nano channel array (BioNano Genomics) and run. This loaded DNA was first linearized then imaged
automatically by this platform (BioNano Genomics). In order to construct single molecule maps and
Page 3/11following to de novo assemble them into consensus physical maps, the software package of the IrysView
(BioNano Genomics) was used. AutoDetect software was utilized in order to provide data about length
information of DNA and also basic labelling. Using this software, the data of the raw DNA molecules that
smaller than 20 kb were converted into .bnx files. Assembly pipeline of BioNano Genomics [27] was used
to aligned, clustered, and assembled all DNA molecules that passing quality control and also > 180 kb.
The thresholds of P value were used as 2 × 10− 8 for pairwise assembly stages, 1 × 10− 9 for
extension/refinement stages, and 1 × 10− 15 for final refinement stages [27]. Finally, constructed BNG
maps of FOMG were controlled if there are any potential chimeric contigs of BNG.
2.3. Sequences of FOMG from NCBI
The most recent draft genome of FOMG [16] was obtained from GenBank NCBI under the accession
number MPIL00000000 was used as a reference genome.
2.4. Comparison between the Sequence-Map and the Map-
Map
To compare the previously published FOMG draft genome with the optical map, sequences from both
maps were digested in silico with Nt.BspQ1 using Knickers software. Sequence assemblies of the BNG
maps were aligned using RefAligner and the alignments were visualized using BioNano Genomics
software. Finally, snapshots of these alignments were saved using IrysView software
(http://www.bionanogenomics.com/support/software-updates/).
3. Results
3.1. BNG Map Assemblies of the FOMG Genome
The optical map of the FOMG genome was generated using BNG technology. FOMG DNA molecules were
nicked using Nt.BspQ1 nickase, and the resulting nicks were fluorescently labeled. An electric force was
applied to stretch the DNA molecules linearly, and then finally, all images were assembled into BNG
contigs and maps. The assembly consists of 103 contigs, and the longest BNG contig measures 3.05 Mb.
The N50 value of the BNG contig, which is 0.85 Mb.
The completed FOMG optical map encompasses 15 chromosomes, corresponding to the haploid
chromosome (chr) number of FOMG. All contigs measure 72.27 Mb, and after removing all the overlaps,
the BNG map of the FOMG genome is 57.7 Mb long. Table 1 presents the length/bp of each
chromosome. The largest chromosome is chr1 (6,854,690 length/bp), while the smallest chromosome is
chr14 (1,646,465 length/bp) (Table 1). The number of nucleotides in the overlapping regions were
356,780 N/bp (on chr13, Table 1) and 3,513,368 N/bp (on chr3, Table 1). A previous sequence assembly
[16] contains 15 chromosomes and other supercontigs, in which 11 chromosomes (chr 1, 2, 4, 5, 7–13)
were aligned and validated with BNG contigs. We were unable to align the remaining four chromosomes
(chr 3, 6, 14, and 15) to any BNG contig (Table 1). The N% values of chr 3, 6, 14, and 15 are over or close
Page 4/11to 50 N% (Table 1). Meanwhile, the lengths of chr 8, chr 13, and the supercontig of the BNG map were
longer than their corresponding sequences of the reference genome, and the lengths of the other
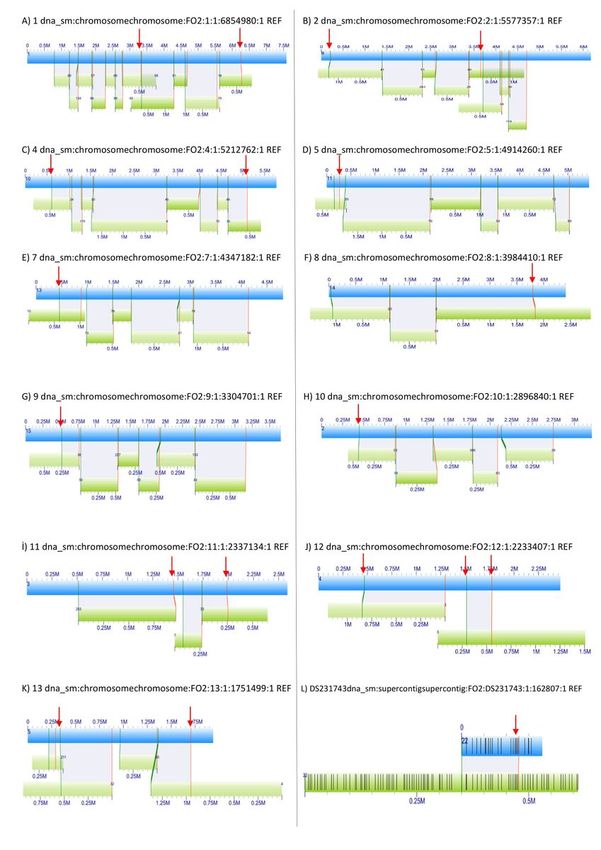
chromosomes were shorter (Fig. (1)).
Table 1
BNG optical map assembly statistics.
Chr no Length/bp N/bp N%
1 6,854,690 1,051,052 15.33
2 5,577,240 1,023,310 18.35
3 5,634,985 3,513,368 62.35
4 5,212,573 714,061 13.70
5 4,914,122 589,784 12.00
6 4,589,925 2,727,290 59.42
7 4,347,021 509,107 11.71
8 3,984,385 496,665 12.47
9 3,304,589 417,227 12.63
10 2,896,789 478,094 16.50
11 2,337,129 530,429 22.70
12 2,233,399 594,541 26.62
13 1,751,495 356,780 20.37
14 1,646,465 949,319 57.66
15 2,434,630 1,206,684 49.56
Total 57,719,437 15,157,711
The sequences in the BNG map are compared in Fig. (1). In general, there are 15 chrs and other
supercontig in the reference sequence assembly of Dong et al. [16] of which 11 chromosomes can be
aligned with a high degree of similarity and validated with BNG contigs, while the other four
chromosomes (chr 3, 6, 14, and 15) could not be aligned with any other BNG contigs (Fig. (1)).
4. Discussion
Short-read sequencing techniques have made it affordable to study the genetics and the genomes of
various species [28]. However, the short sequence lengths obtained using these techniques make it
difficult to assemble sequencing reads of the most complex and repetitive regions of the genome,
resulting in collapsed and fragmented genome assemblies [28]. Therefore, assemblies based on short-
read sequencing are limited in the accuracy of downstream analyses such as the identification of
Page 5/11genomic variations [29]. Several methodologies, such as next generation sequencing (NGS) and recently
developed algorithms, have been developed to overcome this problem, it has been difficult to completely
eliminate the shortcomings of short-read length sequencing [24]. The power of NGS lies in its capacity to
generate a huge volume of reads. However, because these reads are rather short, it is impossible to
resolve the assembly of many families of repetitive DNA elements that populate fungal genomes.
Moreover, fungal genome sequencing is also hampered by the wrong orientation of assembled contigs.
The recent development of long-read sequencing methods, such as optical mapping, have enabled the
spanning of most repeats and the generation more complete and correct genome assemblies [30]. Optical
mapping techniques have been performed extensively in genomic studies on human diseases, animals,
plants, and microorganisms [24]. In the original version of the method, high molecular weight DNA
molecules were cleaved on an open glass surfaces and then imaged on fluorescence microscopy [31].
The image from the fluorescence microscopy help to order the partially digested molecules, which is
called optical map. The genomic sequence of an organism from de novo sequencing is align on to image
and therefore sequence information is placed in correct order of optical map [32]. Using these techniques,
it is possible to detect errors in the arrangement and structure of contigs, even if the organism’s genome
contains distinct repetitive regions [33]. Therefore, optical maps are an ideal means of finishing fungal
sequence assembly because in most cases, the restriction regions cover repetitive regions [18] such as
retrotransposons [20]. Relying on the currently published complete genome sequences that are stored at
NCBI may be risky because such sequences likely contain assembly errors [22]. In current study, BNG
technology was used to generate an optical map of FOMG and verify contigs. We demonstrated that
short-read sequencing assembly could generate some assembly errors within the FOMG genome (Table 1,
Fig. (1)). Thus, by utilizing more uniform linearization, BNG technology highly improves the throughput
and accuracy of genome length prediction. Moreover, by using nicking enzymes to generate only single-
strand breaks, this approach preserves the contiguity of molecules more than other optical mapping
technologies [24].
Dong et al. [16] reported that the size of the FOMG reference genome is 53.9 Mb, with an N50 value of
0.56 Mb. However, optical mapping indicates a genome size of 57.7 Mb with an N50 value of 0.85 Mb
(Table 1). The difference in sequence length may be due to errors in the assembly of the draft genome,
which was produced by the Genome Québec (Montreal, Canada) platform [16]. These errors were
corrected by BNG mapping to ensure the efficient use of the data. Support of our results, previous studies
have indicated that the length of the optical map of FOMG is slightly different from that of the assembled
genome [23, 34]. Although the length differences is often attributed to repetitive regions of the genome,
they may also result from poor the quality of the assemblies using both sides of the comparison [23]. The
supercontig BNG map was obtained from a few genomic sequences that were aligned onto the
supercontig. This is likely because previously sequenced FOMG DNA was not derived from high
molecular weight DNA (Fig. (1)).
We obtained a high N50 value of 0.85 Mb, indicating that a high percentage of the BNG optical map
aligned with the reference map. The N50 value defines how much of an assembly is consists of
Page 6/11segments larger than a given size where "N" is the size of the scaffold or contig and "50" is the assembly
length percentage [23]. Solely genome assemblies with mega-base scale N50s can be verified performing
optical mapping technology because contigs/scaffolds smaller than 100 kb usually do not have
sufficient nick knowledge to be securely aligned [23].
In the current study, each DNA sequence was converted into a restriction map format to match the
sequence with the BNG map contigs. As seen in Fig. (1), correct matches between the nick patterns of the
BNG map contigs and the reference DNA sequence confirms the base pair distances between nick sites in
the DNA sequence. Mismatched regions of the genome may be due to the poor quality of the assemblies
of the reference genome.
5. Conclusion
BNG optical mapping of the FOMG genome was completed in the current study. The genome sequence of
FOMG that deposited into the GenBank NCBI under the accession number MPIL00000000 and BNG
optical map mainly match each other. On the other hand, it is still un-sequenced genomic regions exist in
the FOMG genome. Current sequence order of FOMG genome deposited into GenBank NCBI is not in right
order. This error is likely due to the presence of highly repetitive elements distributed throughout the
genome, causing wrong genome assembly. Usage of megabase-sized DNA as sequencing material is
important to enable the coverage of the entire genome. After completing the assembly of genome
sequences, the completed genome should be aligned with the optical map.
Declarations
Conflict of interest
Author declares that they have no conflict of interest
Funding:
The study was supported by The Scientific and Technological Research Council of Turkey (TUBITAK),
project no COST-114O866
Ethical approval:
This article does not contain any studies with human participants or animals performed by any of the
authors
ACKNOWLEDGMENTS: The study was supported by The Scientific and Technological Research Council
of Turkey (TUBITAK), project no COST-114O866.
References
Page 7/111. Altınok HH, Can C (2010) Characterization of Fusarium oxysporum f. sp. melongenae isolates from
eggplant in Turkey by pathogenicity, VCG and RAPD analysis. Phytoparasitica 38(2):149–157
2. Altinok HH, Can C, Altinok MA (2018) Characterization of Fusarium oxysporum f. sp. melongenae
isolates from Turkey with ISSR markers and DNA sequence analyses. Eur J Plant Pathol 150(3):609–
621
3. Sahar P, Sahi ST, Jabbar A, Rehman A, Riaz K et al (2013) Chemical and biological management of
Fusarium oxysporum f. sp melongenae. Pakistan journal of Phytopathology 25(2):155–159
4. Kalloo G, Eggplant: Solanum melongena L, in Genetic improvement of vegetable crops. Elsevier,
1993, 587–604
5. Matuo T, Ishigami K (1958) On the wilt of Solanum melongena L. and its causal fungus Fusarium
oxysporum f. melongenae nf. Jpn J Phytopathol 23(4):189–192
6. Nattrass RM Host lists of Kenya fungi and bacteria. 1961, 81, 1–46
7. Van Steekelenburg N (1976) Fusarium wilt of eggplant in the Netherlands. Netherlands Journal of
Plant Pathology 82(5):191–192
8. Alfieri S Jr (1984) Index of plant diseases in Florida. Fla Dept Agric Cons Serv Div Plant Ind Bull
11:1–389
9. Alfieri S Diseases and disorders of plants in Florida. Florida Department of Agriculture and Consumer
Services, Division of Plant Industry, 1994, 14
10. Cappelli C, Stravato V, Rotino G, Buonaurio R Sources of resistance among Solanum spp. to an
Italian isolate of Fusarium oxisporum f. sp. melongenae. in EUCARPIA: IXth meeting on genetics and
breeding on Capsicum and eggplant, 1995
11. Holevas C, Chitzanidis A, Pappas A, Tzamos E, Elena K et al. Disease agents of cultivated plants
observed in Greece from 1981 to 1990. in Annales de l'Institut phytopathologique Benaki. Benaki
Phytopathologique Institute, 2000, 1–96
12. Cho WD, Shin HD List of plant diseases in Korea (4th ed). Korean Society of Plant Pathology, 2004
13. Urrutia Herrada M, Gomez Garcia V, Tello Marquina J (2004) Fusarium wilt on eggplant in Almeria
(Spain). Boletin de Sanidad Vegetal Plagas 30(1):85–92
14. Zhuang W (2005) Fungi of northwestern China. Mycotaxon, Ltd., Ithaca
15. Altınok H (2005) First report of Fusarium wilt of eggplant caused by Fusarium oxysporum f. sp.
melongenae in Turkey. Plant Pathol 54(4):577–577
16. Dong Z, Hsiang T, Luo M, Xiang M Draft genome sequence of an isolate of Fusarium oxysporum f.
sp. melongenae, the causal agent of Fusarium wilt of eggplant. Genome Announcements, 2017, 5(7)
17. Rao S, Sharda S, Oddi V, Nandineni MR (2018) The landscape of repetitive elements in the refined
genome of chilli anthracnose fungus Colletotrichum truncatum. Front Microbiol 9:2367
18. Stapley J, Feulner PG, Johnston SE, Santure AW, Smadja CM. Variation in recombination frequency
and distribution across eukaryotes: patterns and processes. Philosophical Transactions of the Royal
Society B: Biological Sciences, 2017, 372(1736), 20160455
Page 8/1119. Deltour P, França S, Heyman L, Pereira O, Höfte M (2018) Comparative analysis of pathogenic and
nonpathogenic Fusarium oxysporum populations associated with banana on a farm in Minas
Gerais, Brazil. Plant Pathol 67(3):707–718
20. Ates D, Altinok HH, Ozkuru E, Ferik F, Erdogmus S et al (2019) Population structure and linkage
disequilibrium in a large collection of Fusarium oxysporum strains analysed through iPBS markers. J
Phytopathol 167(10):576–590
21. Zhang Y, Yang H, Turra D, Zhou S, Ayhan DH et al (2020) The genome of opportunistic fungal
pathogen Fusarium oxysporum carries a unique set of lineage-specific chromosomes.
Communications Biology 3(1):1–12
22. de Jesus Sousa T, Parise D, Profeta R, Parise MTD, Gomide ACP et al (2019) Re-sequencing and
optical mapping reveals misassemblies and real inversions on Corynebacterium pseudotuberculosis
genomes. Sci Rep 9(1):1–11
23. Udall JA, Dawe RK (2018) Is it ordered correctly? Validating genome assemblies by optical mapping.
Plant Cell 30(1):7–14
24. Yuan Y, Chung CYL, Chan TF (2020) Advances in optical mapping for genomic research.
Computational Structural Biotechnology Journal 18:2051–2062
25. Zhang M, Zhang Y, Scheuring CF, Wu CC, Dong JJ et al (2012) Preparation of megabase-sized DNA
from a variety of organisms using the nuclei method for advanced genomics research. Nat Protoc
7(3):467–478
26. Luo MC, Deal KR, Murray A, Zhu T, Hastie AR et al. Optical Nano-mapping and analysis of plant
genomes, in Plant Cytogenetics, Springer, 2016, 103–117
27. Zhu T, Hu Z, Rodriguez JC, Deal KR, Dvorak J et al (2018) Analysis of Brachypodium genomes with
genome-wide optical maps. Genome 61(8):559–565
28. Treangen TJ, Salzberg SL (2012) Repetitive DNA and next-generation sequencing: computational
challenges and solutions. Nat Rev Genet 13(1):36–46
29. Cameron DL, Di Stefano L, Papenfuss AT (2019) Comprehensive evaluation and characterisation of
short read general-purpose structural variant calling software. Nat Commun 10(1):1–11
30. Chen P, Jing X, Liao B, Zhu Y, Xu J et al. BioNano genome map resource for Oryza sativa ssp.
japonica and indica and its application in rice genome sequence correction and gap filling. Molecular
Plant, 2017, 10(6), 895–898
31. Meng XJ, Paul PS, Halbur PG, Morozov I (1995) Sequence comparison of open reading frames 2 to 5
of low and high virulence United States isolates of porcine reproductive and respiratory syndrome
virus. J Gen Virol 76(12):3181–3188
32. Staňková H, Hastie AR, Chan S, Vrána J, Tulpová Z et al (2016) BioNano genome mapping of
individual chromosomes supports physical mapping and sequence assembly in complex plant
genomes. Plant Biotechnol J 14(7):1523–1531
33. Latreille P, Norton S, Goldman BS, Henkhaus J, Miller N et al (2007) Optical mapping as a routine tool
for bacterial genome sequence finishing. BMC Genom 8(1):1–6
Page 9/1134. Van Kan JA, Stassen JH, Mosbach A, Van Der Lee TA, Faino L et al (2017) A gapless genome
sequence of the fungus Botrytis cinerea. Molecular Plant Pathology 18(1):75–89
Figures
Figure 1
Page 10/11Comparisons of sequences to the BNG map. The green box is a BNG contig (~6.5Mb), blue boxes are
sequences, the red lines within boxes are restriction sites, and the red lines between green and blue boxes
indicate matches. The potential chimeric points in each sequence are indicated by red arrows and the
original sequence name is the figure title.
Page 11/11You can also read